Nanopatch to proxmox ve 3.3 web interface for displaying lmsensors
Greetings, colleagues.
A small task has recently appeared on the overall assessment of the state of a host machine with a proxmox, which is practically only through a web interface. Simply, before the start of long demanding tasks (and a little later) I would like to see that the machine is “alive” and the load does not lead to a potentially dangerous situation, everything is cool and not overloaded. It is clear that there are more advanced things like nagios / munin, etc., with different notification and control schemes for the situation, beautiful graphs and storage of the entire data history. But let's narrow down the task to contemplation of simple textual information, which can be obtained by one console command. And we will display this information in a row of the table in the tab “Summary” for the node.
So, lm sensors - software that allows you to collect information about different sensors in the system - temperature, voltage and fan speed. We will use it, install:
Next, we start sensors-detect, select yes / no to scan the necessary categories of sensors in the system and then request full information about them:
')
Now the patch itself (not git, but “manual”). Before the start of changes, we make copies of the files, we understand that all this should happen during the "non-working" service time. Well, all the fear and risk in case of anything - naturally on you. Also remember that all this will fly off after the nearest update by you proxmox.
1. The server part is the perl-module Nodes, in it we need the handler / api2 / json / nodes / NODENAME / status:
Go to about line 262 and add this:
Pearl connoisseurs can wrap this string as a condition of availability of the sensors command on the machine.
2. The client part is the pvemanager javascript module:
We go approximately on 12572 line and add these:
Just below we find the string
and in a convenient order of rows in the table (I added after rootfs), below, we add this:
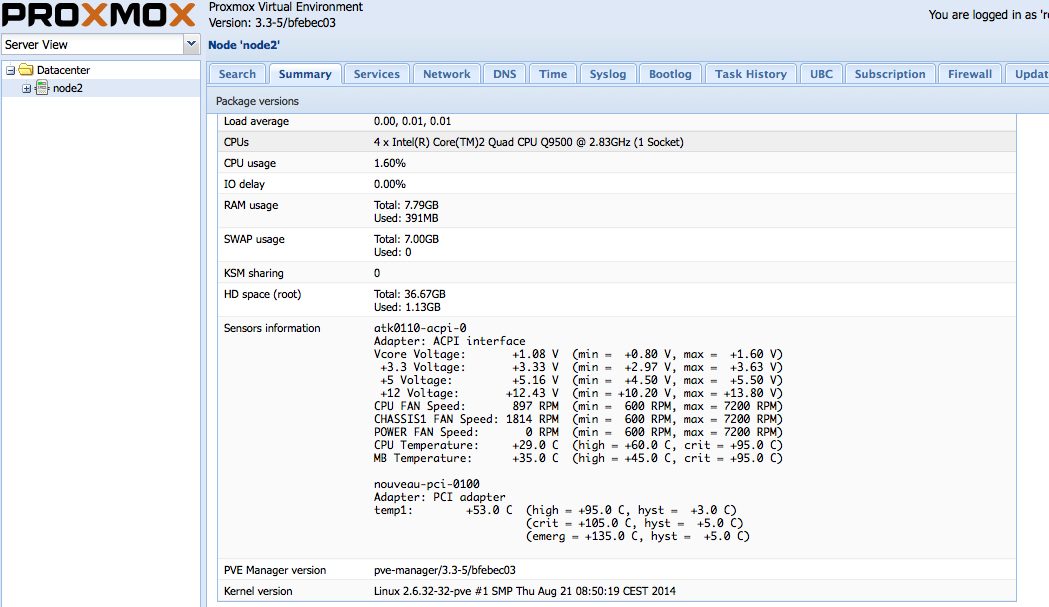
Rebooting the server (or unloading the pearl-barley module Nodes.pm, how to do it “on the fly” - I do not know yet, not a pearl keeper). Now we go to the web-interface, select the node, click the Summary tab and observe the information updated every second on the sensors. It looks like this:
In principle, using this framework, you can display any information you need through every second status-notification node, not only sensors. It is important to understand that the launch of the collection of such information should not take a lot of time (an order of magnitude less than a second).
If someone has the time and desire to put this result into something more public (pull-request in pve-manager) - you're welcome. But I personally do not see a special need for this, the task of monitoring the temperature and the fans in the minimum necessary for me variant has been solved.
Thank you for your attention, I hope the information above will be useful to someone.
1. Website LM Sensors: lm-sensors.org .
2. GitHub pve-manager repository: github.com/proxmox/pve-manager .
3. The proxmox itself: proxmox.com .
A small task has recently appeared on the overall assessment of the state of a host machine with a proxmox, which is practically only through a web interface. Simply, before the start of long demanding tasks (and a little later) I would like to see that the machine is “alive” and the load does not lead to a potentially dangerous situation, everything is cool and not overloaded. It is clear that there are more advanced things like nagios / munin, etc., with different notification and control schemes for the situation, beautiful graphs and storage of the entire data history. But let's narrow down the task to contemplation of simple textual information, which can be obtained by one console command. And we will display this information in a row of the table in the tab “Summary” for the node.
So, lm sensors - software that allows you to collect information about different sensors in the system - temperature, voltage and fan speed. We will use it, install:
apt-get install lm-sensors Next, we start sensors-detect, select yes / no to scan the necessary categories of sensors in the system and then request full information about them:
sensors ')
Now the patch itself (not git, but “manual”). Before the start of changes, we make copies of the files, we understand that all this should happen during the "non-working" service time. Well, all the fear and risk in case of anything - naturally on you. Also remember that all this will fly off after the nearest update by you proxmox.
1. The server part is the perl-module Nodes, in it we need the handler / api2 / json / nodes / NODENAME / status:
vi /usr/share/perl5/PVE/API2/Nodes.pm Go to about line 262 and add this:
$res->{sensinfo} = `sensors`; Pearl connoisseurs can wrap this string as a condition of availability of the sensors command on the machine.
2. The client part is the pvemanager javascript module:
/usr/share/pve-manager/ext4/pvemanagerlib.js We go approximately on 12572 line and add these:
var render_sensinfo = function(value) { return "<pre>" + value + "</pre>"; } Just below we find the string
var rows = { and in a convenient order of rows in the table (I added after rootfs), below, we add this:
sensinfo : { header: gettext('Sensors information'), required: true, renderer: render_sensinfo }, Rebooting the server (or unloading the pearl-barley module Nodes.pm, how to do it “on the fly” - I do not know yet, not a pearl keeper). Now we go to the web-interface, select the node, click the Summary tab and observe the information updated every second on the sensors. It looks like this:
In principle, using this framework, you can display any information you need through every second status-notification node, not only sensors. It is important to understand that the launch of the collection of such information should not take a lot of time (an order of magnitude less than a second).
If someone has the time and desire to put this result into something more public (pull-request in pve-manager) - you're welcome. But I personally do not see a special need for this, the task of monitoring the temperature and the fans in the minimum necessary for me variant has been solved.
Thank you for your attention, I hope the information above will be useful to someone.
Links
1. Website LM Sensors: lm-sensors.org .
2. GitHub pve-manager repository: github.com/proxmox/pve-manager .
3. The proxmox itself: proxmox.com .
Source: https://habr.com/ru/post/242019/
All Articles