Flexible graphing in JavaFX

JavaFX is a pretty weird thing. On the one hand, it seems so thoughtfully and conveniently enough that I want to use it wherever possible. On the other hand, it is so clumsy that I want to rewrite it. Some parts of the GUI work very strangely, others are declared as final and cannot be supplemented.
If you're wondering how the graphical elements in JavaFX are presented and how you can diversify your schedule, then open the cat at your own risk.
GUI Structure in JavaFX
JavaFX is a RIA framework. Also, all settings for the appearance of graphic elements can be changed only through CSS, which makes it impossible to use the usual methods of changing the interface that were used in Swing or AWT through Graphics.
Also, unlike other Java GUI frameworks, creating new graphical elements in JavaFX is extremely difficult because of the complex implementation of JavaFX itself. Therefore, during the creation of their elements they are constructed from old ones.
This is also what JavaFX developers themselves do when creating complex controllers, such as graphics.
There is nothing new in this, but the main difference between JavaFX and other frameworks is that the structure is a tree with full access, that is, you can reach all of these elements and easily adjust them (via CSS or something else).
')
As an example, I will give the setting LineChart.
LineChart Setup
In order to adjust something, you need to clearly understand what it costs.
The function lookupAll will help us to understand what LineChart consists of and,
Having executed such code:
VBox vBox = new VBox(); LineChart chart = new LineChart(new NumberAxis(), new NumberAxis()); chart.getData().add(new XYChart.Series<>("Temp1", FXCollections.observableArrayList(new XYChart.Data<Object, Object>(1, 1), new XYChart.Data<Object, Object>(2, 2), new XYChart.Data<Object, Object>(3, 4)))); vBox.getChildren().add(chart); primaryStage.setScene(new Scene(vBox)); primaryStage.show(); ((XYChart.Series) chart.getData().get(0)).getData().addAll(new XYChart.Data<>(5, 5)); chart.lookupAll("*").forEach(c->{ System.out.println(c); System.out.println(); }); Result
LineChart @ be5a370 [styleClass = chart]
Label @ 7415bead [styleClass = label chart-title] ''
Text [text = "", x = 0.0, y = 0.0, alignment = LEFT, origin = BASELINE, boundsType = LOGICAL_VERTICAL_CENTER, font = Font [name = System Regular, family = System, style = Regular, size = 18.200000762939453], fontSmoothingType = LCD, fill = 0x333333ff]
Chart $ 1 @ 2fca6f84 [styleClass = chart-content]
Region @ 285a8729 [styleClass = chart-plot-background]
XYChart $ 1 @ 53306ff
Path [elements = [], fill = null, fillRule = NON_ZERO]
Path [elements = [MoveTo [x = 39.0, y = 45.0], LineTo [x = 481.0, y = 45.0], LineTo [x = 481.0, y = 81.0], LineTo [x = 39.0, y = 81.0], ClosePath , MoveTo [x = 39.0, y = 116.0], LineTo [x = 481.0, y = 116.0], LineTo [x = 481.0, y = 152.0], LineTo [x = 39.0, y = 152.0], ClosePath, MoveTo [x = 39.0, y = 187.0], LineTo [x = 481.0, y = 187.0], LineTo [x = 481.0, y = 223.0], LineTo [x = 39.0, y = 223.0], ClosePath, MoveTo [x = 39.0, y = 258.0], LineTo [x = 481.0, y = 258.0], LineTo [x = 481.0, y = 294.0], LineTo [x = 39.0, y = 294.0], ClosePath], fill = null, fillRule = NON_ZERO]
Path [elements = [MoveTo [x = 73.5, y = 10.0], LineTo [x = 73.5, y = 329.0], MoveTo [x = 107.5, y = 10.0], LineTo [x = 107.5, y = 329.0], MoveTo [x = 141.5, y = 10.0], LineTo [x = 141.5, y = 329.0], MoveTo [x = 175.5, y = 10.0], LineTo [x = 175.5, y = 329.0], MoveTo [x = 209.5, y = 10.0], LineTo [x = 209.5, y = 329.0], MoveTo [x = 243.5, y = 10.0], LineTo [x = 243.5, y = 329.0], MoveTo [x = 277.5, y = 10.0], LineTo [ x = 277.5, y = 329.0], MoveTo [x = 311.5, y = 10.0], LineTo [x = 311.5, y = 329.0], MoveTo [x = 345.5, y = 10.0], LineTo [x = 345.5, y = 329.0], MoveTo [x = 379.5, y = 10.0], LineTo [x = 379.5, y = 329.0], MoveTo [x = 413.5, y = 10.0], LineTo [x = 413.5, y = 329.0], MoveTo [x = 447.5, y = 10.0], LineTo [x = 447.5, y = 329.0], MoveTo [x = 481.5, y = 10.0], LineTo [x = 481.5, y = 329.0]], fill = null, fillRule = NON_ZERO, stroke = 0xdcdcdcff, strokeWidth = 1.0]
Path [elements = [MoveTo [x = 39.0, y = 294.5], LineTo [x = 481.0, y = 294.5], MoveTo [x = 39.0, y = 258.5], LineTo [x = 481.0, y = 258.5], MoveTo [x = 39.0, y = 223.5], LineTo [x = 481.0, y = 223.5], MoveTo [x = 39.0, y = 187.5], LineTo [x = 481.0, y = 187.5], MoveTo [x = 39.0, y = 152.5], LineTo [x = 481.0, y = 152.5], MoveTo [x = 39.0, y = 116.5], LineTo [x = 481.0, y = 116.5], MoveTo [x = 39.0, y = 81.5], LineTo [ x = 481.0, y = 81.5], MoveTo [x = 39.0, y = 45.5], LineTo [x = 481.0, y = 45.5], MoveTo [x = 39.0, y = 10.5], LineTo [x = 481.0, y = 10.5]], fill = null, fillRule = NON_ZERO, stroke = 0xdcdcdcff, strokeWidth = 1.0]
Line [startX = 39.5, startY = 10.0, endX = 39.5, endY = 329.0, stroke = 0x646464ff, strokeWidth = 1.0]
Line [startX = 39.0, startY = 329.5, endX = 481.0, endY = 329.5, stroke = 0x646464ff, strokeWidth = 1.0]
Group @ 2bdd794e [styleClass = plot-content]
Path [elements = [MoveTo [x = 136.0, y = 248.0], LineTo [x = 136.0, y = 248.0], LineTo [x = 272.0, y = 177.0], LineTo [x = 408.0, y = 35.0]], fill = null, fillRule = NON_ZERO, stroke = 0xf3622dff, strokeWidth = 3.0]
StackPane @ 26193c9c [styleClass = chart-line-symbol series0 data0 default-color0]
StackPane @ 6bb5f434 [styleClass = chart-line-symbol series0 data1 default-color0]
StackPane @ 38bfa9d7 [styleClass = chart-line-symbol series0 data2 default-color0]
NumberAxis @ 392fac3b [styleClass = axis]
Label @ 2051bac6 [styleClass = label axis label] ''
Text [text = "", x = 0.0, y = 0.0, alignment = LEFT, origin = BASELINE, boundsType = LOGICAL_VERTICAL_CENTER, font = Font [name = System Regular, family = System, style = Regular, size = 13.0], fontSmoothingType = LCD, fill = 0x333333ff]
Path [elements = [MoveTo [x = 0.0, y = 0.0], LineTo [x = 0.0, y = 8.0], MoveTo [x = 34.0, y = 0.0], LineTo [x = 34.0, y = 8.0], MoveTo [x = 68.0, y = 0.0], LineTo [x = 68.0, y = 8.0], MoveTo [x = 102.0, y = 0.0], LineTo [x = 102.0, y = 8.0], MoveTo [x = 136.0, y = 0.0], LineTo [x = 136.0, y = 8.0], MoveTo [x = 170.0, y = 0.0], LineTo [x = 170.0, y = 8.0], MoveTo [x = 204.0, y = 0.0], LineTo [ x = 204.0, y = 8.0], MoveTo [x = 238.0, y = 0.0], LineTo [x = 238.0, y = 8.0], MoveTo [x = 272.0, y = 0.0], LineTo [x = 272.0, y = 8.0], MoveTo [x = 306.0, y = 0.0], LineTo [x = 306.0, y = 8.0], MoveTo [x = 340.0, y = 0.0], LineTo [x = 340.0, y = 8.0], MoveTo [x = 374.0, y = 0.0], LineTo [x = 374.0, y = 8.0], MoveTo [x = 408.0, y = 0.0], LineTo [x = 408.0, y = 8.0], MoveTo [x = 442.0, y = 0.0 ], LineTo [x = 442.0, y = 8.0]], fill = null, fillRule = NON_ZERO, stroke = 0xc3c3c3ff, strokeWidth = 1.0]
Path [elements = [MoveTo [x = 7.0, y = 1.0], LineTo [x = 7.0, y = 5.0], MoveTo [x = 14.0, y = 1.0], LineTo [x = 14.0, y = 5.0], MoveTo [x = 20.0, y = 1.0], LineTo [x = 20.0, y = 5.0], MoveTo [x = 27.0, y = 1.0], LineTo [x = 27.0, y = 5.0], MoveTo [x = 41.0, y = 1.0], LineTo [x = 41.0, y = 5.0], MoveTo [x = 48.0, y = 1.0], LineTo [x = 48.0, y = 5.0], MoveTo [x = 54.0, y = 1.0], LineTo [ x = 54.0, y = 5.0], MoveTo [x = 61.0, y = 1.0], LineTo [x = 61.0, y = 5.0], MoveTo [x = 68.0, y = 1.0], LineTo [x = 68.0, y = 5.0], MoveTo [x = 75.0, y = 1.0], LineTo [x = 75.0, y = 5.0], MoveTo [x = 82.0, y = 1.0], LineTo [x = 82.0, y = 5.0], MoveTo [x = 88.0, y = 1.0], LineTo [x = 88.0, y = 5.0], MoveTo [x = 95.0, y = 1.0], LineTo [x = 95.0, y = 5.0], MoveTo [x = 109.0, y = 1.0 ], LineTo [x = 109.0, y = 5.0], MoveTo [x = 116.0, y = 1.0], LineTo [x = 116.0, y = 5.0], MoveTo [x = 122.0, y = 1.0], LineTo [x = 122.0, y = 5.0], MoveTo [x = 129.0, y = 1.0], LineTo [x = 129.0, y = 5.0], MoveTo [x = 143.0, y = 1.0], LineTo [x = 143.0, y = 5.0] , MoveTo [x = 150.0, y = 1.0], LineTo [x = 150.0, y = 5.0], MoveTo [x = 156.0, y = 1.0], LineTo [x = 156.0, y = 5.0], MoveTo [x = 163.0 , y = 1.0], LineTo [x = 163.0, y = 5.0], MoveT o [x = 177.0, y = 1.0], LineTo [x = 177.0, y = 5.0], MoveTo [x = 184.0, y = 1.0], LineTo [x = 184.0, y = 5.0], MoveTo [x = 190.0, y = 1.0], LineTo [x = 190.0, y = 5.0], MoveTo [x = 197.0, y = 1.0], LineTo [x = 197.0, y = 5.0], MoveTo [x = 211.0, y = 1.0], LineTo [x = 211.0, y = 5.0], MoveTo [x = 218.0, y = 1.0], LineTo [x = 218.0, y = 5.0], MoveTo [x = 224.0, y = 1.0], LineTo [x = 224.0, y = 5.0], MoveTo [x = 231.0, y = 1.0], LineTo [x = 231.0, y = 5.0], MoveTo [x = 245.0, y = 1.0], LineTo [x = 245.0, y = 5.0], MoveTo [ x = 252.0, y = 1.0], LineTo [x = 252.0, y = 5.0], MoveTo [x = 258.0, y = 1.0], LineTo [x = 258.0, y = 5.0], MoveTo [x = 265.0, y = 1.0], LineTo [x = 265.0, y = 5.0], MoveTo [x = 279.0, y = 1.0], LineTo [x = 279.0, y = 5.0], MoveTo [x = 286.0, y = 1.0], LineTo [x = 286.0, y = 5.0], MoveTo [x = 292.0, y = 1.0], LineTo [x = 292.0, y = 5.0], MoveTo [x = 299.0, y = 1.0], LineTo [x = 299.0, y = 5.0 ], MoveTo [x = 306.0, y = 1.0], LineTo [x = 306.0, y = 5.0], MoveTo [x = 313.0, y = 1.0], LineTo [x = 313.0, y = 5.0], MoveTo [x = 320.0, y = 1.0], LineTo [x = 320.0, y = 5.0], MoveTo [x = 326.0, y = 1.0], LineTo [x = 326.0, y = 5.0], MoveTo [x = 333.0, y = 1.0] , LineTo [x = 333.0, y = 5.0 ], MoveTo [x = 340.0, y = 1.0], LineTo [x = 340.0, y = 5.0], MoveTo [x = 347.0, y = 1.0], LineTo [x = 347.0, y = 5.0], MoveTo [x = 354.0, y = 1.0], LineTo [x = 354.0, y = 5.0], MoveTo [x = 360.0, y = 1.0], LineTo [x = 360.0, y = 5.0], MoveTo [x = 367.0, y = 1.0] , LineTo [x = 367.0, y = 5.0], MoveTo [x = 374.0, y = 1.0], LineTo [x = 374.0, y = 5.0], MoveTo [x = 381.0, y = 1.0], LineTo [x = 381.0 , y = 5.0], MoveTo [x = 388.0, y = 1.0], LineTo [x = 388.0, y = 5.0], MoveTo [x = 394.0, y = 1.0], LineTo [x = 394.0, y = 5.0], MoveTo [x = 401.0, y = 1.0], LineTo [x = 401.0, y = 5.0], MoveTo [x = 408.0, y = 1.0], LineTo [x = 408.0, y = 5.0], MoveTo [x = 415.0, y = 1.0], LineTo [x = 415.0, y = 5.0], MoveTo [x = 422.0, y = 1.0], LineTo [x = 422.0, y = 5.0], MoveTo [x = 428.0, y = 1.0], LineTo [x = 428.0, y = 5.0], MoveTo [x = 435.0, y = 1.0], LineTo [x = 435.0, y = 5.0], MoveTo [x = 442.0, y = 1.0], LineTo [x = 442.0, y = 5.0]], fill = null, fillRule = NON_ZERO, stroke = 0xc3c3c3ff, strokeWidth = 1.0]
Text [text = "0.00", x = 0.0, y = 0.0, alignment = LEFT, origin = BASELINE, boundsType = LOGICAL, font = Font [name = System Regular, family = System, style = Regular, size = 10.800000190734863 ], fontSmoothingType = GRAY, fill = 0x585858ff]
Text [text = "0.25", x = 0.0, y = 0.0, alignment = LEFT, origin = BASELINE, boundsType = LOGICAL, font = Font [name = System Regular, family = System, style = Regular, size = 10.800000190734863 ], fontSmoothingType = GRAY, fill = 0x585858ff]
Text [text = "0.50", x = 0.0, y = 0.0, alignment = LEFT, origin = BASELINE, boundsType = LOGICAL, font = Font [name = System Regular, family = System, style = Regular, size = 10.800000190734863 ], fontSmoothingType = GRAY, fill = 0x585858ff]
Text [text = "0.75", x = 0.0, y = 0.0, alignment = LEFT, origin = BASELINE, boundsType = LOGICAL, font = Font [name = System Regular, family = System, style = Regular, size = 10.800000190734863 ], fontSmoothingType = GRAY, fill = 0x585858ff]
Text [text = "1.00", x = 0.0, y = 0.0, alignment = LEFT, origin = BASELINE, boundsType = LOGICAL, font = Font [name = System Regular, family = System, style = Regular, size = 10.800000190734863 ], fontSmoothingType = GRAY, fill = 0x585858ff]
Text [text = "1.25", x = 0.0, y = 0.0, alignment = LEFT, origin = BASELINE, boundsType = LOGICAL, font = Font [name = System Regular, family = System, style = Regular, size = 10.800000190734863 ], fontSmoothingType = GRAY, fill = 0x585858ff]
Text [text = "1.50", x = 0.0, y = 0.0, alignment = LEFT, origin = BASELINE, boundsType = LOGICAL, font = Font [name = System Regular, family = System, style = Regular, size = 10.800000190734863 ], fontSmoothingType = GRAY, fill = 0x585858ff]
Text [text = "1.75", x = 0.0, y = 0.0, alignment = LEFT, origin = BASELINE, boundsType = LOGICAL, font = Font [name = System Regular, family = System, style = Regular, size = 10.800000190734863 ], fontSmoothingType = GRAY, fill = 0x585858ff]
Text [text = "2.00", x = 0.0, y = 0.0, alignment = LEFT, origin = BASELINE, boundsType = LOGICAL, font = Font [name = System Regular, family = System, style = Regular, size = 10.800000190734863 ], fontSmoothingType = GRAY, fill = 0x585858ff]
Text [text = "2.25", x = 0.0, y = 0.0, alignment = LEFT, origin = BASELINE, boundsType = LOGICAL, font = Font [name = System Regular, family = System, style = Regular, size = 10.800000190734863 ], fontSmoothingType = GRAY, fill = 0x585858ff]
Text [text = "2.50", x = 0.0, y = 0.0, alignment = LEFT, origin = BASELINE, boundsType = LOGICAL, font = Font [name = System Regular, family = System, style = Regular, size = 10.800000190734863 ], fontSmoothingType = GRAY, fill = 0x585858ff]
Text [text = "2.75", x = 0.0, y = 0.0, alignment = LEFT, origin = BASELINE, boundsType = LOGICAL, font = Font [name = System Regular, family = System, style = Regular, size = 10.800000190734863 ], fontSmoothingType = GRAY, fill = 0x585858ff]
Text [text = "3.00", x = 0.0, y = 0.0, alignment = LEFT, origin = BASELINE, boundsType = LOGICAL, font = Font [name = System Regular, family = System, style = Regular, size = 10.800000190734863 ], fontSmoothingType = GRAY, fill = 0x585858ff]
Text [text = "3.25", x = 0.0, y = 0.0, alignment = LEFT, origin = BASELINE, boundsType = LOGICAL, font = Font [name = System Regular, family = System, style = Regular, size = 10.800000190734863 ], fontSmoothingType = GRAY, fill = 0x585858ff]
NumberAxis @ 5a503aa1 [styleClass = axis]
Label @ 63297d6d [styleClass = label axis label] ''
Text [text = "", x = 0.0, y = 0.0, alignment = LEFT, origin = BASELINE, boundsType = LOGICAL_VERTICAL_CENTER, font = Font [name = System Regular, family = System, style = Regular, size = 13.0], fontSmoothingType = LCD, fill = 0x333333ff]
Path [elements = [MoveTo [x = 21.0, y = 319.0], LineTo [x = 29.0, y = 319.0], MoveTo [x = 21.0, y = 284.0], LineTo [x = 29.0, y = 284.0], MoveTo [x = 21.0, y = 248.0], LineTo [x = 29.0, y = 248.0], MoveTo [x = 21.0, y = 213.0], LineTo [x = 29.0, y = 213.0], MoveTo [x = 21.0, y = 177.0], LineTo [x = 29.0, y = 177.0], MoveTo [x = 21.0, y = 142.0], LineTo [x = 29.0, y = 142.0], MoveTo [x = 21.0, y = 106.0], LineTo [ x = 29.0, y = 106.0], MoveTo [x = 21.0, y = 71.0], LineTo [x = 29.0, y = 71.0], MoveTo [x = 21.0, y = 35.0], LineTo [x = 29.0, y = 35.0], MoveTo [x = 21.0, y = 0.0], LineTo [x = 29.0, y = 0.0]], fill = null, fillRule = NON_ZERO, stroke = 0xc3c3c3ff, strokeWidth = 1.0]
Path [elements = [MoveTo [x = 24.0, y = 312.0], LineTo [x = 28.0, y = 312.0], MoveTo [x = 24.0, y = 305.0], LineTo [x = 28.0, y = 305.0], MoveTo [x = 24.0, y = 298.0], LineTo [x = 28.0, y = 298.0], MoveTo [x = 24.0, y = 291.0], LineTo [x = 28.0, y = 291.0], MoveTo [x = 24.0, y = 276.0], LineTo [x = 28.0, y = 276.0], MoveTo [x = 24.0, y = 269.0], LineTo [x = 28.0, y = 269.0], MoveTo [x = 24.0, y = 262.0], LineTo [ x = 28.0, y = 262.0], MoveTo [x = 24.0, y = 255.0], LineTo [x = 28.0, y = 255.0], MoveTo [x = 24.0, y = 248.0], LineTo [x = 28.0, y = 248.0], MoveTo [x = 24.0, y = 241.0], LineTo [x = 28.0, y = 241.0], MoveTo [x = 24.0, y = 234.0], LineTo [x = 28.0, y = 234.0], MoveTo [x = 24.0, y = 227.0], LineTo [x = 28.0, y = 227.0], MoveTo [x = 24.0, y = 220.0], LineTo [x = 28.0, y = 220.0], MoveTo [x = 24.0, y = 206.0 ], LineTo [x = 28.0, y = 206.0], MoveTo [x = 24.0, y = 198.0], LineTo [x = 28.0, y = 198.0], MoveTo [x = 24.0, y = 191.0], LineTo [x = 28.0, y = 191.0], MoveTo [x = 24.0, y = 184.0], LineTo [x = 28.0, y = 184.0], MoveTo [x = 24.0, y = 170.0], LineTo [x = 28.0, y = 170.0] , MoveTo [x = 24.0, y = 163.0], LineTo [x = 28.0, y = 163.0], MoveTo [x = 24.0, y = 156.0], LineTo [x = 2 8.0, y = 156.0], MoveTo [x = 24.0, y = 149.0], LineTo [x = 28.0, y = 149.0], MoveTo [x = 24.0, y = 135.0], LineTo [x = 28.0, y = 135.0] , MoveTo [x = 24.0, y = 128.0], LineTo [x = 28.0, y = 128.0], MoveTo [x = 24.0, y = 121.0], LineTo [x = 28.0, y = 121.0], MoveTo [x = 24.0 , y = 113.0], LineTo [x = 28.0, y = 113.0], MoveTo [x = 24.0, y = 99.0], LineTo [x = 28.0, y = 99.0], MoveTo [x = 24.0, y = 92.0], LineTo [x = 28.0, y = 92.0], MoveTo [x = 24.0, y = 85.0], LineTo [x = 28.0, y = 85.0], MoveTo [x = 24.0, y = 78.0], LineTo [x = 28.0, y = 78.0], MoveTo [x = 24.0, y = 64.0], LineTo [x = 28.0, y = 64.0], MoveTo [x = 24.0, y = 57.0], LineTo [x = 28.0, y = 57.0], MoveTo [x = 24.0, y = 50.0], LineTo [x = 28.0, y = 50.0], MoveTo [x = 24.0, y = 43.0], LineTo [x = 28.0, y = 43.0], MoveTo [x = 24.0, y = 28.0], LineTo [x = 28.0, y = 28.0], MoveTo [x = 24.0, y = 21.0], LineTo [x = 28.0, y = 21.0], MoveTo [x = 24.0, y = 14.0], LineTo [ x = 28.0, y = 14.0], MoveTo [x = 24.0, y = 7.0], LineTo [x = 28.0, y = 7.0], MoveTo [x = 24.0, y = 0.0], LineTo [x = 28.0, y = 0.0]], fill = null, fillRule = NON_ZERO, stroke = 0xc3c3c3ff, strokeWidth = 1.0]
Text [text = "0.0", x = 0.0, y = 0.0, alignment = LEFT, origin = BASELINE, boundsType = LOGICAL, font = Font [name = System Regular, family = System, style = Regular, size = 10.800000190734863 ], fontSmoothingType = GRAY, fill = 0x585858ff]
Text [text = "0.5", x = 0.0, y = 0.0, alignment = LEFT, origin = BASELINE, boundsType = LOGICAL, font = Font [name = System Regular, family = System, style = Regular, size = 10.800000190734863 ], fontSmoothingType = GRAY, fill = 0x585858ff]
Text [text = "1.0", x = 0.0, y = 0.0, alignment = LEFT, origin = BASELINE, boundsType = LOGICAL, font = Font [name = System Regular, family = System, style = Regular, size = 10.800000190734863 ], fontSmoothingType = GRAY, fill = 0x585858ff]
Text [text = "1.5", x = 0.0, y = 0.0, alignment = LEFT, origin = BASELINE, boundsType = LOGICAL, font = Font [name = System Regular, family = System, style = Regular, size = 10.800000190734863 ], fontSmoothingType = GRAY, fill = 0x585858ff]
Text [text = "2.0", x = 0.0, y = 0.0, alignment = LEFT, origin = BASELINE, boundsType = LOGICAL, font = Font [name = System Regular, family = System, style = Regular, size = 10.800000190734863 ], fontSmoothingType = GRAY, fill = 0x585858ff]
Text [text = "2.5", x = 0.0, y = 0.0, alignment = LEFT, origin = BASELINE, boundsType = LOGICAL, font = Font [name = System Regular, family = System, style = Regular, size = 10.800000190734863 ], fontSmoothingType = GRAY, fill = 0x585858ff]
Text [text = "3.0", x = 0.0, y = 0.0, alignment = LEFT, origin = BASELINE, boundsType = LOGICAL, font = Font [name = System Regular, family = System, style = Regular, size = 10.800000190734863 ], fontSmoothingType = GRAY, fill = 0x585858ff]
Text [text = "3,5", x = 0.0, y = 0.0, alignment = LEFT, origin = BASELINE, boundsType = LOGICAL, font = Font [name = System Regular, family = System, style = Regular, size = 10.800000190734863 ], fontSmoothingType = GRAY, fill = 0x585858ff]
Text [text = "4.0", x = 0.0, y = 0.0, alignment = LEFT, origin = BASELINE, boundsType = LOGICAL, font = Font [name = System Regular, family = System, style = Regular, size = 10.800000190734863 ], fontSmoothingType = GRAY, fill = 0x585858ff]
Text [text = "4,5", x = 0.0, y = 0.0, alignment = LEFT, origin = BASELINE, boundsType = LOGICAL, font = Font [name = System Regular, family = System, style = Regular, size = 10.800000190734863 ], fontSmoothingType = GRAY, fill = 0x585858ff]
Legend @ 74020b4b [styleClass = chart-legend]
Label @ 1d725e97 [styleClass = label chart-legend-item] 'Temp1'
Region @ 15f4872 [styleClass = chart-legend-item-symbol chart-line-symbol series0 default-color0]
Text [text = "Temp1", x = 0.0, y = 0.0, alignment = LEFT, origin = BASELINE, boundsType = LOGICAL_VERTICAL_CENTER, font = Font [name = System Regular, family = System, style = Regular, size = 13.0], fontSmoothingType = LCD, fill = 0x333333ff]
And after analyzing the result, you can easily understand what components LineChart consists of:
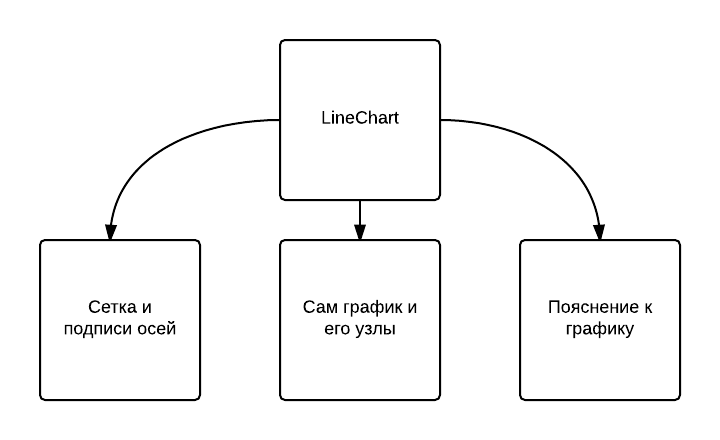
Since my goal was to replace all the nodes of the graph with a picture and create pop-up messages over each of them, I need the part where the nodes are located.
Replacing the circles in the pictures
In normal JavaFX, the nodes of the graph are represented by circles with an empty middle. To find out how they are created, I had to climb a little over the LineChart code (thanks to Oracle for the open raws) and got this code snippet:
private Node createSymbol(Series<X, Y> series, int seriesIndex, final Data<X,Y> item, int itemIndex) { Node symbol = item.getNode(); // check if symbol has already been created if (symbol == null && getCreateSymbols()) { symbol = new StackPane(); item.setNode(symbol); } // set symbol styles if (symbol != null) symbol.getStyleClass().addAll("chart-line-symbol", "series" + seriesIndex, "data" + itemIndex, series.defaultColorStyleClass); return symbol; } It turns out, the node is a regular panel, which is configured via CSS. Find the CSS code that is used to configure the site (located in / com/sun/javafx/scene/control/skin/caspian/caspian.css):
.chart-line-symbol { -fx-background-color: #f9d900, white; -fx-background-insets: 0, 2; -fx-background-radius: 5px; -fx-padding: 5px; } That is, for a change, it is enough to remake the chart-line-symbol class.
Create this CSS file:
.chart-line-symbol { -fx-background-image: url(% %); } And add this file to the chart:
VBox vBox = new VBox(); LineChart chart = new LineChart(new NumberAxis(), new NumberAxis()); chart.getStylesheets().add(Main.class.getResource(" css ").toExternalForm()); chart.getData().add(new XYChart.Series<>("Temp1", FXCollections.observableArrayList(new XYChart.Data<Object, Object>(1, 1), new XYChart.Data<Object, Object>(2, 2), new XYChart.Data<Object, Object>(3, 4)))); vBox.getChildren().add(chart); primaryStage.setScene(new Scene(vBox)); primaryStage.show(); ((XYChart.Series) chart.getData().get(0)).getData().addAll(new XYChart.Data<>(5, 5)); The result can be seen in the first picture.
Tooltips in nodes
This feature is somewhat more difficult to add, since it will not work with CSS.
Let's return to the part of the code where the symbol was created in LineChart:
private Node createSymbol(Series<X, Y> series, int seriesIndex, final Data<X,Y> item, int itemIndex) { Node symbol = item.getNode(); // check if symbol has already been created if (symbol == null && getCreateSymbols()) { symbol = new StackPane(); item.setNode(symbol); } // set symbol styles if (symbol != null) symbol.getStyleClass().addAll("chart-line-symbol", "series" + seriesIndex, "data" + itemIndex, series.defaultColorStyleClass); return symbol; } As you can see, the symbol is then stored in the Data <X, Y> object, which specifies the point of the graph.
That is, you can simply go through all the points in the Series and install tooltips for everyone:
ObservableList<XYChart.Data> dataList = ((XYChart.Series) chart.getData().get(0)).getData(); dataList.forEach(data->{ Node node = data.getNode(); Tooltip tooltip = new Tooltip('('+data.getXValue().toString()+';'+data.getYValue().toString()+')'); Tooltip.install(node, tooltip); }); After launch, hover over the graph node and see the result.
Conclusion
Hopefully, I was able to show how to customize components in JavaFX and modify them. Of course, the possibilities that I have presented are not limited. In particular, you can make a modification LineChart ( as I did ), in which you can dynamically change colors, and which will add tooltips. You can change the appearance of the background, grids, axes and captions. In general, adjust as you please. The main thing is to remember that static settings need to be put into CSS, and the whole dynamic, unfortunately, into code.
Source: https://habr.com/ru/post/242009/
All Articles