On Yandex.Maps you can now create heat maps
Yandex.Maps have long been asked to make a tool for data visualization using heat maps - and we finally made it. If you are one of those who really need it, you can go straight to reading the github documentation. If you still don’t know if you need it, you can spend a little time reading the article about what heat maps are, how they are generated on the client, and how we combined the generation of the heat map with a geographic map.
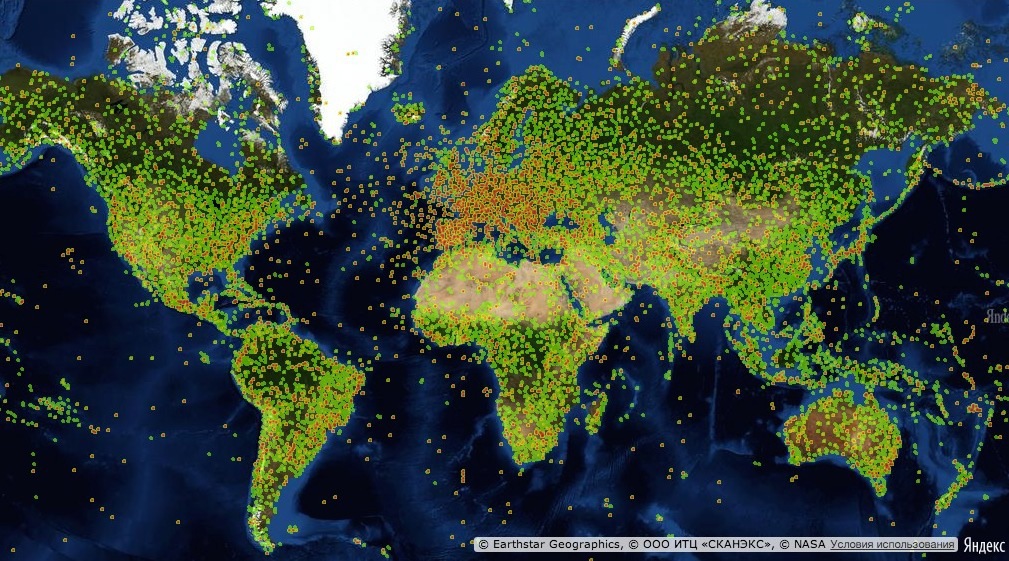
Display geographic points from wikipedia
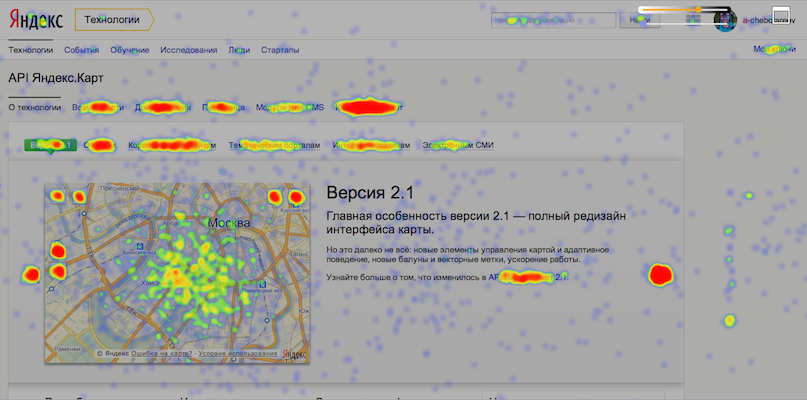
So, first things first. To begin with, let's define what heat maps are and what are they eating with? As thecaptain of Wikipedia tells me, heat maps (they are heat maps, they are heatmap) are a graphical representation of the data, where additional variables are displayed using color. This type of display is very convenient. For example, they are often used by web analytics to see the most active parts of the site pages.
These click cards allow you to build Yandex.Metrica :
')
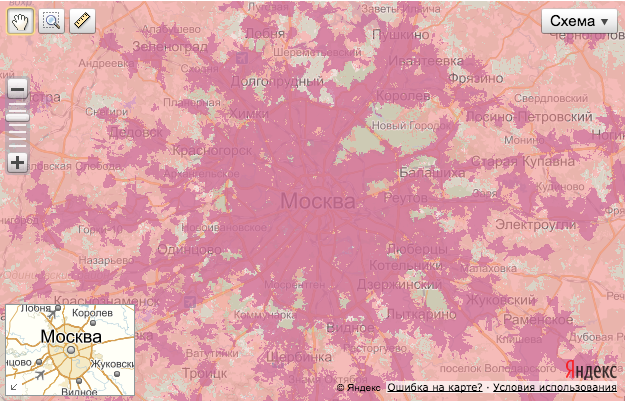
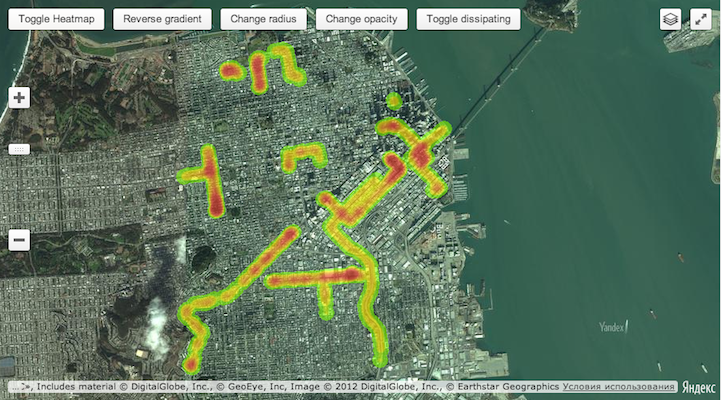
Sometimes it is useful to apply some quantitative indicators on a geographic map, as in the case of displaying mobile / internet coverage areas of MTS:
Such cases are designed to solve the heat map module that we created. Before I proceed to the description of the process of creating a module, I would like to say a few more words about what our modular system is and how you can use it.
In version 2.1, we opened the users access to our modular system , which is written on the basis of YModules , developed by our colleague dfilatov . This modular system has many different nice features, such as asynchronous resolve dependencies, module redefinition, etc. It was already described in some detail by the author on Habré , so if you're interested, you can read.
The opening of the modular system brought us a nice bonus - the opportunity for external developers to create their own modules. It seems to be nothing archival, but thanks to this our users can now:
As an example of the first, we created heat maps.
Since writing my heat maps was not an end in itself for this undertaking (the main task was to make ready-made solutions for the Yandex.Maps API) before starting to write code and think about the work algorithm, naturally, I climbed on github to look for some ready-made solutions. It was quite expected that there were a little more than enough different realizations of heatmaps (almost two and a half hundreds).
Having a little studied the source codes of different projects, I focused my attention on the library simpleheat of Mourner authorship. She had two key benefits:
In the end, of course, I had to rewrite a significant part of it, but still, it seems to me that this was the best choice. All other solutions were much more cumbersome, but did not provide any special buns.
After talking with colleagues, I realized that everyone had seen heat maps, everyone knows why and what it is. But almost no one knew how they were drawn. That is why I will try to describe this part in more detail.
The Yandex.Maps API provides the ability to display its own substrate for the map, this is implemented using a special Layer class. He needs to pass a function to the input, which will return the url to load the tile by the tile number and zoom level. Whoever is not familiar with tiles and tile graphics can read a little about them in Wikipedia and in our documentation .
Writing the function of the url generator to get the tiles is actually the whole task of creating a heat map for our API.
When we decided on what was needed from us, we began to think about how to do it. There are two fundamentally different methods for defining a heat map:
The first method is more universal and includes the second, but at the same time it is very inconvenient to use in practice (how often do you provide data as functions of several variables?), And it looks strange and incomprehensible to untrained users. Therefore, without further ado, we have decided that we will use the second method.
For the convenience of users, we decided that we would support all the most popular input formats used in the API (Number [] [], IGeoObject, IGeoObject [], ICollection, ICollection [], GeoQueryResult, JSON), because of this we I had to impose a not very pleasant restriction on the program interface of the heatmaps. The heatmap can be set only the data set and you can not remove or add points from this set. Thus, for working with data, we provide only two methods: getData () and setData ().
After we receive the data, we bring them into a single format and translate them into global pixel coordinates . It is already relatively easy to work with such data, since for each tile it is easy to say which points fall into it and which do not.
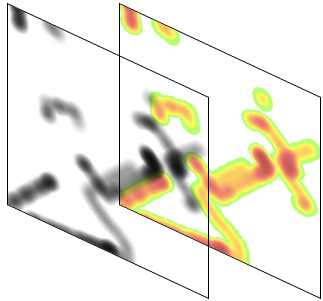
Once the data has been prepared, you can begin to draw them. How to draw a question, it seems, is not worth it (Canvas is our everything, especially since it has a great getDataURL functionality, which is especially necessary in our case, since it is the url of the tile that we need to provide the API).
 To draw each individual point, we will use a brush (picture on the left), which is a black and white gradient and drawn on the canvas is quite simple:
The weight of the point will determine the transparency with which the brush will “draw” a point on the tile. After we draw all the points of the tile, we will have such a negative of our heat map tile.
After that, the tile will be colored by setting the color of each pixel from the gradient (options.gradient) in accordance with the value of its transparency. The transparency of each pixel of the tile will be equal to the overall transparency of the heat map (options.opacity).
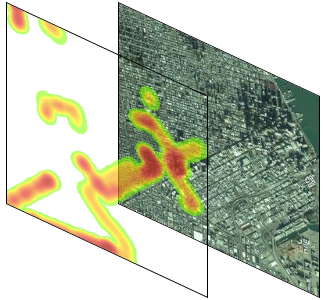
It seems like everything, but no. There will always be some exceptional situations that need to be further processed. And in our case, the possibility of setting an unlimited weight on top of a point can lead to the fact that one point “extinguishes” all the others. So, for example, if you add several hundred points with a weight of one and one point with a weight of one thousand to the map, only the last one will be visible (left figure).

Therefore, in order to avoid such situations, we have introduced the additional option intensityOfMidpoint - this is the parameter that determines what transparency (in fact, determines what color) the median by weight of a point should have. Thus, we will be able to smooth out the extremes for ordinary users (figure on the right), and the rest will be able to adjust the option to the desired values.
Detailed instructions for loading the module are in the documentation on github'e . After that, for use, simply connect it through a modular system.
We also prepared a small demo that will allow you to visually see the work of most of the options.
You can write all your questions / wishes / indignations or thanks to issues on github , in our club or directly to me at alt-j@yandex-team.ru .
As you probably understood, writing your modules for the Yandex.Maps API is fun and simple. Try, experiment, share with us your results. Here is a list of important links:
Display geographic points from wikipedia
What are heat maps and why are they needed?
So, first things first. To begin with, let's define what heat maps are and what are they eating with? As the
These click cards allow you to build Yandex.Metrica :
')
Sometimes it is useful to apply some quantitative indicators on a geographic map, as in the case of displaying mobile / internet coverage areas of MTS:
Such cases are designed to solve the heat map module that we created. Before I proceed to the description of the process of creating a module, I would like to say a few more words about what our modular system is and how you can use it.
Modular system
In version 2.1, we opened the users access to our modular system , which is written on the basis of YModules , developed by our colleague dfilatov . This modular system has many different nice features, such as asynchronous resolve dependencies, module redefinition, etc. It was already described in some detail by the author on Habré , so if you're interested, you can read.
The opening of the modular system brought us a nice bonus - the opportunity for external developers to create their own modules. It seems to be nothing archival, but thanks to this our users can now:
- independently write new functionality for the Yandex.Maps API and share it in a convenient way with other developers;
- use our modular system as the main, if the application is entirely tied to the maps.
As an example of the first, we created heat maps.
Since writing my heat maps was not an end in itself for this undertaking (the main task was to make ready-made solutions for the Yandex.Maps API) before starting to write code and think about the work algorithm, naturally, I climbed on github to look for some ready-made solutions. It was quite expected that there were a little more than enough different realizations of heatmaps (almost two and a half hundreds).
Having a little studied the source codes of different projects, I focused my attention on the library simpleheat of Mourner authorship. She had two key benefits:
- the code of the entire project took about a hundred lines;
- the heat map kept 10k points well without straining when drawing (with more data, it is somehow meaningless to test, since it is extremely unwise to give such amounts of data only for drawing a picture to a client).
In the end, of course, I had to rewrite a significant part of it, but still, it seems to me that this was the best choice. All other solutions were much more cumbersome, but did not provide any special buns.
Heatmap drawing algorithm
After talking with colleagues, I realized that everyone had seen heat maps, everyone knows why and what it is. But almost no one knew how they were drawn. That is why I will try to describe this part in more detail.
The Yandex.Maps API provides the ability to display its own substrate for the map, this is implemented using a special Layer class. He needs to pass a function to the input, which will return the url to load the tile by the tile number and zoom level. Whoever is not familiar with tiles and tile graphics can read a little about them in Wikipedia and in our documentation .
Writing the function of the url generator to get the tiles is actually the whole task of creating a heat map for our API.
When we decided on what was needed from us, we began to think about how to do it. There are two fundamentally different methods for defining a heat map:
- using a two-dimensional scalar (flat) field (in fact, it is a function of two variables);
- using a set of simple or weighted points (each point is assigned some positive number — its weight).
The first method is more universal and includes the second, but at the same time it is very inconvenient to use in practice (how often do you provide data as functions of several variables?), And it looks strange and incomprehensible to untrained users. Therefore, without further ado, we have decided that we will use the second method.
For the convenience of users, we decided that we would support all the most popular input formats used in the API (Number [] [], IGeoObject, IGeoObject [], ICollection, ICollection [], GeoQueryResult, JSON), because of this we I had to impose a not very pleasant restriction on the program interface of the heatmaps. The heatmap can be set only the data set and you can not remove or add points from this set. Thus, for working with data, we provide only two methods: getData () and setData ().
After we receive the data, we bring them into a single format and translate them into global pixel coordinates . It is already relatively easy to work with such data, since for each tile it is easy to say which points fall into it and which do not.
Once the data has been prepared, you can begin to draw them. How to draw a question, it seems, is not worth it (Canvas is our everything, especially since it has a great getDataURL functionality, which is especially necessary in our case, since it is the url of the tile that we need to provide the API).
To draw each individual point, we will use a brush (picture on the left), which is a black and white gradient and drawn on the canvas is quite simple:var brush = document.createElement('canvas'), context = brush.getContext('2d'), radius = 20, gradient = context.createRadialGradient(radius, radius, 0, radius, radius, radius); gradient.addColorStop(0, 'rgba(0,0,0,1)'); gradient.addColorStop(1, 'rgba(0,0,0,0)'); context.fillStyle = gradient; context.fillRect(0, 0, 2 * radius, 2 * radius); The weight of the point will determine the transparency with which the brush will “draw” a point on the tile. After we draw all the points of the tile, we will have such a negative of our heat map tile.
var canvas = document.createElement('canvas'), context = canvas.getContext('2d'), maxOfWeights = 1, radius = 20; context.clearRect(0, 0, 256, 256); for (var i = 0, length = points.length; i < length; i++) { context.globalAlpha = Math.min(points[i].weight / maxOfWeights, 1); context.drawImage( brush, points[i].coords[0] - radius, points[i].coords[1] - radius ); } After that, the tile will be colored by setting the color of each pixel from the gradient (options.gradient) in accordance with the value of its transparency. The transparency of each pixel of the tile will be equal to the overall transparency of the heat map (options.opacity).
// . var canvas = document.createElement('canvas'), context = canvas.getContext('2d'), gradient = context.createLinearGradient(0, 0, 0, 256), gradientOption = { 0.1: 'rgba(128, 255, 0, 0.7)', 0.2: 'rgba(255, 255, 0, 0.8)', 0.7: 'rgba(234, 72, 58, 0.9)', 1.0: 'rgba(162, 36, 25, 1)' }; canvas.width = 1; canvas.height = 256; for (var i in gradientOption) { if (gradientOption.hasOwnProperty(i)) { gradient.addColorStop(i, gradientOption[i]); } } context.fillStyle = gradient; context.fillRect(0, 0, 1, 256); // . var gradientData = context.getImageData(0, 0, 1, 256).data; var opacity = 0.5 for (var i = 3, length = pixels.length, j; i < length; i += 4) { if (pixels[i]) { j = 4 * pixels[i]; pixels[i - 3] = gradientData[j]; pixels[i - 2] = gradientData[j + 1]; pixels[i - 1] = gradientData[j + 2]; pixels[i] = opacity * (gradientData[j + 3] || 255); } } It seems like everything, but no. There will always be some exceptional situations that need to be further processed. And in our case, the possibility of setting an unlimited weight on top of a point can lead to the fact that one point “extinguishes” all the others. So, for example, if you add several hundred points with a weight of one and one point with a weight of one thousand to the map, only the last one will be visible (left figure).
Therefore, in order to avoid such situations, we have introduced the additional option intensityOfMidpoint - this is the parameter that determines what transparency (in fact, determines what color) the median by weight of a point should have. Thus, we will be able to smooth out the extremes for ordinary users (figure on the right), and the rest will be able to adjust the option to the desired values.
How to use it
Detailed instructions for loading the module are in the documentation on github'e . After that, for use, simply connect it through a modular system.
ymaps.modules.require(['Heatmap'], function (Heatmap) { var data = [[37.782551, -122.445368], [37.782745, -122.444586]], heatmap = new Heatmap(data); heatmap.setMap(myMap); }); We also prepared a small demo that will allow you to visually see the work of most of the options.
You can write all your questions / wishes / indignations or thanks to issues on github , in our club or directly to me at alt-j@yandex-team.ru .
Instead of conclusion
As you probably understood, writing your modules for the Yandex.Maps API is fun and simple. Try, experiment, share with us your results. Here is a list of important links:
Source: https://habr.com/ru/post/241361/
All Articles