Creating custom OIDs for monitoring systems on Caché using SNMP
Good day (evenings, nights, mornings - underline as necessary) to all habrogens!
This post focuses on monitoring the Caché instance using SNMP . Surely, many Caché users are already using this to some extent. Monitoring via SNMP has been supported in a standard Caché installation for a long time, but not all parameters of interest are available from the “box”. For example, I would like to see the monitoring of the number of CSP sessions, more detailed information on the use of a license, private KPIs of the system being used, etc.
In this article, you will learn how to add your own settings for monitoring Caché using SNMP.
What we already have
Caché can be monitored using SNMP. A list of what is already supported can be seen in the files <Install_dir> / SNMP directory. Usually there are 2 files: ISC-CACHE.mib and ISC-ENSEMBLE.mib . We are interested in the file for Caché - ISC-CACHE.mib . For example, we are interested in what we can get regarding licenses and sessions. The table shows the corresponding OIDs, taking into account that the hierarchy is taken from the root for Intersystems - 1.3.6.1.4.1.16563
Many important indicators are missing in the delivery, for example, the number of CSP sessions, license information is incomplete and, of course, there is no monitoring of application-specific indicators.
An example of what we would like to know:
Add a couple of parameters to evaluate the performance. The parameters themselves are in the delivery, but we want to know their increment per minute, for example:
How to add "your" parameters
You can rely on the document " Monitoring Caché using SNMP ".
Our test instance (TEST) is version Caché 2013.1.3 . The operating system is Linux CentOS release 6.5 (Final) . Installing Cache on Linux OS is described in habr . The native documentation from InterSystems will also be useful.
Here is a brief work plan:
And now we carry out the plan point by point.
1. Create a class to collect metrics
The metrics collection class is inherited from % Monitor.Adaptor . In the studio go to the area% SYS. Export the Monitor package. The package contains a private class Sample, which is not visible from the Studio, but is available when exporting to xml.
Suppose our work area is a TEST area. Go to her. Import the class Monitor.Sample here. We create a class in which we describe the implementation of withdrawing the 6 metrics indicated above in the section “What we already have”.
We check that the data we need is unloaded by calling the GetSample () method:
2. Register and activate a new class in Caché with ^% SYSMONMGR
Open the terminal and go to the TEST area:
3. Create a custom MIB
A custom MIB is created using the methods of the MonitorTools.SNMP class. For example, PEN (Private Enterprise Number) will take the dummy, 99990, then the PEN must be registered with IANA . View already registered rooms here . For example, PEN InterSystems has the number 16563.
16563
InterSystems
Robert Davis
rdavis & intersystems.com
To create a MIB file, we will use the MonitorTools.SNMP class, in particular, the CreateMIB () method. This method takes 10 arguments as input:
Actually, the creation of a MIB file:
A new MIB ISC-TEST.mib has appeared in the <Install_dir> / mgr / TEST directory.
4. Start the monitoring service with the connected Caché subagent.
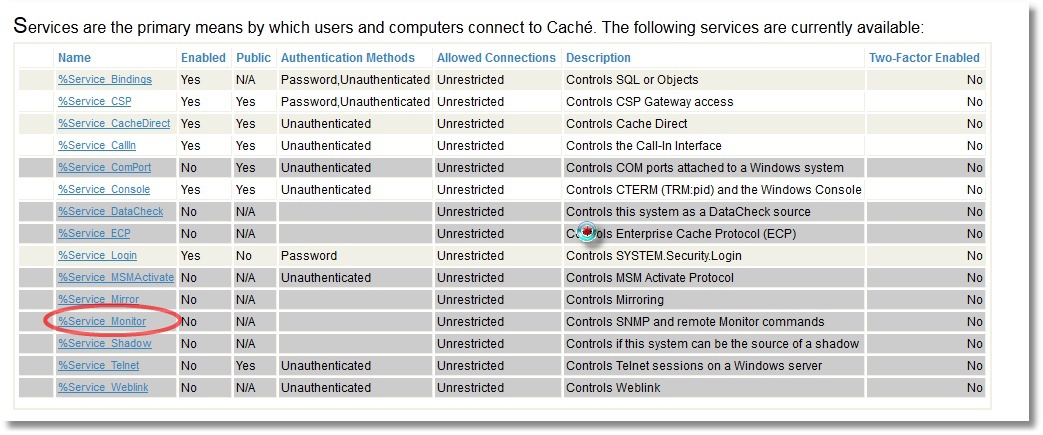
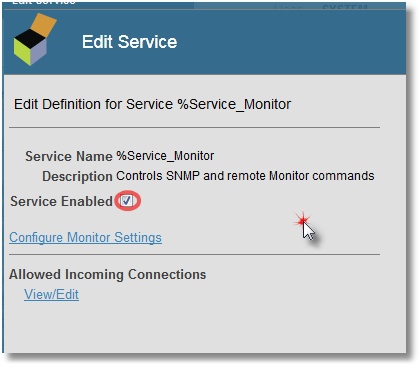
Open the System Administration Control Panel -> Security -> Services ->% Service_Monitor (click) -> Service Enabled (check) .
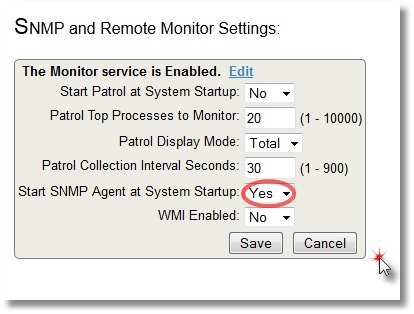
We also indicate that we want to start the SNMP subagent when Caché starts (click Configure Monitor Settings):
On Linux CentOS, we use the net-snmp package for SNMP monitoring. We install it, configure it on the use of subagents, and that the master agent and subagents will communicate via the standard port 705.
[root @ server ~] # grep -i agentx / etc / services
agentx 705 / tcp # AgentX
agentx 705 / udp # AgentX
A small article on the snmpd.conf configuration file in addition to the mana can be viewed on cyberciti . Here is our final setting:
Restarting Linux snmpd and snmptrapd demons. We start the ^ SNMP service to get started with the Caché SNMP subagent:
% Sys> d start ^ SNMP
5. Check that our newly created user OIDs are available .
This can be done using snmpwalk - we will show an OID that displays the number of CSP sessions:
[root @ server mgr] # snmpwalk -On -v 2c -c public localhost 1.3.6.1.4.1.99990
.1.3.6.1.4.1.99990.42.1.1.1.1.4.84.69.86.84 = INTEGER: 448035
.1.3.6.1.4.1.99990.42.1.1.1.2.4.84.69.88.8 = INTEGER: 64190
.1.3.6.1.4.1.99990.42.1.1.1.3.4.84.69.83.84 = STRING: "2014-10-11"
.1.3.6.1.4.1.99990.42.1.1.1.4.4.84.69.86.84 = INTEGER: 200
.1.3.6.1.4.1.99990.42.1.1.1.4.4.84.69.83.84 = INTEGER: 93
.1.3.6.1.4.1.99990.42.1.1.1.6.4.84.69.83.84 = INTEGER: 1
The file ISC-TEST.mib indicates the sequence of our OIDs:
FictMetricsR :: =
SEQUENCE {
fictExecutedSpeed Integer32,
fictGloRefSpeed Integer32,
fictKeyExpirationDate DisplayString,
fictKeyLicenseUnits Integer32,
fictRoutineLoadSpeed Integer32,
fictSessions Integer32
}
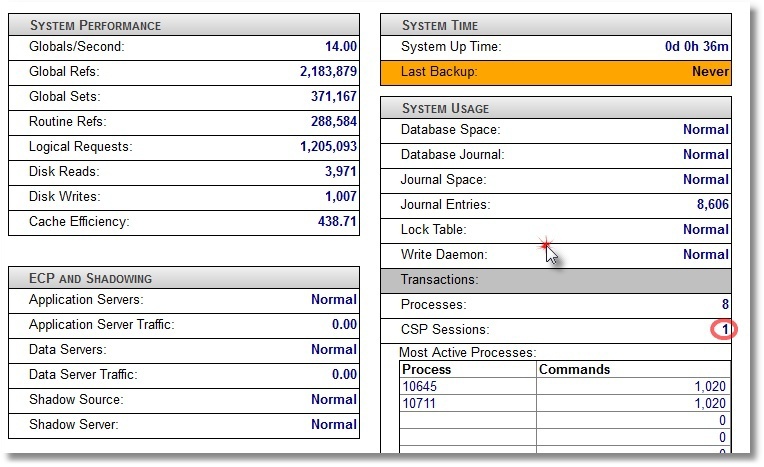
Accordingly, for example, the number of sessions is the last OID 1.3.6.1.4.1.99990.42.1.1.1.6. You can compare with the number of sessions shown by SMP dashboard:
6. Add our OIDs to a third-party monitoring system.
For example, take Zabbix . Zabbix documentation can be found here . By installing and configuring Zabbix specifically on CentOS, you can see it here . Zabbix was chosen as a system that allows not only to draw graphics, but also to monitor Plain Text (in our case, this is the license expiration date and license power by users). After adding our 6 metrics to the Items of our local host and creating 4 graphs and 2 PlainText parameters (like screen elements), we see the following picture (an example of a small “live” system is shown):
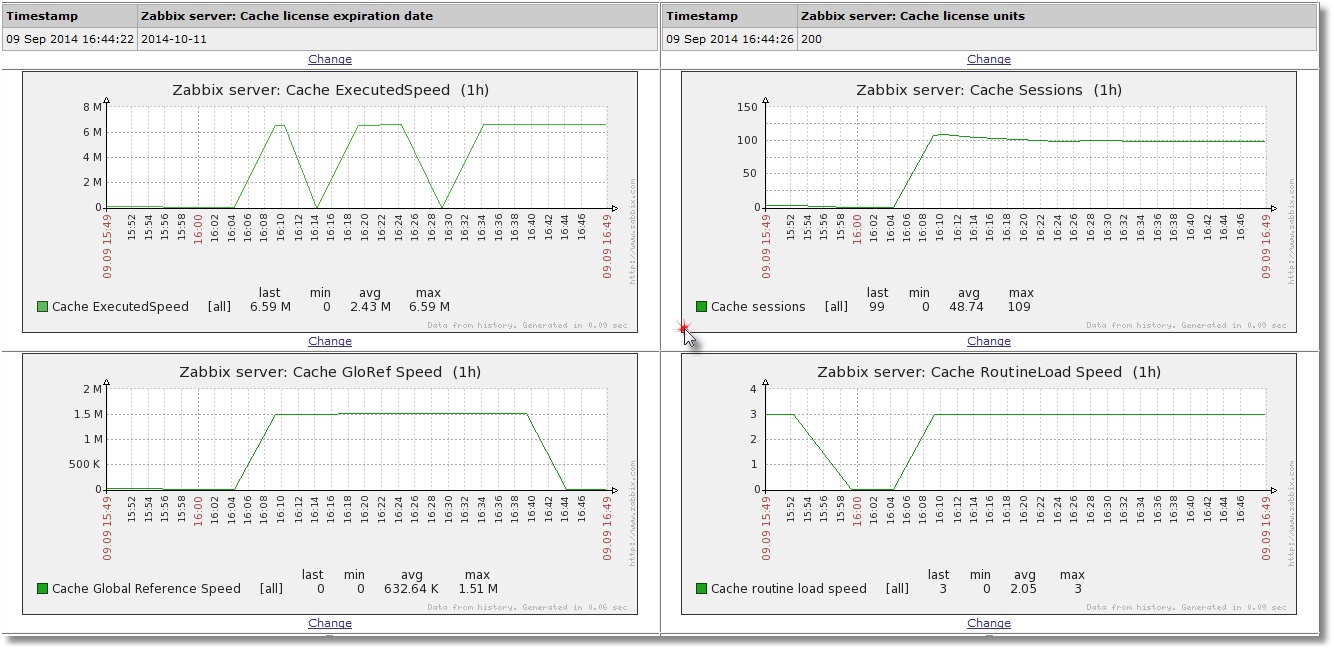
At the top - information about when the license ends, and how many license slots we have. The graphs speak for themselves.
7. Add the launch of the system monitor in our TEST area at system startup
There is a good document on the use of custom routines that are triggered when Caché starts and stops. They are called respectively% ZSTART and% ZSTOP.
What we are interested in in all of this is to raise the system monitor (^% SYSMONMGR) in the TEST user area at the start. By default, this monitor starts only in the% SYS area. Accordingly, we will consider only the program ^% ZSTART. Source% ZSTART.mac (create and save it in the% SYS area).
Restart (if possible) Caché to make sure that the collection of SNMP statistics after the restart of Caché continues.
That's all. Perhaps someone will have comments on the choice of monitoring parameters or code, but the task was to show the possibility of such monitoring in principle, and you can always add the necessary parameter or refactor the code in the future.
Thanks for attention!
This post focuses on monitoring the Caché instance using SNMP . Surely, many Caché users are already using this to some extent. Monitoring via SNMP has been supported in a standard Caché installation for a long time, but not all parameters of interest are available from the “box”. For example, I would like to see the monitoring of the number of CSP sessions, more detailed information on the use of a license, private KPIs of the system being used, etc.
In this article, you will learn how to add your own settings for monitoring Caché using SNMP.
What we already have
Caché can be monitored using SNMP. A list of what is already supported can be seen in the files <Install_dir> / SNMP directory. Usually there are 2 files: ISC-CACHE.mib and ISC-ENSEMBLE.mib . We are interested in the file for Caché - ISC-CACHE.mib . For example, we are interested in what we can get regarding licenses and sessions. The table shows the corresponding OIDs, taking into account that the hierarchy is taken from the root for Intersystems - 1.3.6.1.4.1.16563
| OID | Title | Description | Data type |
|---|---|---|---|
| .1.1.1.1.10 | cacheSysLicenseUsed | The current number of licenses used on this Caché instance | INTEGER |
| .1.1.1.1.11 | cacheSysLicenseHigh | The high-water mark for licenses used on this Caché instance | INTEGER |
| .1.2.16 | cacheLicenseExceed | A license for a license has exceeded the license available or allowed | Trap message |
| .1.1.1.1.6 | cacheSysCurUser | Current number of users on this caché instance | INTEGER |
Many important indicators are missing in the delivery, for example, the number of CSP sessions, license information is incomplete and, of course, there is no monitoring of application-specific indicators.
An example of what we would like to know:
- How many CSP users do we have?
- Limiting our license to users;
- When the license key is over.
Add a couple of parameters to evaluate the performance. The parameters themselves are in the delivery, but we want to know their increment per minute, for example:
- The increase in "global" links per minute;
- The number of commands executed per minute;
- The number of call routines per minute.
How to add "your" parameters
You can rely on the document " Monitoring Caché using SNMP ".
Our test instance (TEST) is version Caché 2013.1.3 . The operating system is Linux CentOS release 6.5 (Final) . Installing Cache on Linux OS is described in habr . The native documentation from InterSystems will also be useful.
Here is a brief work plan:
- Create a class to collect metrics;
- Register and activate a new class in Caché with ^% SYSMONMGR;
- Create a custom MIB using the methods of the class MonitorTools.SNMP. To begin with, PEN (Private Enterprise Number) will take the fictitious 99990, then you need to register with IANA. This procedure is free, takes a week or two and is accompanied by a short correspondence of the form “why did you need your PEN”;
- We start the monitoring service with the connected Caché subagent;
- Using snmpwalk, we check that our newly created custom OIDs are available to us;
- We add our OIDs to a third-party monitoring system. For example, take Zabbix . Zabbix documentation can be found here . By installing and configuring Zabbix specifically on CentOS, you can see it here . Make sure the monitoring works;
- Add the launch of the system monitor in our TEST area at system startup.
And now we carry out the plan point by point.
1. Create a class to collect metrics
The metrics collection class is inherited from % Monitor.Adaptor . In the studio go to the area% SYS. Export the Monitor package. The package contains a private class Sample, which is not visible from the Studio, but is available when exporting to xml.
Suppose our work area is a TEST area. Go to her. Import the class Monitor.Sample here. We create a class in which we describe the implementation of withdrawing the 6 metrics indicated above in the section “What we already have”.
Class metrics.snmp.Metrics
Class metrics.snmp.Metrics Extends% Monitor.Adaptor
{
/// Give the application a name. This allows you to group different
/// classes together under the same SNMP MIB.
/// The default is the package name.
Parameter APPLICATION = "Monitoring" ;
/// CSP sessions count
Property Sessions As% Monitor.Integer ;
/// License user limit
Property KeyLicenseUnits As% Monitor.Integer ;
/// License key expiration date
Property KeyExpirationDate As% Monitor.String ;
/// Global references speed
Property GloRefSpeed As% Monitor.Integer ;
/// Number of commands executed
Property ExecutedSpeed As% Monitor.Integer ;
/// Number of routine loads / save
Property RoutineLoadSpeed As% Monitor.Integer ;
/// The method is REQUIRED. It is where the Application Monitor
/// calls to collect data samples
/// ^ SNMP server process when requested.
Method GetSample () As% Status
{
set .. Sessions = .. getSessions ()
set .. KeyLicenseUnits = .. getKeyLicenseUnits ()
set .. KeyExpirationDate = .. getKeyExpirationDate ()
set perfList = .. getPerformance ()
set .. GloRefSpeed = $ listget ( perfList , 1)
set .. ExecutedSpeed = $ listget ( perfList , 2)
set .. RoutineLoadSpeed = $ listget ( perfList , 3)
quit $$$ OK
}
/// Get CSP sessions count
Method getSessions () As% Integer
{
// q $ system.License.CSPUsers () // This method will only work if we dont 'use WebAddon
// This will work even if we use WebAddon
set csp = ""
try {
set cn = $ NAMESPACE
znspace "% sys "
set db = ## class ( SYS.Stats.Dashboard ). Sample ()
set csp = db . CSPSessions
znspace cn
} catch e {
set csp = "0"
}
quit csp
}
/// Get license user's power
Method getKeyLicenseUnits () As% Integer
{
quit $ system .License . KeyLicenseUnits ()
}
/// Get license expiration date in human-readable format
Method getKeyExpirationDate () As% String
{
quit $ zdate ( $ system .License . KeyExpirationDate (), 3)
}
/// Get performance metrics (gloref, rourines etc.)
Method getPerformance ( param As% String ) As% Integer
{
set cn = $ NAMESPACE
znspace "% sys "
set m = ## class ( SYS.Monitor.SystemSensors ). % New ()
do m . GetSensors ()
znspace cn
quit $ listbuild ( m . SensorReading ( "GlobalRefsPerMin" ),
m . SensorReading ( "RoutineCommandsPerMin" ),
m . SensorReading ( "RoutineLoadsPerMin" ))
}
}
')
{
/// Give the application a name. This allows you to group different
/// classes together under the same SNMP MIB.
/// The default is the package name.
Parameter APPLICATION = "Monitoring" ;
/// CSP sessions count
Property Sessions As% Monitor.Integer ;
/// License user limit
Property KeyLicenseUnits As% Monitor.Integer ;
/// License key expiration date
Property KeyExpirationDate As% Monitor.String ;
/// Global references speed
Property GloRefSpeed As% Monitor.Integer ;
/// Number of commands executed
Property ExecutedSpeed As% Monitor.Integer ;
/// Number of routine loads / save
Property RoutineLoadSpeed As% Monitor.Integer ;
/// The method is REQUIRED. It is where the Application Monitor
/// calls to collect data samples
/// ^ SNMP server process when requested.
Method GetSample () As% Status
{
set .. Sessions = .. getSessions ()
set .. KeyLicenseUnits = .. getKeyLicenseUnits ()
set .. KeyExpirationDate = .. getKeyExpirationDate ()
set perfList = .. getPerformance ()
set .. GloRefSpeed = $ listget ( perfList , 1)
set .. ExecutedSpeed = $ listget ( perfList , 2)
set .. RoutineLoadSpeed = $ listget ( perfList , 3)
quit $$$ OK
}
/// Get CSP sessions count
Method getSessions () As% Integer
{
// q $ system.License.CSPUsers () // This method will only work if we dont 'use WebAddon
// This will work even if we use WebAddon
set csp = ""
try {
set cn = $ NAMESPACE
znspace "% sys "
set db = ## class ( SYS.Stats.Dashboard ). Sample ()
set csp = db . CSPSessions
znspace cn
} catch e {
set csp = "0"
}
quit csp
}
/// Get license user's power
Method getKeyLicenseUnits () As% Integer
{
quit $ system .License . KeyLicenseUnits ()
}
/// Get license expiration date in human-readable format
Method getKeyExpirationDate () As% String
{
quit $ zdate ( $ system .License . KeyExpirationDate (), 3)
}
/// Get performance metrics (gloref, rourines etc.)
Method getPerformance ( param As% String ) As% Integer
{
set cn = $ NAMESPACE
znspace "% sys "
set m = ## class ( SYS.Monitor.SystemSensors ). % New ()
do m . GetSensors ()
znspace cn
quit $ listbuild ( m . SensorReading ( "GlobalRefsPerMin" ),
m . SensorReading ( "RoutineCommandsPerMin" ),
m . SensorReading ( "RoutineLoadsPerMin" ))
}
}
')
We check that the data we need is unloaded by calling the GetSample () method:
Checking GetSample () operation
TEST> sx = ## class (metrics.snmp.Metrics).% New ()
TEST> d x.GetSample ()
TEST> zw x
x = <OBJECT REFERENCE> [2@metrics.snmp.Metrics]
+ ----------------- general information - | oref value: 2
| class name: metrics.snmp.Metrics
| reference count: 2
+ ----------------- attribute values - | ExecutedSpeed = 1155679
| GloRefSpeed = 171316
| KeyExpirationDate = "2014-10-11"
| KeyLicenseUnits = 100
| RoutineLoadSpeed = 186
| Sessions = 1
2. Register and activate a new class in Caché with ^% SYSMONMGR
Open the terminal and go to the TEST area:
We connect the system monitor
[root @ server ~] # csession test -U test
Host: server, Instance: TEST
TEST> d ^% SYSMONMGR
1. Select item 5, Manage Application Monitor.
2. Select item 2, Manage Monitor Classes.
3. Select item 3, Register Monitor System Classes. Watching the compilation:
Export to XML began on 08/18/2014 16:00:51
Exported class: Monitor.Sample
Export completed successfully.
The download began on 08/18/2014 16:00:51
Download file /opt/intersystems/ensemble/mgr/Temp/45DDB3FppRHCuw.stream as xml
Import Class: Monitor.Sample
Class Compilation: Monitor.Sample
Compiling the program :: Monitor.Sample.G1.MAC
Compile table: Monitor.Sample
Compile the program: Monitor.Sample.1
Download completed successfully.
4. Select item 1, Activate / Deactivate Monitor Class
Class ??
Num MetricsClassName Activated
1)% Monitor.System.AuditCount N
...
15) metrics.snmp.Metrics N
Class? 15 metrics.snmp.Metrics
Activate class? Yes => Yes
5. Select item 6, Exit
6. Once again, select item 6, Exit
7. Choose item 1, Start / Stop System Monitor
8. Choose item 2, Stop System Monitor
Stopping System Monitor ... System Monitor not running!
9. Choose item 1, Start System Monitor
Starting System Monitor ... System Monitor started
10. Choose item 3, Exit
11. Select item 4, View System Monitor State
Component state
System Monitor OK
% SYS.Monitor.AppMonSensor
3. Create a custom MIB
A custom MIB is created using the methods of the MonitorTools.SNMP class. For example, PEN (Private Enterprise Number) will take the dummy, 99990, then the PEN must be registered with IANA . View already registered rooms here . For example, PEN InterSystems has the number 16563.
16563
InterSystems
Robert Davis
rdavis & intersystems.com
To create a MIB file, we will use the MonitorTools.SNMP class, in particular, the CreateMIB () method. This method takes 10 arguments as input:
| Name and type of argument | Description | What we substitute |
|---|---|---|
| AppName As % String | app name | The value of the APPLICATION parameter of the class metrics.snmp.Metrics - Monitoring |
| Namespace As % String | Our area | TEST |
| EntID As % Integer | PEN companies | 99990 (Fiction) |
| AppID As % Integer | OID applications within the company | 42 |
| Company As % String | company name (uppercase) | fiction |
| Prefix As % String | the prefix of all the SNMP objects we create | fiction |
| CompanyShort As % String | short company prefix (uppercase) | fict |
| MIBname As % String | MIB file name | ISC-TEST |
| Contact As % String | contact information (in particular, address) | Leave the default value: Earth, Russia, Somewhere in the forests, Subject: ISC-TEST.mib |
| List As % Boolean | Analog verbose. Show the progress of the job to create a MIB file | one |
Actually, the creation of a MIB file:
CreateMIB ()
% SYS> d ## class (MonitorTools.SNMP) .CreateMIB ("Monitoring", "TEST", 99990,42, "fiction", "fict", "fiction", "ISC-TEST", 1)
Create SNMP structure for Application - Monitoring
Group - Metrics
ExecutedSpeed = Integer
GloRefSpeed = Integer
KeyExpirationDate = String
KeyLicenseUnits = Integer
RoutineLoadSpeed = Integer
Sessions = Integer
Create MIB file for Monitoring
Generate table Metrics
Add object ExecutedSpeed, Type = Integer
Add object GloRefSpeed, Type = Integer
Add object KeyExpirationDate, Type = String
Add object KeyLicenseUnits, Type = Integer
Add object RoutineLoadSpeed, Type = Integer
Add object Sessions, Type = Integer
MIB done.
A new MIB ISC-TEST.mib has appeared in the <Install_dir> / mgr / TEST directory.
4. Start the monitoring service with the connected Caché subagent.
Open the System Administration Control Panel -> Security -> Services ->% Service_Monitor (click) -> Service Enabled (check) .
We also indicate that we want to start the SNMP subagent when Caché starts (click Configure Monitor Settings):
On Linux CentOS, we use the net-snmp package for SNMP monitoring. We install it, configure it on the use of subagents, and that the master agent and subagents will communicate via the standard port 705.
[root @ server ~] # grep -i agentx / etc / services
agentx 705 / tcp # AgentX
agentx 705 / udp # AgentX
A small article on the snmpd.conf configuration file in addition to the mana can be viewed on cyberciti . Here is our final setting:
Our snmpd.conf
[root @ server ~] # yum install net-snmp
[root @ server ~] # grep '^ [^ #]' /etc/snmp/snmpd.conf
master agentx
agentXSocket TCP: localhost: 705
com2sec local localhost public
group MyRWGroup v1 local
group MyRWGroup v2c local
group MyRWGroup usm local
view all included .1 80
view system included .iso.org.dod
access MyROGroup "" any noauth exact all none none
access MyRWGroup "any noauth exact all all none
syslocation server (edit /etc/snmp/snmpd.conf)
syscontact Root <root @ localhost> (configure /etc/snmp/snmp.local.conf)
dontLogTCPWrappersConnects yes
Restarting Linux snmpd and snmptrapd demons. We start the ^ SNMP service to get started with the Caché SNMP subagent:
% Sys> d start ^ SNMP
5. Check that our newly created user OIDs are available .
This can be done using snmpwalk - we will show an OID that displays the number of CSP sessions:
[root @ server mgr] # snmpwalk -On -v 2c -c public localhost 1.3.6.1.4.1.99990
.1.3.6.1.4.1.99990.42.1.1.1.1.4.84.69.86.84 = INTEGER: 448035
.1.3.6.1.4.1.99990.42.1.1.1.2.4.84.69.88.8 = INTEGER: 64190
.1.3.6.1.4.1.99990.42.1.1.1.3.4.84.69.83.84 = STRING: "2014-10-11"
.1.3.6.1.4.1.99990.42.1.1.1.4.4.84.69.86.84 = INTEGER: 200
.1.3.6.1.4.1.99990.42.1.1.1.4.4.84.69.83.84 = INTEGER: 93
.1.3.6.1.4.1.99990.42.1.1.1.6.4.84.69.83.84 = INTEGER: 1
The file ISC-TEST.mib indicates the sequence of our OIDs:
FictMetricsR :: =
SEQUENCE {
fictExecutedSpeed Integer32,
fictGloRefSpeed Integer32,
fictKeyExpirationDate DisplayString,
fictKeyLicenseUnits Integer32,
fictRoutineLoadSpeed Integer32,
fictSessions Integer32
}
Accordingly, for example, the number of sessions is the last OID 1.3.6.1.4.1.99990.42.1.1.1.6. You can compare with the number of sessions shown by SMP dashboard:
6. Add our OIDs to a third-party monitoring system.
For example, take Zabbix . Zabbix documentation can be found here . By installing and configuring Zabbix specifically on CentOS, you can see it here . Zabbix was chosen as a system that allows not only to draw graphics, but also to monitor Plain Text (in our case, this is the license expiration date and license power by users). After adding our 6 metrics to the Items of our local host and creating 4 graphs and 2 PlainText parameters (like screen elements), we see the following picture (an example of a small “live” system is shown):
At the top - information about when the license ends, and how many license slots we have. The graphs speak for themselves.
7. Add the launch of the system monitor in our TEST area at system startup
There is a good document on the use of custom routines that are triggered when Caché starts and stops. They are called respectively% ZSTART and% ZSTOP.
What we are interested in in all of this is to raise the system monitor (^% SYSMONMGR) in the TEST user area at the start. By default, this monitor starts only in the% SYS area. Accordingly, we will consider only the program ^% ZSTART. Source% ZSTART.mac (create and save it in the% SYS area).
Our autostart
% ZSTART ; User startup routine.
SYSTEM ;
; Cache starting
do $ zu (9, "" , "Starting System Monitor in TEST namespace by ^% ZSTART ... Begin" )
znspace "TEST"
set sc = ## class ( % SYS.Monitor ). Start ()
do $ system .OBJ . DisplayError ( sc )
if ( sc = 1) {
do $ zutil (9, "" , "Starting System Monitor in TEST namespace by ^% ZSTART ... OK" )
} else {
do $ zutil (9, "" , "Starting System Monitor in TEST namespace by ^% ZSTART ... ERROR" )
}
; Starting SNMP
znspace "% sys "
do start ^ SNMP
quit
LOGIN ;
; a user logs into Cache (user account or telnet)
quit
JOB ;
; JOB'd process begins
quit
CALLIN ;
; a process enters via CALLIN interface
quit
Restart (if possible) Caché to make sure that the collection of SNMP statistics after the restart of Caché continues.
That's all. Perhaps someone will have comments on the choice of monitoring parameters or code, but the task was to show the possibility of such monitoring in principle, and you can always add the necessary parameter or refactor the code in the future.
Thanks for attention!
Source: https://habr.com/ru/post/241271/
All Articles