Rendering Clones in a Python Project
Recently in our project it was required to set up code quality monitoring. The quality of the code is a subjective notion, however, many metrics long ago were invented that allow for a quantitative analysis. For example, cyclomatic complexity or maintainability index. Measuring indicators of this kind is commonplace for languages like Java or C ++, however (one gets the impression) in the community of python it’s rare that someone thinks about it. Fortunately, there is a wonderful radon with xenon , which quickly and accurately calculates the metrics mentioned above and even some others. Of course, for professional enterprise tools is not enough, but everything you need is present.
In addition to calculating metrics, it is also useful to perform a dependency analysis. If an architecture is declared in the project, then certain links should exist between the individual parts. The most frequent example: an application is built around a library that provides an API, and it is highly undesirable to perform actions around this API. In other words, ioctl is not good in the kernel when libc is present. For python, there are several packages that build a dependency graph between modules, and snakefood seemed to me the most successful.
In addition to analyzing dependencies, it is equally useful to define copy-paste, especially if the project involves juniors or other people who like to “cut corners with a grinder”. This is exactly what will be discussed in the article.
clonedigger
Surely science knows the commercial tools for determining copy-paste for Python, but the main selection criterion was free. The very first link in the search engine led to clonedigger . For this wonderful package we say thanks to peter_bulychev . The article 6 years ago you can see the presentation , it contains a description of the algorithm and retelling it makes no sense. The most important from the application point of view: pip install clonedigger, there is no support for the troika, it has not been updated for 3 years, there is a deadly fork on the githaba . Well, okay! At 2.7.8 it works fine, but my project is still thoroughly saturated with the sixth.
')
Digger is a console utility of the same name, with which the options and the path to the root of the experimental project are input. Is able to spit out machine-readable XML according to the CPD scheme, if you pass --cpd-output. This makes the Violations Plugin in Jenkins happy.
Hidden text
If you look at the list of languages with which “don't shoot the messenger” works, injustice immediately catches the eye: there are all sorts of PHP , but no Python! And so with many tools. Hence the remark at the beginning of the article about the community.
Also, clonedigger has a super cool feature “do not scan selected directories” (--ignore-dir), which allows you
def walk(dirname): for dirpath, dirs, files in os.walk(file_name): dirs[:] = (not options.ignore_dirs and dirs) or [d for d in dirs if d not in options.ignore_dirs] ... Explanation: not relative paths are excluded, but names. Passing, for example, “ext”, you exclude both “root / ext”, and “root / foo / bar / ext”, and “root / tests / ext” at once - you had to spend some time to realize this, and even get into the source.
So, after the digger is completed with the required option, XML will appear with the clones found. The structure is approximately as follows:
<pmd-cpd> <duplication lines="13" tokens="40"> <file line="853" path="tornado/auth.py"/> <file line="735" path="tornado/auth.py"/> <codefragment> <![CDATA[ def _on_friendfeed_request(self, future, response): if response.error: future.set_exception(AuthError( "Error response %s fetching %s" % (response.error, response.request.url))) return future.set_result(escape.json_decode(response.body)) def _oauth_consumer_token(self): self.require_setting("friendfeed_consumer_key", "FriendFeed OAuth") self.require_setting("friendfeed_consumer_secret", "FriendFeed OAuth") return dict( key=self.settings["friendfeed_consumer_key"], secret=self.settings["friendfeed_consumer_secret"]) ]]> </codefragment> </duplication> <duplication> ... </pmd-cpd> It's great when you can get a list of clones in CI at any time, but for monitoring, perhaps, is not enough. There is no notorious picture, looking at which, the project manager will be able to form an opinion on the scale of the disaster.
Visualization
I submit to the public a script to display the value of mutual copy-paste in the project modules . Two files are input: the XML from clonedigger and the image being created. Dependencies: matplotlib, scipy, xmltodict, cairo. Work algorithm:
- Parse cpd
- Build a matrix of cloning values between modules
- Cluster modules on the inverse matrix (i.e., on the matrix of the distance between files)
- Apply the found order of the modules to the original matrix
- Long and tedious draw on matplotlib
Parsing
with open(sys.argv[1], 'r') as fin: data = xmltodict.parse(fin.read()) Parsing is essentially done in one line to my favorite xmltodict: no SAX, no knowledge of xml, it's even simpler than an XDocument in Sharp. If xmltodict encounters several identical tags on the same level, then it creates an array, and the attributes differ from the nested "@" elements at the beginning of the name. Of course, this is not the fastest method and not the most universal, but in this case it works for one hundred percent.
Matrix clones
Next we get a list of unique paths and build an index:
files = list(sorted(set.union({dup['file'][i]['@path'] for dup in data['pmd-cpd']['duplication'] for i in (0, 1)}))) findex = {f: i for i, f in enumerate(files)} We run along the parsed tree and build a triangular matrix, in the cells of which lie the summarized number of rows in the found clones:
mat = numpy.zeros((len(files), len(files))) for dup in data['pmd-cpd']['duplication']: mat[tuple(findex[dup['file'][i]['@path']] for i in (0, 1))] += \ int(dup['@lines']) We add to our triangular matrix the same, but transposed, thereby creating a full-fledged matrix:
mat += mat.transpose() Clustering
If we draw our matrix right now, it will not be very clear which groups of files copy each other. In the case of single pairs, everything is clear, but clones have the vile property of being dragged at once into many modules at the same time, for example, due to poor refactoring. Therefore, it is better to first group the files by similarity among themselves, forming square pairwise disjoint areas. Strictly speaking, if module A is similar to module B, and B is similar to C, this does not mean at all that A is similar to C (the relation is not transitive), but very often this is the case .
We build the distance matrix as inverse to the cloning matrix, not forgetting that it is impossible to divide by zero, then we cluster:
mat[mat == 0] = 0.001 order = leaves_list(linkage(1 / mat)) That's what I love scipy for! One line, but how much is inside! By the way, instead of linkage, you can try another method available . Oh yes, clustering should be hierarchical (see, for example, this article is what it is), because we want to organize the files (the leaves_list function). If you want to play yourself, it is convenient to use a dendrogram to display the resulting hierarchy.
Apply the found order to the file names and matrix:
mat = mat[numpy.ix_(order, order)] files = [files[i] for i in order] art
I am not a specialist in scientific visualization, and I assembled the code on my knee using the good old stackoverflow driven development . First, choose a palette in the gradations of red and white:
cdict = {'red': ((0.0, 1.0, 1.0), (1.0, 1.0, 1.0)), 'green': ((0.0, 1.0, 1.0), (1.0, 0.0, 0.0)), 'blue': ((0.0, 1.0, 1.0), (1.0, 0.0, 0.0))} reds = LinearSegmentedColormap('Reds', cdict) You can choose any other from the matplotlib.cm collection. Next, create a shape and axis and polish them with a file for a long time:
fig = pyplot.figure() ax = fig.add_subplot(111) ax.pcolor(mat, cmap=reds) # uncomment the following to remove the frame around the map # ax.set_frame_on(False) ax.set_xlim((0, len(files))) ax.set_ylim((0, len(files))) ax.set_xticks(numpy.arange(len(files)) + 0.5, minor=False) ax.set_yticks(numpy.arange(len(files)) + 0.5, minor=False) ax.invert_yaxis() ax.xaxis.tick_top() ax.set_xticklabels([os.path.basename(f) for f in files], minor=False, rotation=90) ax.set_yticklabels([os.path.basename(f) for f in files], minor=False) ax.grid(False) ax.set_aspect(1) for t in ax.xaxis.get_major_ticks(): t.tick1On = False t.tick2On = False for t in ax.yaxis.get_major_ticks(): t.tick1On = False t.tick2On = False As you can see, the file names are taken basic, without a path, because otherwise for branchy projects will not fit in the drawing area. Ok, very little remains: set an adequate size and actually render:
fig_size = 16 * len(files) / 55 fig.set_size_inches(fig_size, fig_size) pyplot.savefig(sys.argv[2], bbox_inches='tight', transparent=False, dpi=100, pad_inches=0.1) The size is matched to the eye so that the file names do not stick together. The file format is determined by its extension automatically, at a minimum, cairo supports png and svg.
Testing
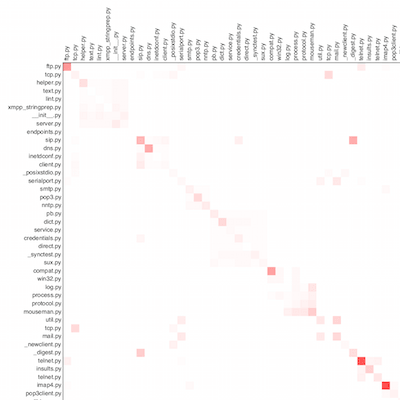
For the demonstration, I took three open projects: tornado, matplotlib and twisted. Tests were excluded from the analysis. By the way, KDPV - the upper left corner of twisted.
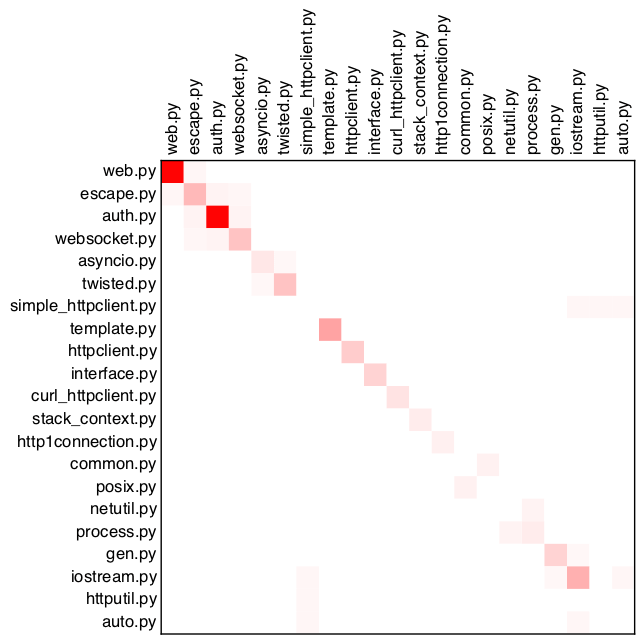
tornado
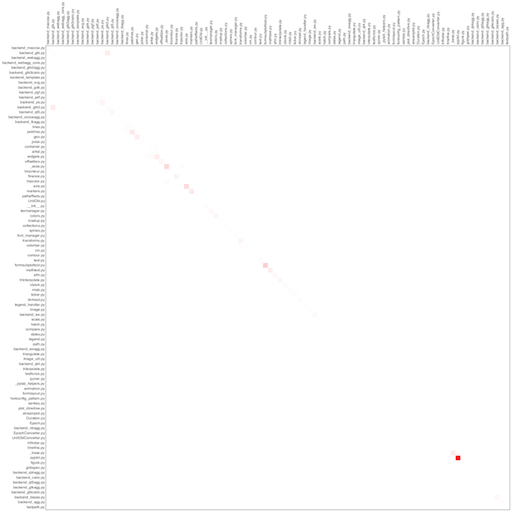
matplotlib
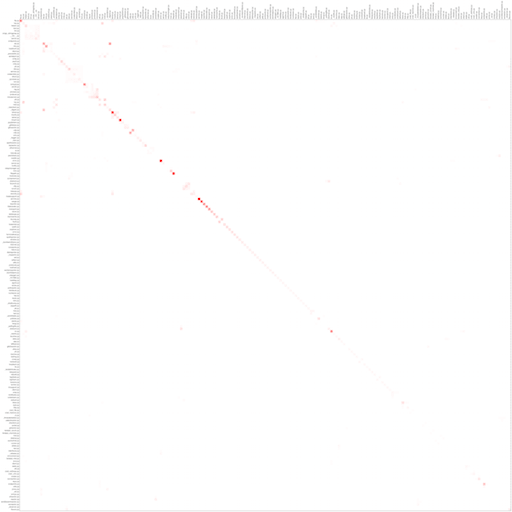
twisted
As you can see, all projects have a main diagonal, i.e. most often files copy themselves. Perhaps this is due to the peculiarities of the language, perhaps the lack of macros. Nevertheless, bright red dots deserve close attention and are candidates for refactoring - proved by our own projects.
I will be glad to comments and corrections, thank you for your attention.
Source: https://habr.com/ru/post/241103/
All Articles