BlackHole.js with leaflet.js maps
Greetings to you community!
I want to offer to your attention, all the same, brought to a certain point, my library for visualizing blackHole.js data using d3.js.
This library allows you to create visualizations of such a plan:
pictures are clickable
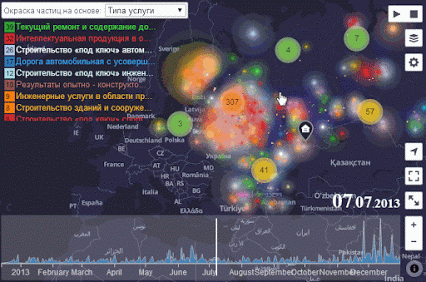 or
or 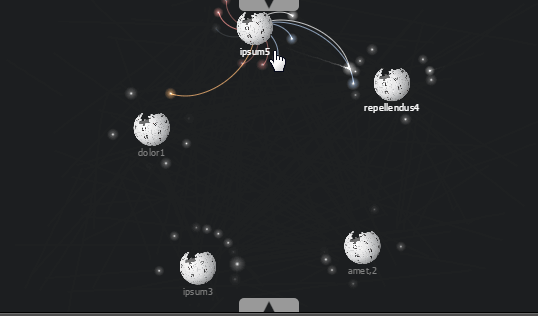
The article will be devoted to the example of using blackHole.js in conjunction with leaflet.js and similar mapbox types.
But there will also be considered the use of: google maps , leaflet.heat .
')
It turns out like this =)
Look, how did you move? ...
The example is based on the location-history-visualizer project from @theopolisme
In the text of the article only interesting places will be disassembled. You can “dig out” the rest of the code on codepen.io .
First we need:
The example consists of three files index.html, index.css and index.js.
The code of the first two you can look at codepen.io
But in a nutshell, I can say that we really need the following DOM structure:
The application itself consists of several parts.
In order for us to share blackHole.js and leaflet.js , we need to create a wrapper layer to display our visualization on top of the map. At the same time, we will keep all the mechanisms for working with the map and the interactive features of the blackHole.js library.
The leaflet.js library has the tools we need: L.Class .
In it we need to "overload" the methods: initialize , onAdd , onRemove , addTo .
In fact, these are just methods for standard work with layers in leaflet.js .
There is nothing special about this; any plugin, or layer, or control for leaflet.js is created in a similar way.
Here for example visualization process controls for blackHole.js .
The Google Maps API provides the ability to personalize the displayed map. To do this, you can read the documentation . There are a lot of parameters and their combination that will give you the desired result. But quickly use ready-made kits .
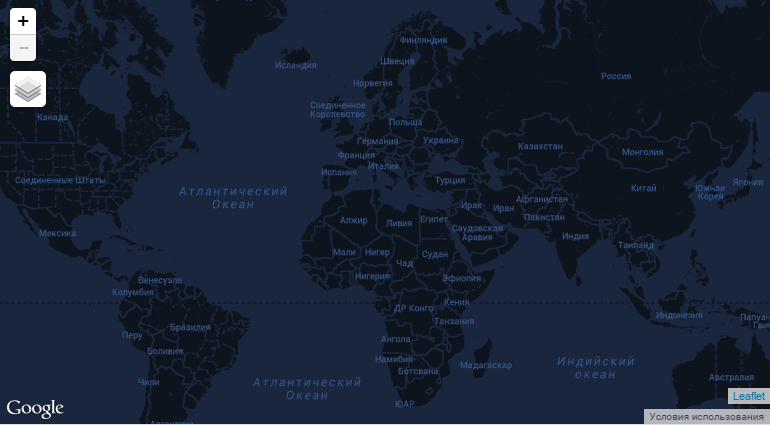
Let's now create a map and request google titles in the style we need.
As a result, we get just such a card
I came to this solution after some time in the MapBox project, which provides a tool for conveniently styling maps and much more, but with more requests it becomes paid.
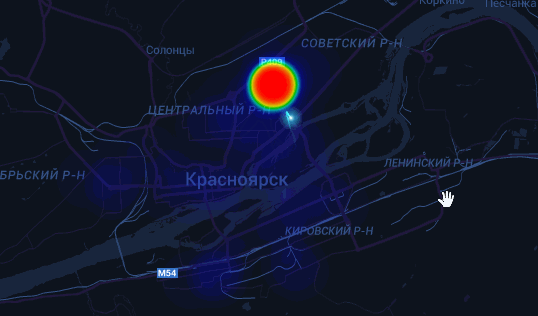
Heatmap or heatmap allows you to display the frequency of mentioning a particular coordinate, highlighting the intensity of a gradient of colors and grouping data when scaling. It turns out something like
To build it, we use the leaflet.heatmap plugin. But there are others .
In order for our visualization to always be on top of other layers, and in particular over the heatmap, and not lose its interactive features, you need to add blackHole.js after other layers of plug-ins are added to the map.
The library is ready to work immediately from the "box" with a specific data format, namely:
Then, to run the visualization, you need nothing more than js code:
more in the documentation
But it turned out that we live in a world where there are ideal cases - once or twice and miscalculated.
Therefore, the library provides programmers the opportunity to prepare blackHole.js to work with their data format.
In our case, we are dealing with LocationHistory.json from Google.
Let's prepare the data and configure blackHole.js to work with them.
Now data parsing
Thanks to the ability to set the valueOf function to get the value of an object, we can always get the exact coordinates of the parent objects on the map.
How the library works. When launched, it analyzes the data provided to it, identifying the parent and child unique elements. Defines the rendering boundaries according to the function passed in for the getGroupBy event. Behind that starts two d3.layout.force one is responsible for calculating the position of the parent elements, the other for the child elements. Methods are also applied to child elements for resolving collisions and clustering according to the parent element.
With our setup, we get the following behavior:
Since we have one child object, it starts flying from one parent to another. And it turns out the picture that is shown at the very beginning of the article.
The library was made to solve their own problems, since after the publication of GitHub Visualizer , there appeared a certain number of orders to remake it for various needs, and some wanted to just figure out what and how to change it to solve their problem.
As a result, I made everything I needed to create visualizations like GitHub Visualizer into a separate library and have already done a number of projects, one of which took the first place in the GosHealth contest .
The simplified GitHub Visualizer on blackHole.js, which works with xml files obtained by running code_swarm, can be found here .
You can use this guide to generate the file.
I hope that there will be co-authors who will make their improvements and correct my misconceptions.
At the moment, the library consists of 4 components:
In the near future, I plan to bring Parser and Render into separate classes in order to facilitate the task of preparing data and provide the opportunity to draw not only on the canvas, but also, if desired, on WebGL.
Waiting for useful comments!
Thank!
PS Friends please write about errors in private messages.
I want to offer to your attention, all the same, brought to a certain point, my library for visualizing blackHole.js data using d3.js.
This library allows you to create visualizations of such a plan:
pictures are clickable
or The article will be devoted to the example of using blackHole.js in conjunction with leaflet.js and similar mapbox types.
But there will also be considered the use of: google maps , leaflet.heat .
')
It turns out like this =)
The behavior of the point depends on where I was in the opinion of google at a certain point in time.
Look, how did you move? ...
The example is based on the location-history-visualizer project from @theopolisme
In the text of the article only interesting places will be disassembled. You can “dig out” the rest of the code on codepen.io .
In the article
- Training
- JS application
- Connection layer with blackHole.js
- Personalization and display of Google Maps
- Connecting layer c heatmap
- Preparation and processing of data
- Conclusion
Training
First we need:
- leaflet.js is an open source library written by Vladimir Agafonkin (CloudMade) in JavaScript for displaying maps on websites (© wikipedia).
- Leaflet.heat is a lightweight heatmap palgin for leaflet.
- Google Maps Api - to connect custom maps to google maps
- Leaflet-plugins by Pavel Shramov - the plugin allows you to connect google, yandex, bing to leaflet.js . But we in particular need only the script Google.js
- d3.js is a library for working with data, possessing a set of tools for manipulating them and a set of methods for displaying them.
- Well, actually blackHole.js
- Your geo position data is carefully collected for us by Google.How to upload dataTo get started, you must go to Google Takeout to download LocationHistory information. On the page, click the Select none button, then find and mark it in the “Location History” list. Click the Next button and click the Create archive button. Wait for the work to complete. Click the Download button and unzip the archive to the directory you need.
The example consists of three files index.html, index.css and index.js.
The code of the first two you can look at codepen.io
But in a nutshell, I can say that we really need the following DOM structure:
<!DOCTYPE html> <html> <head> <meta charset="utf-8"> </head> <body> <div id="map"></div> <!-- --> </body> </html> JS application
The application itself consists of several parts.
- Connect layer with blackHole.js .
- Personalization and display of Google Maps .
- Connection layer c heatmap .
- Preparation and data processing .
Class wrapper for blackHole for leaflet
In order for us to share blackHole.js and leaflet.js , we need to create a wrapper layer to display our visualization on top of the map. At the same time, we will keep all the mechanisms for working with the map and the interactive features of the blackHole.js library.
The leaflet.js library has the tools we need: L.Class .
In it we need to "overload" the methods: initialize , onAdd , onRemove , addTo .
In fact, these are just methods for standard work with layers in leaflet.js .
Class with description
!function(){ L.BlackHoleLayer = L.Class.extend({ // initialize: function () { }, // onAdd: function (map) { // , if (this._el) { this._el.style('display', null); // if (this._bh.IsPaused()) this._bh.resume(); return; } this._map = map; // div, // this._el = d3.select(map.getPanes().overlayPane).append('div'); // blackHole this._bh = d3.blackHole(this._el); // div var animated = map.options.zoomAnimation && L.Browser.any3d; this._el.classed('leaflet-zoom-' + (animated ? 'animated' : 'hide'), true); this._el.classed('leaflet-blackhole-layer', true); // map.on('viewreset', this._reset, this) .on('resize', this._resize, this) .on('move', this._reset, this) .on('moveend', this._reset, this) ; this._reset(); }, // leaflet onRemove: function (map) { // . this._el.style('display', 'none'); // , if (this._bh.IsRun()) this._bh.pause(); }, // . addTo: function (map) { map.addLayer(this); return this; }, // resize _resize : function() { // . this._bh.size([this._map._size.x, this._map._size.y]); this._reset(); }, // _reset: function () { var topLeft = this._map.containerPointToLayerPoint([0, 0]); var arr = [-topLeft.x, -topLeft.y]; var t3d = 'translate3d(' + topLeft.x + 'px, ' + topLeft.y + 'px, 0px)'; this._bh.style({ "-webkit-transform" : t3d, "-moz-transform" : t3d, "-ms-transform" : t3d, "-o-transform" : t3d, "transform" : t3d }); this._bh.translate(arr); } }); L.blackHoleLayer = function() { return new L.BlackHoleLayer(); }; }(); There is nothing special about this; any plugin, or layer, or control for leaflet.js is created in a similar way.
Here for example visualization process controls for blackHole.js .
Personalize google maps
The Google Maps API provides the ability to personalize the displayed map. To do this, you can read the documentation . There are a lot of parameters and their combination that will give you the desired result. But quickly use ready-made kits .
Let's now create a map and request google titles in the style we need.
Add code google maps
// div#map var map = new L.Map('map', { maxZoom : 19, // minZoom : 2 // }).setView([0,0], 2); // // google c ROADMAP . var ggl = new L.Google('ROADMAP', { mapOptions: { backgroundColor: "#19263E", styles : [ { "featureType": "water", "stylers": [ { "color": "#19263E" } ] }, { "featureType": "landscape", "stylers": [ { "color": "#0E141D" } ] }, { "featureType": "poi", "elementType": "geometry", "stylers": [ { "color": "#0E141D" } ] }, { "featureType": "road.highway", "elementType": "geometry.fill", "stylers": [ { "color": "#21193E" } ] }, { "featureType": "road.highway", "elementType": "geometry.stroke", "stylers": [ { "color": "#21193E" }, { "weight": 0.5 } ] }, { "featureType": "road.arterial", "elementType": "geometry.fill", "stylers": [ { "color": "#21193E" } ] }, { "featureType": "road.arterial", "elementType": "geometry.stroke", "stylers": [ { "color": "#21193E" }, { "weight": 0.5 } ] }, { "featureType": "road.local", "elementType": "geometry", "stylers": [ { "color": "#21193E" } ] }, { "elementType": "labels.text.fill", "stylers": [ { "color": "#365387" } ] }, { "elementType": "labels.text.stroke", "stylers": [ { "color": "#fff" }, { "lightness": 13 } ] }, { "featureType": "transit", "stylers": [ { "color": "#365387" } ] }, { "featureType": "administrative", "elementType": "geometry.fill", "stylers": [ { "color": "#000000" } ] }, { "featureType": "administrative", "elementType": "geometry.stroke", "stylers": [ { "color": "#19263E" }, { "lightness": 0 }, { "weight": 1.5 } ] } ] } }); // . map.addLayer(ggl); As a result, we get just such a card
I came to this solution after some time in the MapBox project, which provides a tool for conveniently styling maps and much more, but with more requests it becomes paid.
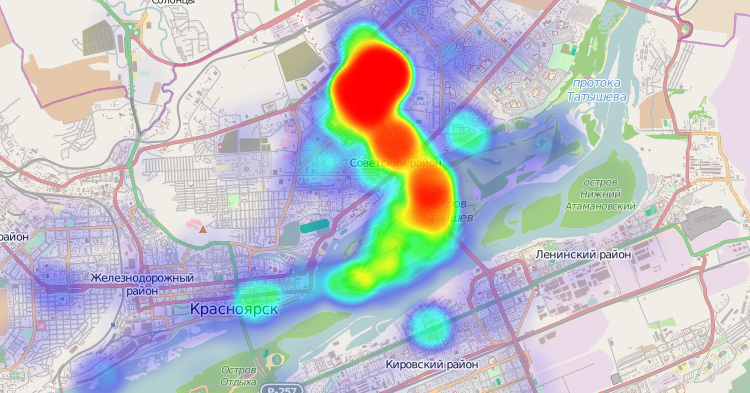
Heatmap
Heatmap or heatmap allows you to display the frequency of mentioning a particular coordinate, highlighting the intensity of a gradient of colors and grouping data when scaling. It turns out something like
To build it, we use the leaflet.heatmap plugin. But there are others .
In order for our visualization to always be on top of other layers, and in particular over the heatmap, and not lose its interactive features, you need to add blackHole.js after other layers of plug-ins are added to the map.
// blackHole.js var visLayer = L.blackHoleLayer() , heat = L.heatLayer( [], { // heatmap opacity: 1, // radius: 25, // blur: 15 // }).addTo( map ) // heatmap ; visLayer.addTo(map); // blackHole.js Data preparation and visualization
The library is ready to work immediately from the "box" with a specific data format, namely:
var rawData = [ { "key": 237, "category": "nemo,", "parent": { "name": "cumque5", "key": 5 }, "date": "2014-01-30T12:25:14.810Z" }, //... ] Then, to run the visualization, you need nothing more than js code:
var data = rawData.map(function(d) { d.date = new Date(d.date); return d; }) , stepDate = 864e5 , d3bh = d3.blackHole("#canvas") ; d3bh.setting.drawTrack = true; d3bh.on('calcRightBound', function(l) { return +l + stepDate; }) .start(data) ; more in the documentation
But it turned out that we live in a world where there are ideal cases - once or twice and miscalculated.
Therefore, the library provides programmers the opportunity to prepare blackHole.js to work with their data format.
In our case, we are dealing with LocationHistory.json from Google.
{ "somePointsTruncated" : false, "locations" : [ { "timestampMs" : "1412560102986", "latitudeE7" : 560532385, "longitudeE7" : 929207681, "accuracy" : 10, "velocity" : -1, "heading" : -1, "altitude" : 194, "verticalAccuracy" : 1 }, { "timestampMs" : "1412532992732", "latitudeE7" : 560513299, "longitudeE7" : 929186602, "accuracy" : 10, "velocity" : -1, "heading" : -1, "altitude" : 203, "verticalAccuracy" : 2 }, //... ]} Let's prepare the data and configure blackHole.js to work with them.
Start / restart function
function restart() { bh.stop(); if ( !locations || !locations.length) return; // heatmap heat.setLatLngs([]); // bh.start(locations, map._size.x, map._size.y, true); visLayer._resize(); } Now data parsing
File reading and data preparation
var parentHash; // . function stageTwo ( file ) { bh.stop(); // // LocationHistory leaflet.js var SCALAR_E7 = 0.0000001; // processFile( file ); function processFile ( file ) { // FileReader var reader = new FileReader(); reader.onprogress = function ( e ) { // }; reader.onload = function ( e ) { try { locations = JSON.parse( e.target.result ).locations; if ( !locations || !locations.length ) { throw new ReferenceError( 'No location data found.' ); } } catch ( ex ) { // console.log(ex); return; } parentHash = {}; // var sw = [-Infinity, -Infinity] , se = [Infinity, Infinity]; locations.forEach(function(d, i) { d.timestampMs = +d.timestampMs; // // d.lat = d.latitudeE7 * SCALAR_E7; d.lon = d.longitudeE7 * SCALAR_E7; // parent d.pkey = d.latitudeE7 + "_" + d.longitudeE7; // sw[0] = Math.max(d.lat, sw[0]); sw[1] = Math.max(d.lon, sw[1]); se[0] = Math.min(d.lat, se[0]); se[1] = Math.min(d.lon, se[1]); // , . d.parent = parentHash[d.pkey] || makeParent(d); }); // locations.sort(function(a, b) { return a.timestampMs - b.timestampMs; }); // id locations.forEach(function(d, i) { d._id = i; }); // map.fitBounds([sw, se]); // restart(); }; reader.onerror = function () { console.log(reader.error); }; // reader.readAsText(file); } } function makeParent(d) { var that = {_id : d.pkey}; // leaflet that.latlng = new L.LatLng(d.lat, d.lon); // // that.x = { valueOf : function() { var pos = map.latLngToLayerPoint(that.latlng); return pos.x; } }; that.y = { valueOf : function() { var pos = map.latLngToLayerPoint(that.latlng); return pos.y; } }; return parentHash[that.id] = that; } Thanks to the ability to set the valueOf function to get the value of an object, we can always get the exact coordinates of the parent objects on the map.
Configure blackHole.js
// bh.setting.increaseChild = false; bh.setting.createNearParent = false; bh.setting.speed = 100; // bh.setting.zoomAndDrag = false; bh.setting.drawParent = false; // parent bh.setting.drawParentLabel = false; // bh.setting.padding = 0; // bh.setting.parentLife = 0; // bh.setting.blendingLighter = true; // Canvas bh.setting.drawAsPlasma = true; // bh.setting.drawTrack = true; // var stepDate = 1; // // , , (d) bh.on('getGroupBy', function (d) { // return d._id //d.timestampMs; }) .on('getParentKey', function (d) { return d._id; // }) .on('getChildKey', function (d) { return 'me'; // , }) .on('getCategoryKey', function (d) { return 'me; // , }) .on('getCategoryName', function (d) { return 'location'; // }) .on('getParentLabel', function (d) { return ''; // }) .on('getChildLabel', function (d) { return 'me'; // }) .on('calcRightBound', function (l) { // . return l + stepDate; }) .on('getVisibleByStep', function (d) { return true; // }) .on('getParentRadius', function (d) { return 1; // }) .on('getChildRadius', function (d) { return 10; // }) .on('getParentPosition', function (d) { return [dx, dy]; // }) .on('getParentFixed', function (d) { return true; // }) .on('processing', function(items, l, r) { // heatmap setTimeout(setMarkers(items), 10); }) .sort(null) ; // heatmap function setMarkers(arr) { return function() { arr.forEach(function (d) { var tp = d.parentNode.nodeValue; // heatmap heat.addLatLng(tp.latlng); }); } } How the library works. When launched, it analyzes the data provided to it, identifying the parent and child unique elements. Defines the rendering boundaries according to the function passed in for the getGroupBy event. Behind that starts two d3.layout.force one is responsible for calculating the position of the parent elements, the other for the child elements. Methods are also applied to child elements for resolving collisions and clustering according to the parent element.
With our setup, we get the following behavior:
- At each step that occurs after 100 milliseconds ( bh.setting. Speed = 100 ), the library selects only one item from the source data;
- calculates its position relative to the parent element;
- starts drawing and moves to the next step;
Since we have one child object, it starts flying from one parent to another. And it turns out the picture that is shown at the very beginning of the article.
Conclusion
The library was made to solve their own problems, since after the publication of GitHub Visualizer , there appeared a certain number of orders to remake it for various needs, and some wanted to just figure out what and how to change it to solve their problem.
As a result, I made everything I needed to create visualizations like GitHub Visualizer into a separate library and have already done a number of projects, one of which took the first place in the GosHealth contest .
The simplified GitHub Visualizer on blackHole.js, which works with xml files obtained by running code_swarm, can be found here .
You can use this guide to generate the file.
I hope that there will be co-authors who will make their improvements and correct my misconceptions.
At the moment, the library consists of 4 components:
- Parser - creating objects for visualization from transferred data
- Render - engaged in drawing pictures
- Processor - calculation of visualization steps
- Core - collects all the parts in itself, manages them and is engaged in the calculation of the position of objects
In the near future, I plan to bring Parser and Render into separate classes in order to facilitate the task of preparing data and provide the opportunity to draw not only on the canvas, but also, if desired, on WebGL.
Waiting for useful comments!
Thank!
PS Friends please write about errors in private messages.
Source: https://habr.com/ru/post/241023/
All Articles