Freelancers supply and demand analysis using the example of the oDesk exchange
Introduction
oDesk is the world's largest (well, at least oDesk itself thinks so) an international freelancers' exchange. About odesk on Habré has already been written quite a few times, for example, here or here , where, in my opinion, it is almost chewed for why and for whom this resource was created, and especially “with what it is”. In this regard, the stage of description and the principle of the site can be omitted. I will try to analyze the data both about the freelancers themselves and about the orders, customers and their requirements for freelancers - to put it bluntly, you need to be able and aware to be less in the subject of modern technologies. I will also analyze supply and demand based on data on freelance skills and customer requirements. And of course, some statistics and some pretty pictures as examples (who works for oDesk, where orders mainly come from, who earns more, and who works better, etc.). And all this on the basis of independently collected information, so openly and nobly provided by oDesk itself through the API . It is worth noting that an article with a small amount of statistics about oDesk has already managed to flash on the vastness of Habr, but in it, unlike the current article, oDesk
How the data was collected
When creating a new job, the client usually adds a list of necessary skills for its implementation. Skills can be very different (as knowledge of programming languages, and knowledge of operating systems or ordinary languages like Russian or English). A complete list in alphabetical order can be found here , just at the time of writing the article about 2500 thousand skills. In addition, their skills are added to the profile and freelancers. Thus, I implemented my data collection on the basis of information about jobs and freelancers according to their skills. Or rather, I first received a list of all skills using the API (for this there is a special function ), and then in the cycle on all skills I got a list of jobs and freelancers . In fact, this method skips jobs and freelancers who do not have a single skill, but we simply assume that such jobs are not interesting to us because the client himself does not know what he wants, and freelancers who do not have skills or are too lazy to add them to their description Profiles are unlikely to work well. The source code for the console application that collects data and saves it to the database I posted on GitHub .
')
A little about the size of the base, which was able to collect. Only about 500,000 freelancers, of whom more than 200,000 have completed at least one job, and about 150,000 have completed at least one hour. More than 50,000 open jobs at the time of this writing, with a description of each work on average includes about 5 skills.
Unfortunately, using the API, I did not get access to financial information, but rather how much customers actually spend and how much freelancers earn, however, by indirect signs, you can make some estimates, for example, information on the number of hours worked and the hourly rate of freelancers (although this not always true, as sometimes the hourly rate specified in the profile may not correspond to the one for which the freelancer actually works).
About countries
For a start, briefly about countries, or rather, about which countries more jobs are created from and which countries have more freelancers, and a little about how well this freelancers work and how much they ask for money.
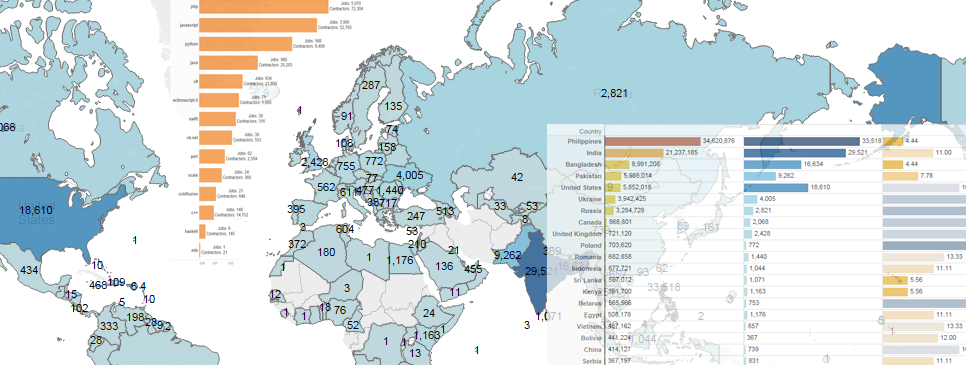
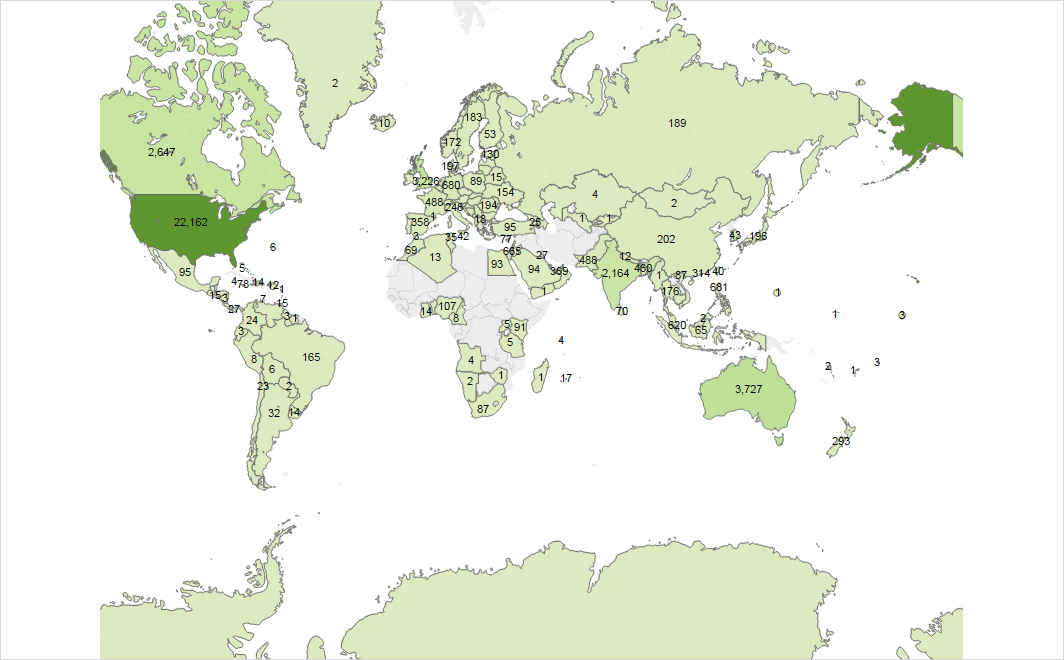
The following picture shows the countries with the most jobs (more intense color means greater value, and signatures mean absolute values). The top 10 countries include: USA, Australia, UK, Canada, India, Philippines, Germany, Israel, Singapore, Pakistan in descending order of the number of works.
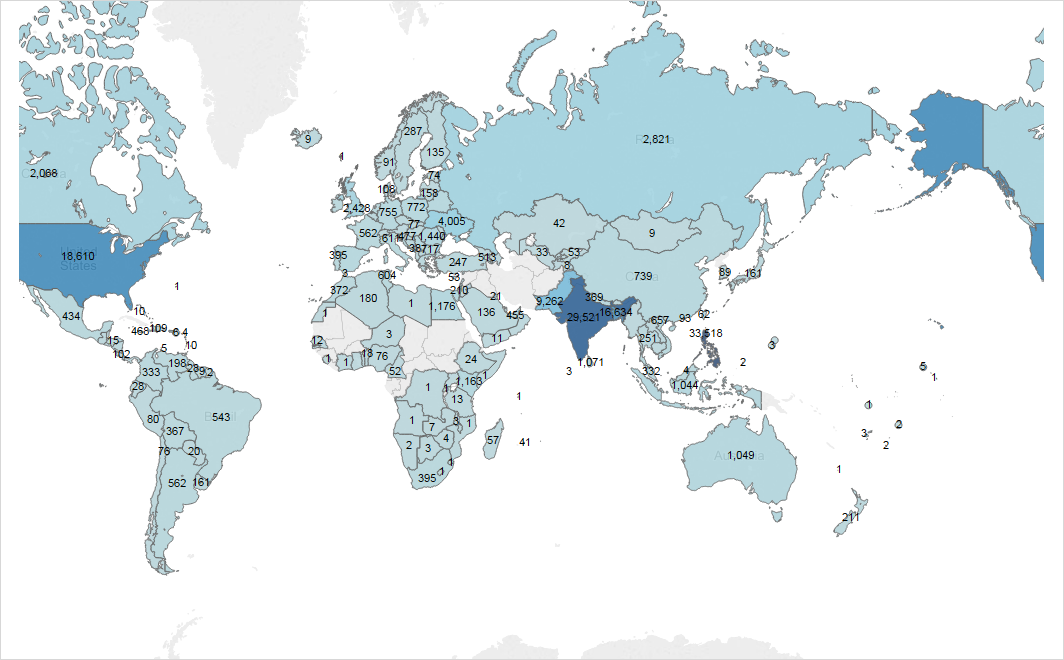
The following picture shows the countries with the most freelancers. The top 10 countries in descending order of total number of employees are as follows: Philippines, India, USA, Bangladesh, Pakistan, Ukraine, Russia, UK, Canada, Romania.
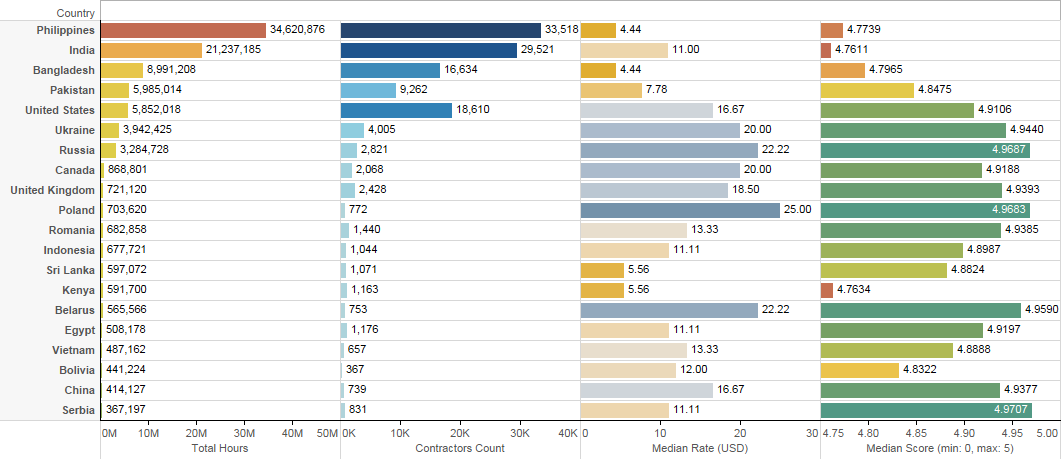
The following picture shows the top 20 countries by the total number of hours worked by freelancers in that country. Accordingly, the first column of the table shows the total number of hours, the second number of freelancers themselves, the third - the amount of hourly pay in US dollars, and the fourth rating of workers, which can take values from 0 to 5 (higher rating means that clients were more satisfied with the results of the work). It is worth noting that for the level of hourly rates and ratings, the median was calculated as a more representative indicator compared to the average value. Another thought was to consider the arithmetic mean weighted, and to use the total number of hours worked as weights, but I like this idea a little less than the median, as it reflects the recent changes poorly. For example, if over the past six months there have been many new freelancers who work well and have a good rating, but have not yet managed to build up many hours, their rating will not be taken into account properly.
What is more in demand and what is not needed at all
As described at the beginning, data was collected on the basis of the skills and skills indicated in the job description, which the freelancers themselves indicate. Now, based on this, we will try to conduct a small analysis of supply and demand.
We will exclude some of the data from further consideration - these are the skills of freelancers for whom there is no demand. For example, I am good at dancing, but I don’t understand at all how freelancers are going to sell this skill on oDesk. What is funny, 420 freelancers indicated the ability to dance in their profiles, but it is quite predictable that the number of jobs requiring this skill is zero. In addition to dancing, sambo, mambo or baking skills are also quite often indicated.
The data with the missing sentence looks a bit more interesting, mainly knowledge of languages: Norwegian (56 works), Bengali (16) and Latvian (15) and other languages. In general, we can say that for the rest of the client requests there are performers with the necessary skills.
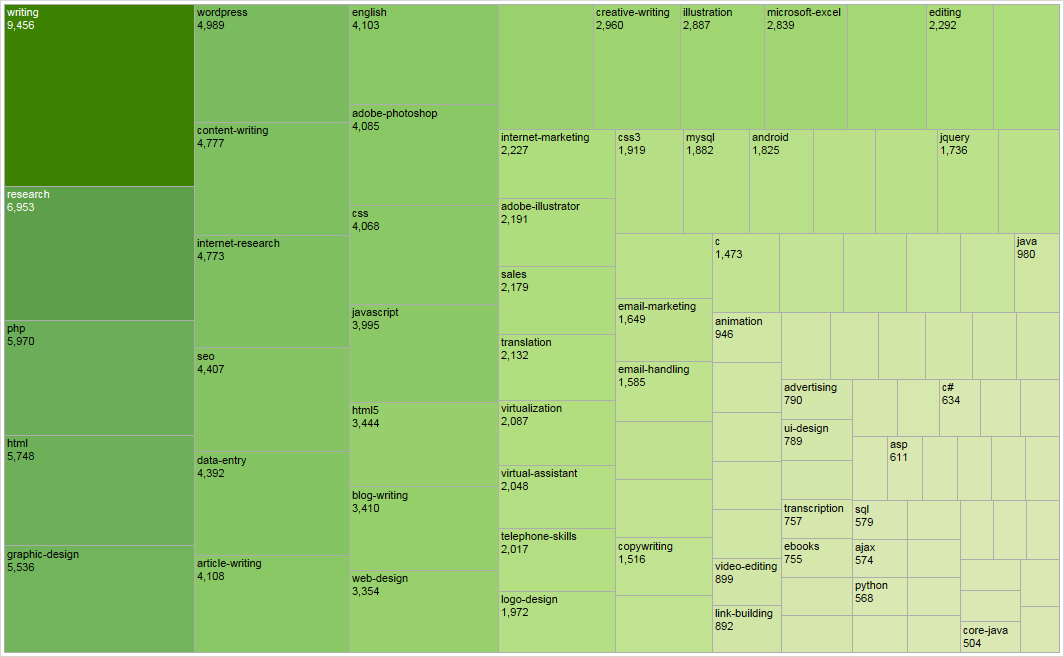
The following picture provides a visual demonstration of the 100 most requested skills (which is about 5% of the total number of skills, including discarded due to lack of demand or supply) encountered in the job descriptions. Digital values correspond to the absolute value of the number of jobs in which the skill occurs.
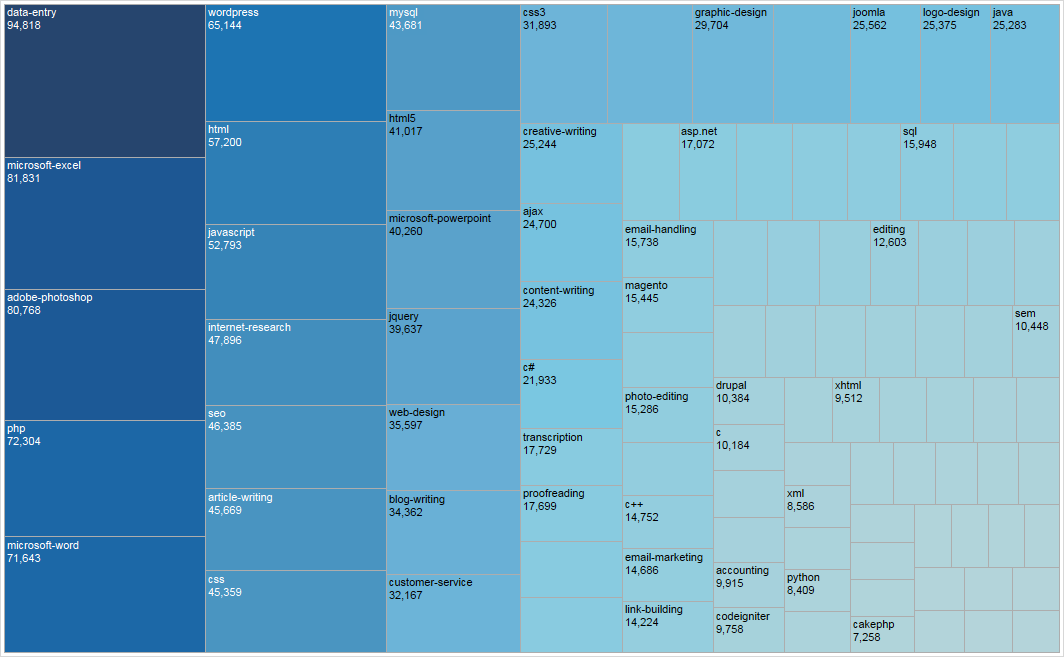
The following picture shows the 100 most common skills in the profiles of freelancers (designations are similar to those used above).
It is logical that the skill is of interest, if the demand for it greatly exceeds the supply and at the same time the demand is also quite important. That is, the importance of the skill depends on two criteria:
- 1st criterion: the ratio of demand to supply.
- 2nd criterion: frequent occurrence of the skill in the requirements of customers. This criterion is based on the fact that if there are two skills A and B , A has 100 jobs (demand) and 1000 freelancers (offer), B has 200 jobs and 2,000 freelancers, then B will still be preferable for learning because of variety of jobs to choose from, despite the equal demand-to-offer relationship for both skills.
The proposed idea can be expressed by the following formula for skill assessment:

That is, more interesting skills are those with a higher R value.
The weighting factor α is introduced to be able to vary the significance between the 1st and 2nd criteria. If we try to achieve the same average significance of both criteria, then the coefficient α can be taken equal to the following value:

For a more detailed analysis of skills, it is necessary to focus on each subcategory separately, but now we will stop our choice on web programming. With the approach described above, the first 30 skills with the highest R value will be as follows (R values are plotted along the X axis):
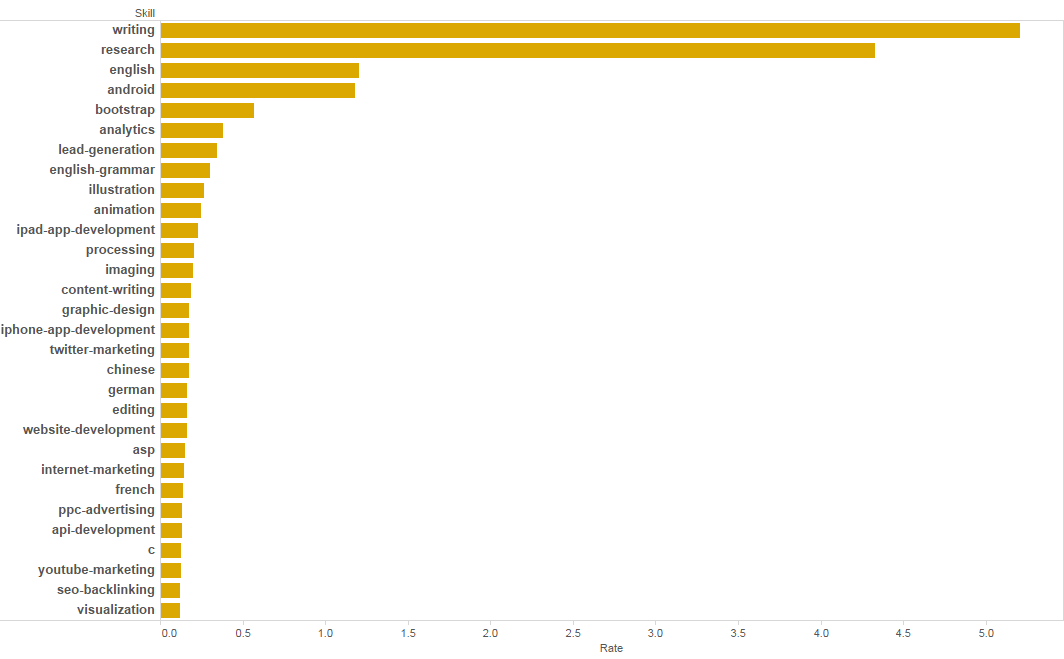
To be honest, such a result confuses me a little when I first consider it, since the listed skills relate to completely different things, something to frameworks, something to some abstract concepts, 5 out of 30 to knowledge of ordinary languages (English, Chinese, German, French (and even English grammar), 3 of 30 for mobile development for iOS and Android. In addition, the “Writing” skill of oDesk includes “Content Writing”, and “Technical writing”, and “Creative writing”, and “Article Writing”, and “Blog Writing”, and “Business Writing”, and “Editorial Writing ". The “research” skill is also quite extensive and implies both “Research” and “Internet research”, and “Market research”, and “SEO Keyword Research”, the “English” skill also predictably includes other skills, including the same ability to translate from English to other languages, by “Analytics” basically means “Google Analytics”, the skill “c” unfortunately means not only knowledge of the C programming language, but also C ++, C # and Objective- C.
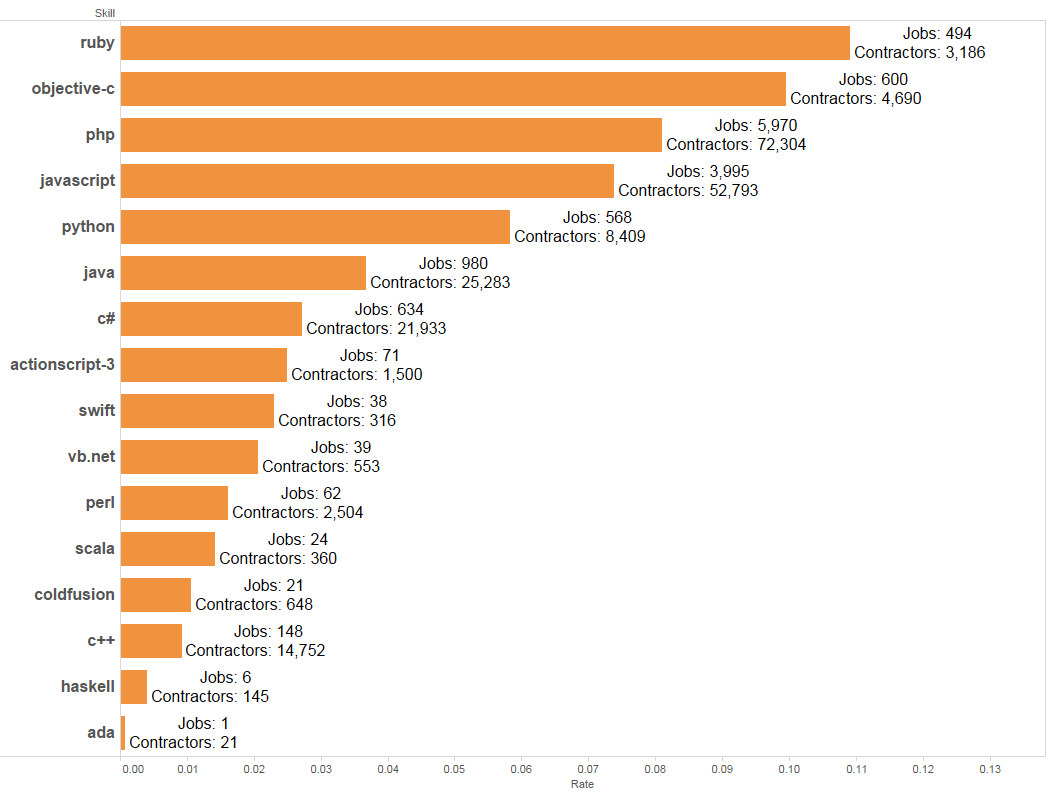
For some specificity, I decided to isolate from the general list of skills what is related to programming languages and apply the ranking described above to them, in the end we got the following (R values are also plotted on the X axis):
It may seem that the proposal greatly exceeds the demand, but it should be borne in mind that the data collected includes data on all freelancers (and those who previously worked, but simply did not delete their profile, and those who are currently employed, and those who are actively looking for new projects), but the works are shown only active at the moment and when the performer is found, they usually close, which does not allow to say exactly how many freelancers are really looking for a job at the moment.
Regarding the picture above, again, it is worth making a clarification, since it is clear that the C # language takes only 6th place in the ranking used, however, it is clear that ASP has hit the top 30 (or, to be more precise, this skill basically implies ASP) .NET or ASP.NET MVC), which is based on the use of the C # language or other languages included in the .NET Framework kit. But at the same time, technologies related to Ruby, PHP, JavaScript, Python, and Java, which overtake C #, did not make it to the top 30. Although on the other hand for other languages there is a greater variety of frameworks, unlike C #, for which the choice is not great. In general, all this only suggests the idea of conducting a separate analysis of technologies used, for example, to create web applications, or to compare other skills from a particular area. As another example, I compared the JavaScript library (I’ll say in advance that I’ve been sorting out my skills by hand, so I could miss something and would be grateful for the clarification):
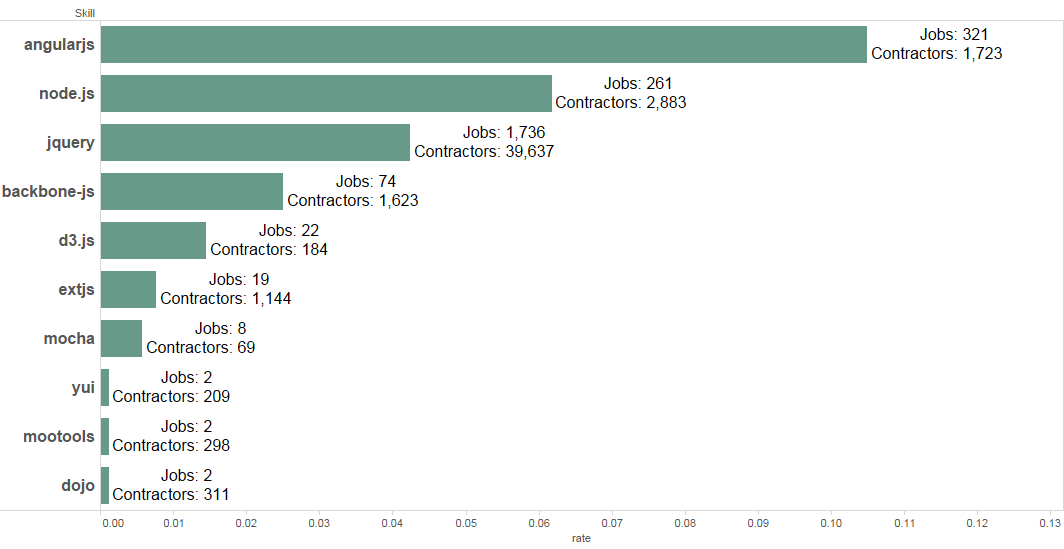
Well, as a last example, comparing CMS:
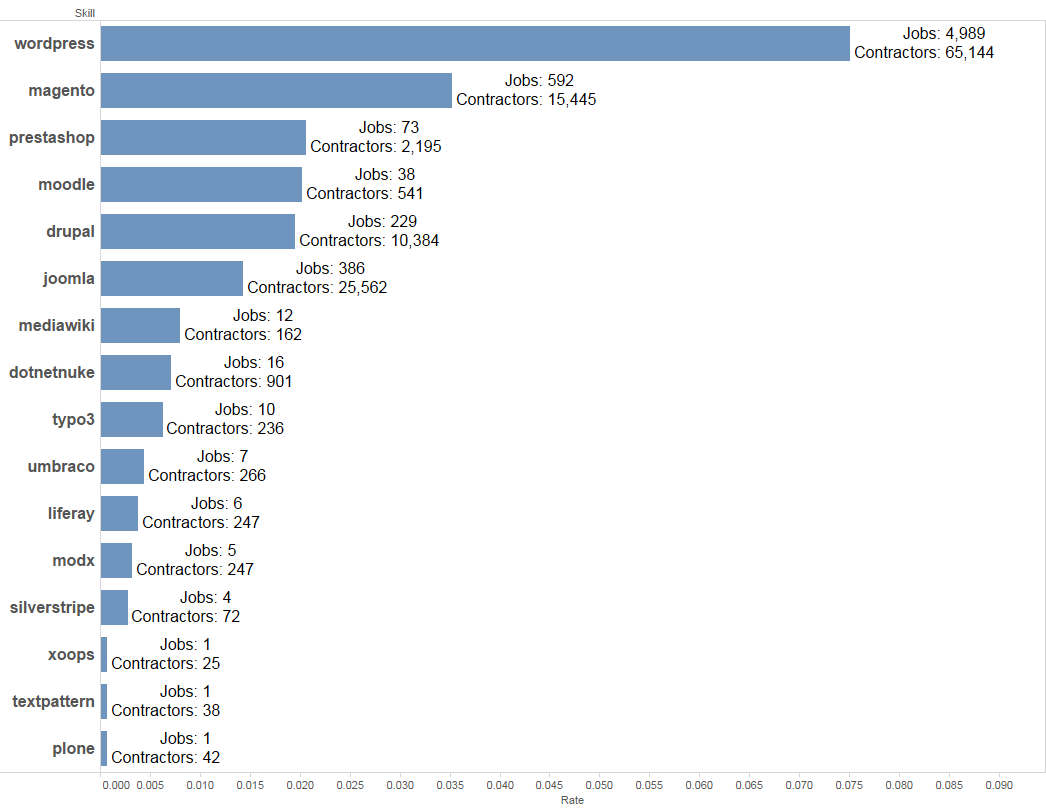
Of course, a general comparison of all skills is also of interest, but for the adequacy of the results, it is better to compare skills from one area, rather than knowing Chinese with the bootstrap knowledge, as it turned out a little higher (the bar graph with yellow colors and top 30 skills).
Conclusion
During the analysis, some difficulties arose. For example, the fact that the API when searching for skills does not perform an exact search, but something like a search for a substring, which leads to C # or Objective-C when searching C, although these are different programming languages used for completely different tasks. There is no desire to check all 2500 skills manually, so I can’t say for sure how many such inaccuracies in the API work.
In addition, the analysis affects the data only at the time of writing the article and does not take into account the trends that would allow us to say, for example, the demand / supply for which programming languages is increasing, and which is falling on the oDesk exchange.
If this topic is interesting, I will think about clarifying the data collection and the method of analyzing trends.
Source: https://habr.com/ru/post/240979/
All Articles