Performance testing popular (and not so) CMS
Greetings to you, habrazhitel! When developing FFCMS for my projects, one of my main goals was to highlight the fast speed of work and the minimum consumption of equipment resources - however, all values can be estimated only by comparison, which I will try to do in this article.
In my last post, some users asked about system performance and I decided to test various popular and young CMS as of October 18, 2014. It is worth noting that the system was tested immediately after its installation and the data can change significantly in one direction or another depending on the period of use of the system - database increase, number of files and other conditions.
Foreword
Before conducting such a test, I wanted to look at the results of similar tests — after all, they were most likely already conducted before me. However, to my disappointment, I could not find a single comprehensive test that would compare at least 3 or more systems by many criteria (maybe I was looking bad?). This is surprising, since dozens (or even hundreds) of thousands of webmasters, programmers and large companies use popular CMS - doesn’t the question of the resources consumed by the system interest anyone at all?
')
Test objects
For testing, I chose a number of currently popular systems, both commercial and free. Were selected 10 systems, below are their names and used versions:
- Bitrix standart - 14.5.0
- WordPress 4.0
- Drupal 7.32
- Joomla! 3.3.6
- Umi.cms 2.9.7
- FFCMS 2.0.3
- InstantCMS 2.1.1
- KodiCMS 12.20.37 (master)
- NetCat Standart 5.4
- HostCMS. Halyava 6.1.6
For paid systems, demos have been selected that can be downloaded from the creators site.
Testing method
In order for the test result to be homogeneous for all products, a virtual machine was created on which a web server, database and other necessary testing software was installed. As a stand used:
- Apache 2.2.27;
- PHP 5.3.28;
- MySQL Community Server 5.5.38-log;
- PHP modules: Zend Engine v2.3.0 (no opcache, xcache, acp, eaccelerator);
- Apache benchmark Version 2.3.
* UPD: a second test was also conducted for php 5.5 with OPCache enabled as critics requested in the comments - its result is proportional to the main test. The results are shown in the last section.
Each CMS was installed in the virtual environment of the stand, after which several lines were added to its code (most often index.php), which allowed saving the result about the script execution time and the amount of memory consumed:
$_test_loadstart = microtime(true); // CMS $_test_loadend = microtime(true); $_test_loadtime = number_format($_test_loadend - $_test_loadstart, 3); $_test_memory = number_format(memory_get_usage()/1048576, 3); file_put_contents($_SERVER['HTTP_HOST'] . '.txt', $_test_loadtime . ';' . $_test_memory . "\n", FILE_APPEND); As a result, a domain.local.txt file was obtained at the output, which contained data on the script loading time and RAM consumption.
To create requests for the site, ab (Apache benchmark) was used without creating parallel requests - the goal was not to test apache, the goal was to get average results for each CMS:
ab -n 1000 http://domain.local/ > ~/bench/ab/domain.local.txt Results Evaluation Methodology
A total of the above described testing technology was assessed in the following sections:
- Descriptive rating (Basic) - distribution size, number of files, size and characteristics of the database
- Script download speed rating (phpload_time)
- Estimation of the size of consumed RAM (phpload_memory)
- Evaluation of Apache benchmark test results (apache_benchmark)
In each section of testing for each CMS, marks were given (-2 <= x <= +2) depending on the results obtained (personal) and average (avg) of the entire sample:
- -2 - the worst result in this test
- -1 - the result is worse than the average in this test
- +0.5 - the result is close to the average within standart devination
- +1 - the result is better than the average in this test
- +2 - the best result in this test
According to the results of testing in all categories for all the criteria, the resulting table was compiled, which shows the total results for all tests.
* I would also like to dwell on 1 point - when testing, UMI.CMS showed exorbitant loading speed results, therefore its results were excluded from the AVG calculation in some test categories.
Testing
Once we have become familiar with the material and testing methodology, we will proceed directly to the testing itself. Below are the final results for each of the categories of testing.
Test results in a convenient format: Google spreadsheet
Results for PHP 5.5 with OPCache (proportional to main): Google spreadsheet .
Descriptive evaluation
| Test / CMS | Bitrix | Wordpress | Drupal | Joomla | Umi.CMS | FFCMS | InstantCMS | KodiCMS | Netcat | HostCMS | Avg | MIN | MAX |
| Installed size (MB) | 191 | 18.5 | 11.7 | 20.1 | 105 | 18.9 | 11.9 | 23.4 | 98.4 | 17.5 | 51.64 | 11.7 | 191 |
| File count | 29908 | 1175 | 1074 | 5267 | 7128 | 1682 | 1650 | 3009 | 6391 | 2919 | 6020.3 | 1074 | 29908 |
| Mysql table count | 241 | eleven | 74 | 68 | 97 | 22 | 84 | 33 | 155 | 114 | 89.9 | eleven | 241 |
| Mysql table rows | 21918 | 126 | 1421 | 461 | 14616 | 187 | 12587 | 46 | 31467 | 20302 | 10313.1 | 46 | 31467 |
| Mysql database size (MB) | eleven | 0.56 | 4.6 | 3.9 | 6.2 | 0.356 | 6.8 | 0,948 | 2.7 | 1.9 | 3.8964 | 0.356 | eleven |
| SUMMARY POINTS | -9 | 6 | five | 5.5 | -five | 6 | one | 6 | -four | one |
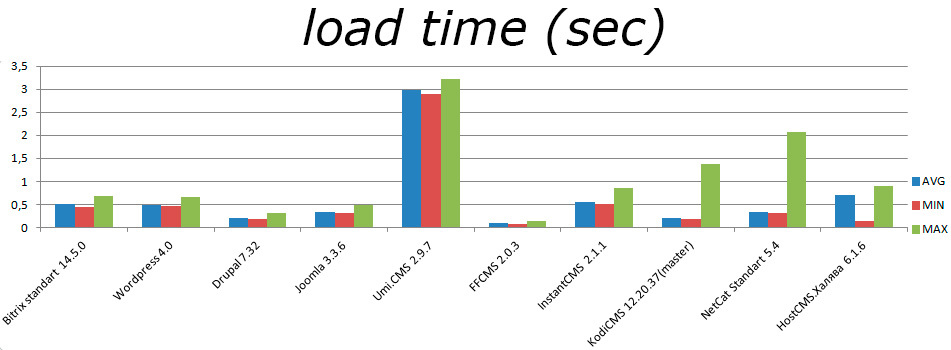
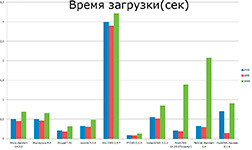
Script download speed rating
| Test / CMS | Bitrix | Wordpress | Drupal | Joomla | Umi.CMS | FFCMS | InstantCMS | KodiCMS | Netcat | HostCMS | Avg | MIN | MAX |
| AVG loadtime (sec) | 0.50 | 0.497733 | 0,210623 | 0.325381 | 2.99 | 0.090089 | 0.548239 | 0,213725 | 0.3279 | 0.70523 | 0.38 | 0.09 | 0.71 |
| MIN loadtime (sec) | 0.45 | 0.467 | 0.19 | 0.305 | 2.9 | 0.083 | 0.518 | 0.194 | 0,304 | 0.144 | 0.30 | 0.08 | 0.52 |
| MAX loadtime (sec) | 0,69 | 0.661 | 0.317 | 0.489 | 3.218 | 0.135 | 0.851 | 1,387 | 2.076 | 0.91 | 0.83 | 0.14 | 2.08 |
| SUMMARY POINTS | -one | -one | 3 | 2.5 | -6 | 6 | -2.5 | one | -four | -2 |
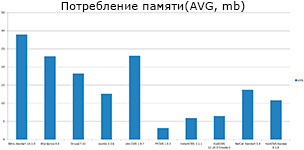
Estimation of the size of consumed RAM
| Test / CMS | Bitrix | Wordpress | Drupal | Joomla | Umi.CMS | FFCMS | InstantCMS | KodiCMS | Netcat | HostCMS | Avg | MIN | MAX |
| AVG memory (mb) | 28,944115 | 22,992 | 18,144003 | 12,556 | 23,089791 | 3.181 | 5,953808 | 6,485019 | 13,696 | 10,789239 | 14.5830975 | 3.181 | 28,944115 |
| MIN memory (mb) | 28,942 | 22,992 | 18,144 | 12,556 | 22,784 | 3.181 | 5,951 | 6,485 | 13,696 | 4.213 | 13.8944 | 3.181 | 28,942 |
| MAX memory (mb) | 29,177 | 22,992 | 18,147 | 12,556 | 23,095 | 3.181 | 6,885 | 6.504 | 13,696 | 10,848 | 14.7081 | 3.181 | 29,177 |
| SUMMARY POINTS | -6 | -3 | -3 | 3 | -3 | 6 | 3 | 3 | 3 | -one |
Apache rating benchmarks
| Test / CMS | Bitrix | Wordpress | Drupal | Joomla | Umi.CMS | FFCMS | InstantCMS | KodiCMS | Netcat | HostCMS | Avg | MIN | MAX |
| Time taken for tests (sec) | 527,433 | 520,498 | 230.91 | 340,219 | 13,032.86 | 97,178 | 555,886 | 224,176 | 343,965 | 727,217 | 396,3868889 | 97,178 | 727,217 |
| Complete requests | 1000 | 1000 | 1000 | 1000 | 1000 | 1000 | 1000 | 1000 | 1000 | 1000 | 1000 | 1000 | 1000 |
| Failed requests | 965 | 0 | 0 | 0 | 697 | 0 | 0 | 0 | 0 | 955 | 213,3333333 | 0 | 965 |
| Requests per second (# / sec) | 1.9 | 1.92 | 4.33 | 2.94 | 0.08 | 10.29 | 1.8 | 4.46 | 2.91 | 1.38 | 3.547777778 | 1.38 | 10.29 |
| Time per request (ms) | 527,433 | 520,498 | 230.91 | 340,219 | 13032,857 | 97,178 | 555,886 | 224,176 | 343,965 | 727,217 | 396,3868889 | 97,178 | 727,217 |
| Transfer rate | 69.51 | 14.9 | 32.99 | 28.61 | 2.28 | 105.48 | 92.36 | 13.33 | 31.74 | 23.98 | 45,87777778 | 13.33 | 105.48 |
| SUMMARY POINTS | -four | -2 | four | 2 | -12 | ten | 0 | four | 2 | -6 |
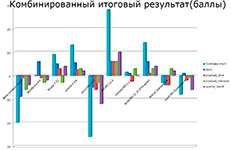
Final results
| Test / CMS | Bitrix | Wordpress | Drupal | Joomla | Umi.CMS | FFCMS | InstantCMS | KodiCMS | Netcat | HostCMS |
| Basic | -9 | 6 | five | 5.5 | -five | 6 | one | 6 | -four | one |
| phpload_time | -one | -one | 3 | 2.5 | -6 | 6 | -2.5 | one | -four | -2 |
| phpload_memory | -6 | -3 | -3 | 3 | -3 | 6 | 3 | 3 | 3 | -one |
| Apache benchmark | -four | -2 | four | 2 | -12 | ten | 0 | four | 2 | -6 |
| SUMMARY RESULT | -20 | 0 | +9 | +13 | -26 | +28 | +1.5 | +14 | -3 | -eight |
Test results
Now it's time to sum up the results of our testing and briefly evaluate the result. All our results are from 0 to 2 sides: those that received a negative result, I would not recommend anyone to use at all if you value computing resources (this is just my personal opinion - I perfectly understand that the functionality of such systems can be much higher than others).
One of the important test results was also the fact that not a single open system received a negative evaluation , and all commercial products were below this level (+6 / -4 in favor of open source).
I would not like to draw any other conclusions; I will only provide you with the final plots of important tests, draw your own conclusions (all the pictures are clickable):
Afterword
I in no way wanted to offend anyone - I just provided the results of subjective testing of various CMS. You are always in the right to decide whether resource consumption is of great importance to you, perhaps more than the convenience of developing / managing the site.
Results in a convenient format: Google spreadsheet
Results for PHP 5.5 with OPCache (proportional to main): Google spreadsheet
Testing in plain-text: Pick up from Yandex.Disk
Source: https://habr.com/ru/post/240829/
All Articles