My cards on leaflet.js
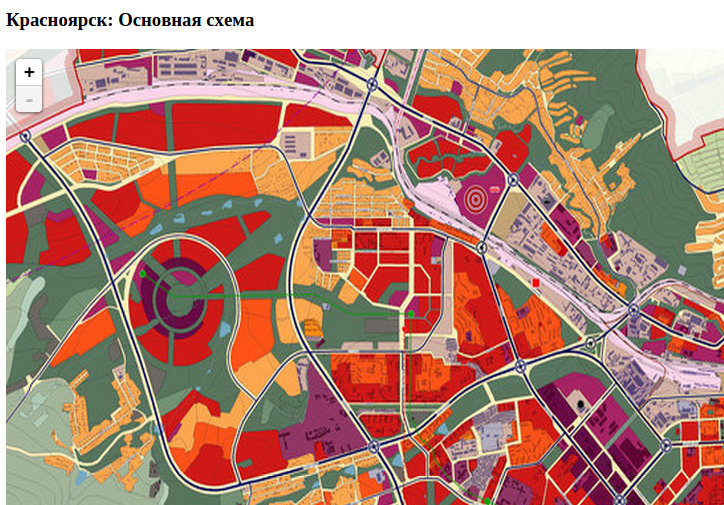
A Universiade is scheduled to take place in 2019 in the city of Krasnoyarsk, and therefore not only the administration of Krasnoyarsk is developing a master plan for the territorial development of the city until 2033. Recently, officials have laid out a master plan for the city administration’s site for public comment. But here's the ill luck: viewing and analyzing the schemes is inconvenient, because the files are large in size and resolution. For example, the main circuit file has a size of 43.34 MB and a resolution of 19256x16019px. My computer slows down when viewing such a picture.
Having a little scripted with my colleagues, we made an interactive map of antirek.imtqy.com/krskmap/main/index.html
')
Further a little more in detail, how to make your map on leaflet.js from a picture with high resolution.
Actions
1. Prepare layers. In order for the maps to be zoomed (zoom in), you need to make layers.
We make 4 layers (the first is the source file and 3 more with a decrease of half each)
2. Each layer is cut and put in separate directories.
Since I didn’t immediately find how to number files in rows and columns in the ImageMagick documentation, I had to do step 3.
3. Rename files from linear numbering to XxY grid
We throw a small php-script into the directory with files and, setting the number of files, all and the number of files that fit into one line of the image, we run.
4. We connect the leaflet.js script to the page, to which we indicate where to get tiles for our map.
Where the magic is {z}, {x}, {y}. {z} is the zoom level, here stands from 4 to 7, in such directories there are cuttings of tiles of each scale, 4 low detail level (the file that was compressed to 12.5%), then incrementally.
Here, perhaps, that's all. After that, the entire kitchen on working with the map is taken over by leaflet.js, beautifully zooming the map, allowing it to be moved with the mouse and arrows.
In the repository on the github github.com/antirek/krskmap are cutting the tiles of the main and transport schemes of the master plan for the territorial development of the city of Krasnoyarsk until 2033 with a total volume of 0.5 GB. From the gitkhab, the antirek.imtqy.com/krskmap/main/index.html map is also viewed.
PS An offer was sent to the administration of the city of Krasnoyarsk via the online reception to place this card or a link to it on the website of the city administration, registered under the VP-2014-005631 number of October 13, 2014.
Having a little scripted with my colleagues, we made an interactive map of antirek.imtqy.com/krskmap/main/index.html
')
Further a little more in detail, how to make your map on leaflet.js from a picture with high resolution.
Actions
1. Prepare layers. In order for the maps to be zoomed (zoom in), you need to make layers.
We make 4 layers (the first is the source file and 3 more with a decrease of half each)
$ convert bigdata.jpg -resize 50% bigdata_50.jpg $ convert bigdata.jpg -resize 25% bigdata_25.jpg $ convert bigdata.jpg -resize 12.5% bigdata_125.jpg 2. Each layer is cut and put in separate directories.
$ convert -crop 100x100 bigdata.jpg 7/%d.jpg $ convert -crop 100x100 bigdata_50.jpg 6/%d.jpg $ convert -crop 100x100 bigdata_25.jpg 5/%d.jpg $ convert -crop 100x100 bigdata_125.jpg 4/%d.jpg Since I didn’t immediately find how to number files in rows and columns in the ImageMagick documentation, I had to do step 3.
3. Rename files from linear numbering to XxY grid
We throw a small php-script into the directory with files and, setting the number of files, all and the number of files that fit into one line of the image, we run.
<?php $pieces_count = 2550; // - $pieces_count_on_row = 50; // -, , . for($i=0; $i <= $pieces_count; $i++){ $filename = (int)($i / $pieces_count_on_row); $filename .= 'x' . $i % $pieces_count_on_row; rename("{$i}.jpg","{$filename}.jpg"); } ?> 4. We connect the leaflet.js script to the page, to which we indicate where to get tiles for our map.
<div id="map" class="map"></div> <script> var map = L.map('map').setView([0, 0], 4); L.tileLayer('{z}/{y}x{x}.jpg',{ minZoom: 4, maxZoom: 7, attribution: '', tms: false }).addTo(map); </script> Where the magic is {z}, {x}, {y}. {z} is the zoom level, here stands from 4 to 7, in such directories there are cuttings of tiles of each scale, 4 low detail level (the file that was compressed to 12.5%), then incrementally.
Here, perhaps, that's all. After that, the entire kitchen on working with the map is taken over by leaflet.js, beautifully zooming the map, allowing it to be moved with the mouse and arrows.
In the repository on the github github.com/antirek/krskmap are cutting the tiles of the main and transport schemes of the master plan for the territorial development of the city of Krasnoyarsk until 2033 with a total volume of 0.5 GB. From the gitkhab, the antirek.imtqy.com/krskmap/main/index.html map is also viewed.
PS An offer was sent to the administration of the city of Krasnoyarsk via the online reception to place this card or a link to it on the website of the city administration, registered under the VP-2014-005631 number of October 13, 2014.
Source: https://habr.com/ru/post/240681/
All Articles