How to identify losses in sales
An example of data analysis based on a grocery store from Datawiz.io .
This article is about how to identify losses in sales. Losses in sales are days when the goods were not sold, or an abnormally low number of units of goods was sold.
')
Often, losses in sales occur due to an insufficient quantity of goods ordered. Also often the goods in stock are not displayed on the shelves. Daily data analysis helps to timely detect such a “failure” in sales. Next, we fix the problem - we control the work of the purchasing department, we optimize deliveries, we control the work of the sales staff.
How it works?
We will calculate sales losses for products that do not fall under the following conditions:
1. If less than 5 units of goods are sold daily.
2. If the number of days with zero sales is more than 30% for the period.
STEP 1
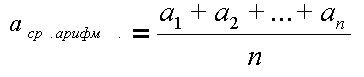
1. We calculate the average number of units sold for each product avg :
2. We consider the standard deviation ( std ) for each product:
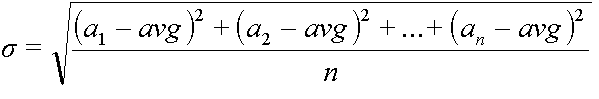
a - the number of units sold in each day of the period
n - the number of days in the period
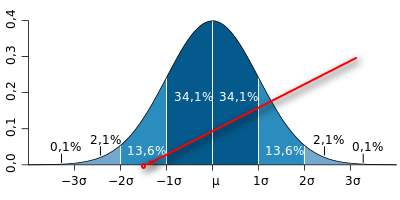
The probability that the sales of goods in the sales history, during the normal course of events, will be less than the average sales of this product minus the standard deviation of sales of goods multiplied by 1.5, is 6.68%.
STEP 2
To determine a loss-making day, we use two criteria:
- The quantity of goods sold is zero.
OR
- The quantity of goods sold is abnormally low
qty <avg - (std * 1.5)
qty - the number of units sold;
avg - arithmetic average sales for this product;
std is the standard deviation of sales for this product.
STEP 3
We calculate the number of undersold goods for each day with abnormally low sales:
lost_qty = avg - qty
Lost_qty - the quantity of the goods not sold for one unprofitable day;
avg - arithmetic average sales for this product;
qty - the number of units sold for one unprofitable day.
STEP 4
The final formula for calculating sales losses for a selected period (month) is as follows:
lost_sales = sum (lost_qty) - the sum of quantitative losses on all days with abnormally low and zero sales for the selected period.
To calculate the loss by turnover , the resulting quantity of "undersold" (or lost) goods multiplied by the average price of this product. After analyzing each product separately, you can track how much the store lost in circulation over the period.
For a store with 15,000 items (SKU) damage can be on average 40-80 thousand UAH. per month.
Analysis of losses in sales on a real example.
We perform calculations for the product "Toast Bread" for the period from 01/01/2013. on January 31, 2013:
STEP 1
Average arithmetic sales avg = 36 pcs / day
Standard deviation std = ~ 20.7 pcs.
STEP 2
We substitute the obtained data into the avg - (std * 1.5) formula: 36 - (20,71,5) = ~ 5. This means that if sales are less than 5pcs. per day (qty <5), then this day is “unprofitable”.

STEP 3
Having analyzed the data for the month, we get 4 lost days:
January 20 - the day with the sale of 1pc. (qty = 1). To calculate the losses on this day, we use the formula lost_qty = avg - qty. lost_qty = 36-1 = 35pcs
11.01; 13.01; 1/19 - days with zero sales (qty = 0). lost_qty = avg - 0. lost_qty = 36–0 = 36pcs.
STEP 4
Calculate the total number of losses on sale for the period:
lost_sales = sum (lost_qty)
lost_sales = 35 + (3 * 36) = 143pcs .
This is the amount of goods that the store could sell, but for one reason or another, the goods were not on the shelves. With an average price of "Toast Bread" 3.83, we get a loss in turnover - UAH 548.50.
Such simple mathematical calculations allow for daily analysis and timely response to changes in sales dynamics.
It is also a convenient tool to control the work of staff and increase the profitability of the store without additional investments.
Source: https://habr.com/ru/post/240511/
All Articles