Why and how to use data visualization?
Medical researchers have found that if the text of the instructions for the drug contains only text, a person learns from it only 70% of the information. If you add pictures to the instruction, the person will already learn 95%.
Our company has been developing and supporting data visualization tools for many years, covering a wide range of platforms and technologies. And this makes sense, because visualization tools have always been and remain in demand in the development market. And we know the reason for such popularity.
What is data visualization?
First of all, you need to know what data visualization is and what its methods are used, including in everyday life.
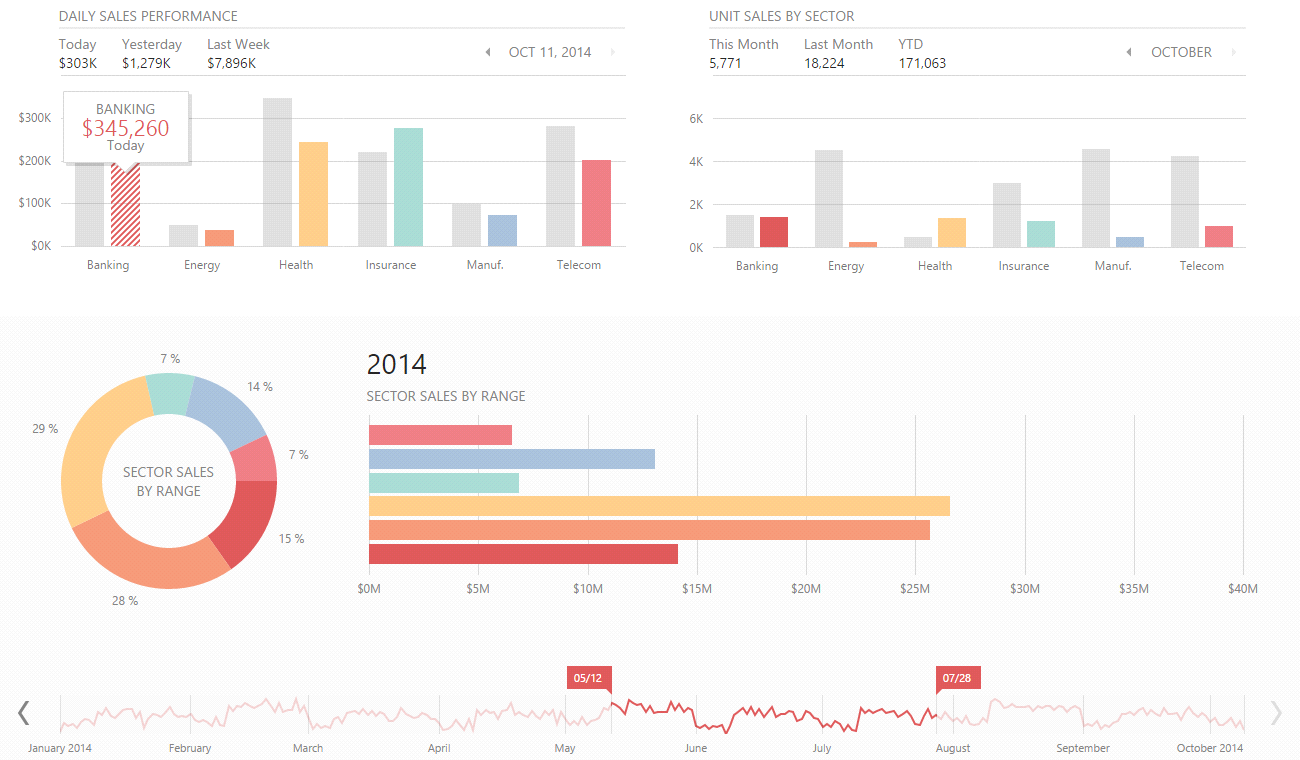
The simplest, and therefore the most common visualization methods, are graphics.
')
Data visualization is a visual representation of arrays of various information. There are several types of visualization :
- The usual visual representation of quantitative information in schematic form. This group includes all well-known pie and line charts, histograms and spectrograms, tables, and various scatter plots.
- The data during visualization can be converted into a form that enhances the perception and analysis of this information. For example, a map and a polar graph, a time line and a graph with parallel axes, an Euler diagram.
- Conceptual visualization allows you to develop complex concepts, ideas and plans using conceptual maps, Gantt charts, graphs with minimal paths and other similar types of diagrams.
- Strategic visualization visualizes various data on aspects of the work of organizations. These are all sorts of diagrams of performance, life cycle and graphs of the structures of organizations.
- Graphically organize the structural information using pyramids, trees and data cards will help metaphorical visualization, a vivid example of which is the metro map.
- Combined visualization allows you to combine several complex graphs into one scheme, as in the map with the weather forecast.
Why use data visualization?
Visual information is better perceived and allows you to quickly and effectively convey to the viewer their own thoughts and ideas. Physiologically, the perception of visual information is fundamental to humans. There are numerous studies confirming that:
- 90% of the information a person perceives through sight
- 70% of sensory receptors are in the eyes
- about half of the neurons of the human brain are involved in the processing of visual information
- 19% less cognitive function of the brain is used when working with visual data; it is responsible for processing and analyzing information
- 17% higher performance of a person working with visual information
- 4.5% better remember the details of visual information
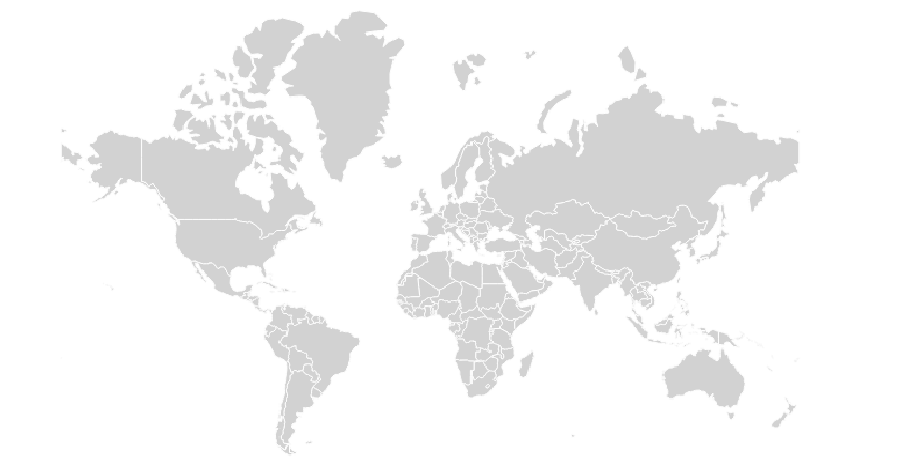
If you ask the reader to remember the names of the continents, this particular image will appear in your head.
- visual information is perceived 60,000 times faster than textual
On the chart, the reader will quickly find the minimum and maximum values.
- 10% of people remember from what they heard, 20% from what they read, and 80% from what they see and do
- 323% better a person performs an instruction if it contains illustrations

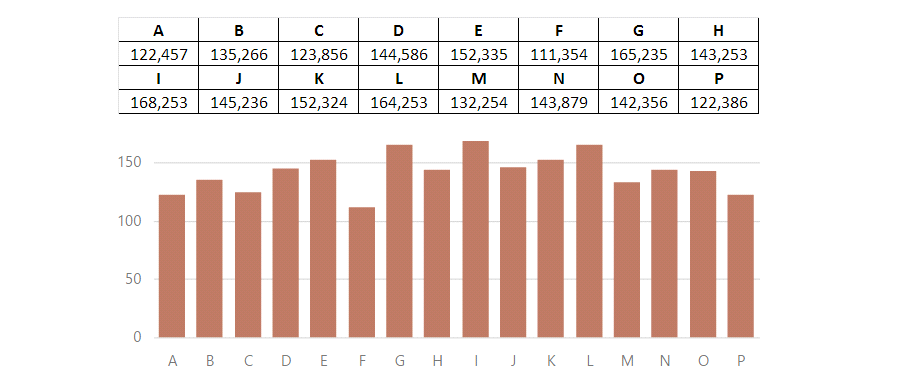
The instructions below are much easier and faster to understand and execute.
More information about the facts and research can be found in an interesting infographic here .
It is obvious that a person is predisposed to process exactly visual information. In addition to excellent processing by our brain, data visualization has several advantages:
- Focusing on different aspects of data
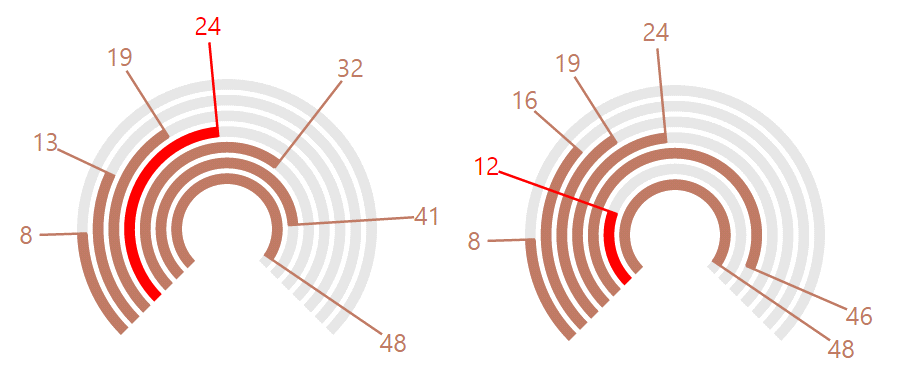
With the help of graphs, you can easily draw the reader's attention to red indicators.
- Analysis of a large data set with a complex structure
- Reducing information overload of a person and keeping his attention
- Unambiguity and clarity of the output
- Selection of relationships and relationships contained in the information

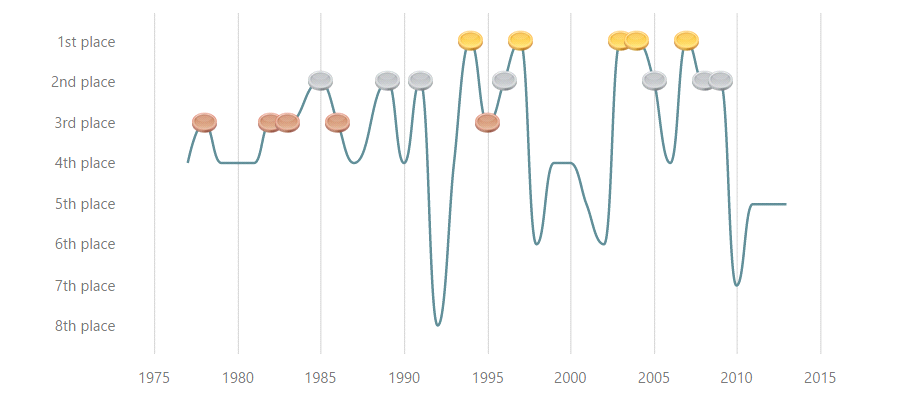
On the graph you can easily notice important data.
- Aesthetic appeal
Aesthetically attractive graphics make data presentation spectacular and memorable.
Edward Tufti , author of some of the best books on visualization, describes it as a tool for displaying data; encouraging the viewer to think about the essence, not the methodology; avoid distorting what the data must say; displaying many numbers in a small space; showing a large data set to be connected and unified; prompting the viewer to compare pieces of data; serving a reasonably clear purpose: description, study, ordering, or decoration (“The Visual Display of Quantitative Information”, Edward Tufte).
How to use data visualization correctly?
The success of visualization directly depends on the correctness of its application, namely on the choice of the type of graphics, its correct use and design.

60% of the success of visualization depends on the choice of the type of schedule, 30% - on its correct use and 10% - on its correct design
The correct type of chart
The graph allows you to express the idea that the data carries, most fully and accurately, so it is very important to choose the appropriate type of chart. The choice can be made by the algorithm:
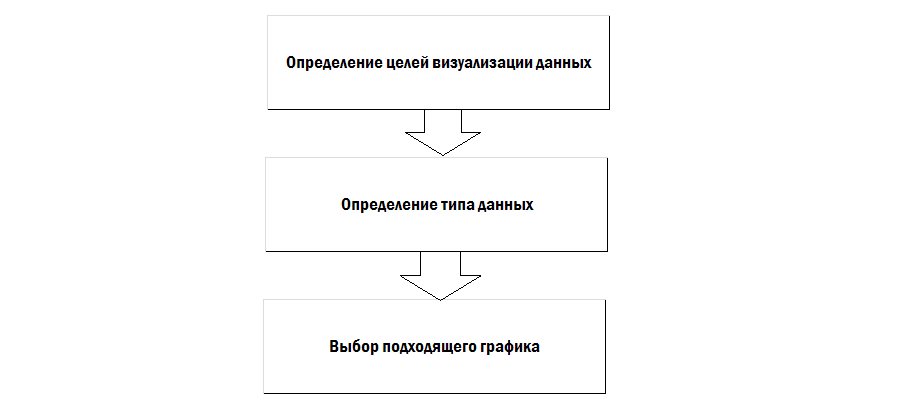
The goals of visualization are the implementation of the basic idea of information, this is what you need to show the selected data, what effect you need to achieve - identifying relationships in information, showing data distribution, composition, or comparing data.

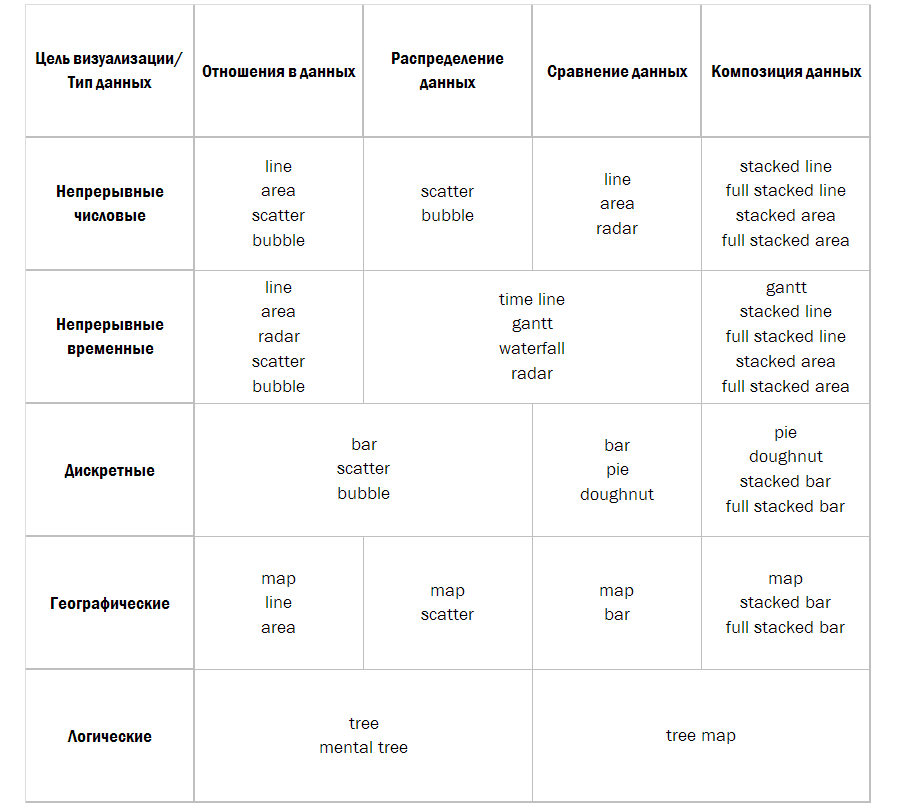
The first row shows graphs with goals for showing relationships on data and data distribution, and in the second row, goals are to show composition and compare data.
Relationships in data are how they depend on each other, the relationship between them. Using relationships, you can identify the presence or absence of dependencies between variables. If the basic idea of the information contains the phrases “refers to”, “decreases / increases with”, then it is necessary to strive to show precisely the relationships in the data.
The distribution of data is how it is located relative to something, how many objects fall into certain successive areas of numeric values. The basic idea will contain phrases “in the range from x to y”, “concentration”, “frequency”, “distribution”.
Composition of data - combining data to analyze the overall picture as a whole, comparing components that make up a percentage of a certain whole. The key phrases for the composition are “made up x%”, “share”, “percent of the whole”.
Comparison of data - combining data to compare some indicators, identifying how objects relate to each other. It is also a comparison of components that change over time. The key phrases for the idea when comparing are “more / less than”, “equal”, “changes”, “increases / decreases”.
After determining the purpose of visualization is required to determine the type of data. They can be very heterogeneous in their type and structure, but in the simplest case, they produce continuous numerical and temporal data, discrete data, geographical and logical data. Continuous numerical data contains information about how one numeric value depends on another, for example, graphs of functions, such as y = 2x. Continuous time data contain information about events that occur over a period of time, like a graph of temperature measured every day. Discrete data may contain dependencies of categorical values, for example, a graph of the number of sales of goods in different stores. Geographic data contains a variety of information related to location, geology and other geographic indicators, a vivid example is a regular geographic map. Logical data shows the logical location of components relative to each other, for example, the family tree of a family.

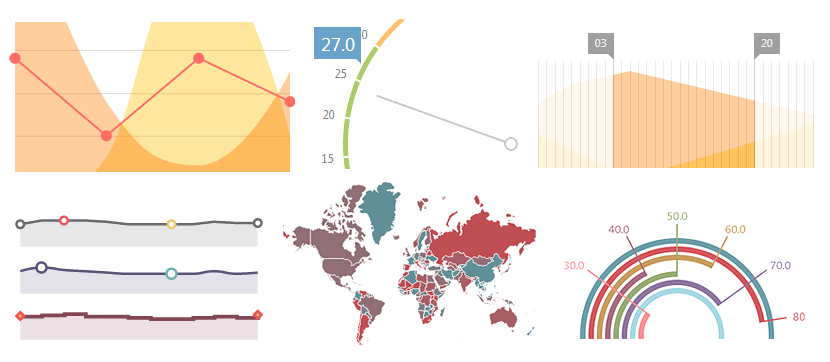
Graphs of continuous numerical and temporal data, discrete data, geographical and logical data
Depending on the purpose and data, you can choose the most suitable schedule for them. It is best to avoid diversity for the sake of diversity and to choose according to the principle “the simpler the better”. Only for specific data to use specific types of diagrams, in other cases, the most common graphs are well suited:
- linear (line)
- with areas
- columns and histograms (bar)
- pie chart (pie, donut)
- polar graph (radar)
- scatter plot (bubble)
- maps
- trees (tree, mental map, tree map)
- time diagrams (time line, gantt, waterfall).
Line charts, charts with areas and histograms can contain in the same argument for one category several values, which can be either absolute (then the prefixed prefix is added to such types of charts), or relative (full stacked).

Graph with stacked values and with full stacked
When choosing a suitable schedule, you can use the following table, compiled on the basis of this diagram and the book “Speak in the language of diagrams” by Jean Zelazny:
Proper use of graphics
It is important not only to choose the right type of graphics, but also to use it correctly:
- No need to load the schedule with a large amount of information. The optimal number of different data types, categories is no more than 4-5, otherwise it would be more expedient to divide such a diagram into several pieces.
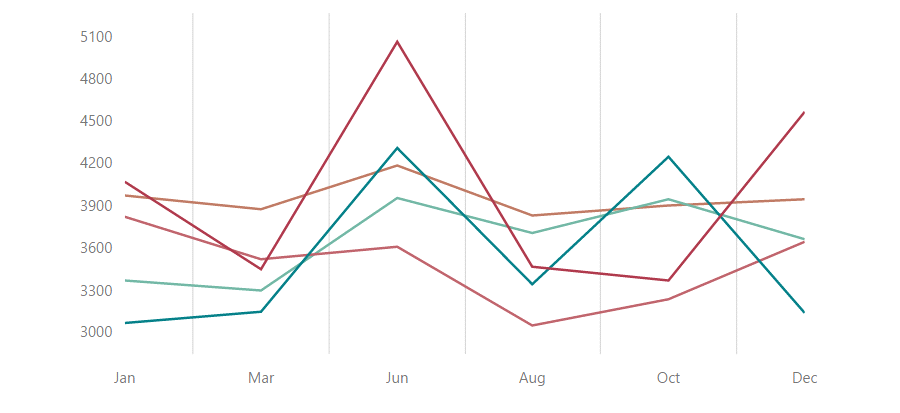
Such a graph can be compared with spaghetti and is better divided into several diagrams.
- Right to choose the scale and its scale for the schedule. For histograms and graphs with areas, it is preferable to start the scale of values from scratch. Try not to use inverted scales - this very often misleads the viewer about the data.
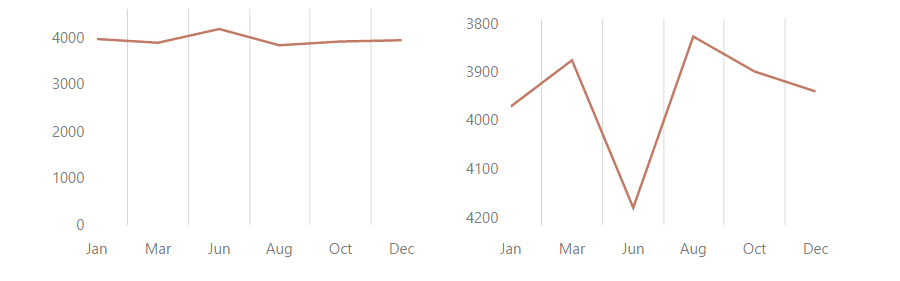
Invalid scale adversely affects data perception. In the first case, the scale is incorrectly selected, in the second the scale is inverted.
- For pie charts and graphs, where the percentage of the total share is shown, the sum of the values should always be 100%.
- For better data perception, it is better to arrange information on the axis - either by values, or alphabetically, or by logical meaning.
Proper design of the schedule
Nothing pleases the eye like properly designed graphics, and nothing spoils diagrams like the presence of graphic “garbage”. Basic design principles:
- use palettes of similar, not bright colors, and try to limit yourself to a set of six
- auxiliary and secondary lines should be simple and not conspicuous

Auxiliary lines on the graph should not distract attention from the main idea of the data
- where possible, use only horizontal labels on the axes
- for graphics with areas it is preferable to use a color with transparency
- use a different color for each category on the chart
findings
Visualization is a powerful tool for conveying thoughts and ideas to the end user, an assistant for perception and analysis of data. But like all tools, it must be applied in its time and place. Otherwise, information may be perceived slowly, or even incorrectly.
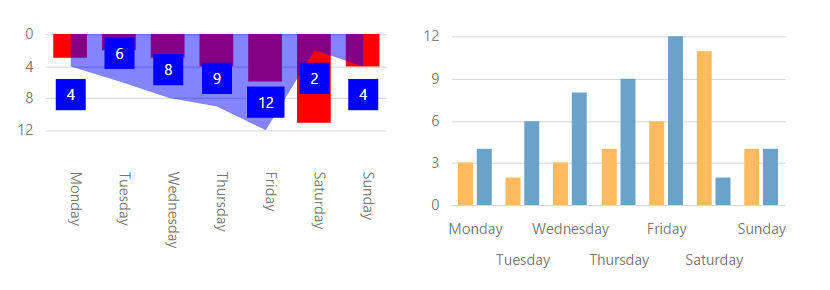
The graphs show the same data, the main visualization errors are shown on the left, and they are corrected on the right.
With skillful application, data visualization allows you to make the material impressive, not boring and memorable.
PS Graphs for the article were made using DevExtreme .
Source: https://habr.com/ru/post/240325/
All Articles