How do we cluster gifts in OK
Hello! My name is Arthur, I am an analyst in the data analysis section of the advertising technologies department of Mail.Ru Group. And I will try to talk about how we use clustering in our work.
What will not be in this article: I will not talk about clustering algorithms, about quality analysis or comparing libraries. What will happen in this article: I will show with an example of a specific task what clustering is (with pictures), how to do it if there is really a lot of data (REALLY a lot) and what is the result.
So, the task. Users of the social network OK.RU, as in many other networks, have the opportunity to give each other cute and not so good gifts. Since such gifts bring a certain profit, I would like to maximize it. One of the obvious ways to maximize is to build a good recommendation system.
')
What does this mean in the sense of gifts in OK.RU? N different gifts are given by M different users daily, and on holidays the number of gifts increases tenfold. Since N and M, as you probably guess, are extremely large - we use Hadoop to store and process this data.
It is obvious that the distribution of the number of donations to a gift, like many similar distributions, satisfies Zipf's law and, therefore, the donations matrix is extremely rarefied. In this regard, it is almost impossible to consider each gift separately for recommendations, which suggests clustering. I do not presume to say that clustering is the best or, the more so, the only true way, but I hope that by the end of the article you will understand why I like it.
Why generally clustering gifts and how to understand how gifts are similar? The answer to the first question is approximately as follows: when the place of an individual gift is occupied by a cluster of gifts, the number of gifts for each object increases and the number of such objects decreases. So more statistics and less dimension. There are a million answers to the second question, but I like one specific one: if the user presented two gifts, they are somewhat similar .

Behind the simplicity of this formulation lies everything that can be thought up about color preferences, personal interests, personal qualities and similar user characteristics. Of course, if you take one particular user and two of his gifts, it may well turn out that he gave one, because he loves cats, and the second, in the form of a skull, on the birthday of a biker-metalist friend. But when you have millions of users the likelihood of such a combination drops dramatically compared with two cats. In essence, the gift-user relationship forms a bipartite graph, one “share” of which we want to cluster.
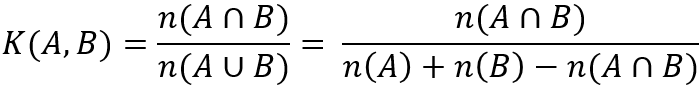
How to build a good measure on this? And everything is as usual - for us everything was thought up long ago, in this case, it was done by someone Paul Jacquard (eng. Paul Jaccard). Suppose we have A - a lot of users who gave the first gift and B - the second. Then the coefficient of similarity will be the formula:
In general, common similarity coefficients are not so few, but we are completely satisfied with this one. As soon as we have a "similarity" - it remains to choose a clustering algorithm. Many clustering algorithms require spatial interpretation of objects. So, for example, simple k-means should be able to calculate centroids. However, there are algorithms, and there are quite a lot of them, which have pairwise distances or, conversely, “similarities” between objects. Such algorithms include, for example, the generalization of k-means - k-medoids. On the Internet, of course, the mass of articles on clustering and finding the appropriate algorithm is not difficult.
In our case, one of the requirements was the availability of a ready-made library that allows working not only with “toy” datasets. In addition, we did not want to explicitly indicate the number of clusters, since we do not know in advance the number of "interests" of OK.RU users. As a result, the choice fell on the MCL about which you can read more here . Briefly: MCL receives a file as input, each line of which contains two identifiers of gifts and symbolism and writes clusters line by line in the output file as a list of identifiers.
On the library website you can read what other input data formats are available, as well as a list of clustering options. In addition, there is a description of the clustering algorithm itself and, importantly, a description of how to use MCL in R.
So, the solution looks like this:
And now, in fact, the pictures! Namely, examples of clusters obtained on real data. One picture - one cluster:
In my opinion, this simple story of one clustering gives a superficial idea of the power that lies behind the words "machine learning". After all, in fact, what do we have at the entrance? One simple fact that two gifts were given by the same user. What do we have at the exit? Clusters of gifts with such semantics, which not every moderator is able to distinguish. The scope of this data is obvious - this is a banal recommendation to users, and automatic tagging, and material for an article on Habr. And, let me be a little in the role of Captain Obvious, gifts can be replaced with domains, search phrases, shopping in a store or countries of tourist travel. If there is data, the main thing is not to be afraid to experiment.
What will not be in this article: I will not talk about clustering algorithms, about quality analysis or comparing libraries. What will happen in this article: I will show with an example of a specific task what clustering is (with pictures), how to do it if there is really a lot of data (REALLY a lot) and what is the result.
So, the task. Users of the social network OK.RU, as in many other networks, have the opportunity to give each other cute and not so good gifts. Since such gifts bring a certain profit, I would like to maximize it. One of the obvious ways to maximize is to build a good recommendation system.
')
What does this mean in the sense of gifts in OK.RU? N different gifts are given by M different users daily, and on holidays the number of gifts increases tenfold. Since N and M, as you probably guess, are extremely large - we use Hadoop to store and process this data.
It is obvious that the distribution of the number of donations to a gift, like many similar distributions, satisfies Zipf's law and, therefore, the donations matrix is extremely rarefied. In this regard, it is almost impossible to consider each gift separately for recommendations, which suggests clustering. I do not presume to say that clustering is the best or, the more so, the only true way, but I hope that by the end of the article you will understand why I like it.
Why generally clustering gifts and how to understand how gifts are similar? The answer to the first question is approximately as follows: when the place of an individual gift is occupied by a cluster of gifts, the number of gifts for each object increases and the number of such objects decreases. So more statistics and less dimension. There are a million answers to the second question, but I like one specific one: if the user presented two gifts, they are somewhat similar .
Behind the simplicity of this formulation lies everything that can be thought up about color preferences, personal interests, personal qualities and similar user characteristics. Of course, if you take one particular user and two of his gifts, it may well turn out that he gave one, because he loves cats, and the second, in the form of a skull, on the birthday of a biker-metalist friend. But when you have millions of users the likelihood of such a combination drops dramatically compared with two cats. In essence, the gift-user relationship forms a bipartite graph, one “share” of which we want to cluster.
How to build a good measure on this? And everything is as usual - for us everything was thought up long ago, in this case, it was done by someone Paul Jacquard (eng. Paul Jaccard). Suppose we have A - a lot of users who gave the first gift and B - the second. Then the coefficient of similarity will be the formula:
In general, common similarity coefficients are not so few, but we are completely satisfied with this one. As soon as we have a "similarity" - it remains to choose a clustering algorithm. Many clustering algorithms require spatial interpretation of objects. So, for example, simple k-means should be able to calculate centroids. However, there are algorithms, and there are quite a lot of them, which have pairwise distances or, conversely, “similarities” between objects. Such algorithms include, for example, the generalization of k-means - k-medoids. On the Internet, of course, the mass of articles on clustering and finding the appropriate algorithm is not difficult.
In our case, one of the requirements was the availability of a ready-made library that allows working not only with “toy” datasets. In addition, we did not want to explicitly indicate the number of clusters, since we do not know in advance the number of "interests" of OK.RU users. As a result, the choice fell on the MCL about which you can read more here . Briefly: MCL receives a file as input, each line of which contains two identifiers of gifts and symbolism and writes clusters line by line in the output file as a list of identifiers.
On the library website you can read what other input data formats are available, as well as a list of clustering options. In addition, there is a description of the clustering algorithm itself and, importantly, a description of how to use MCL in R.
So, the solution looks like this:
- We take a lot of events like U gave a gift P
- We count for each pair of gifts the number of users who donated both of them (wow the task, what do you think?). And also, the number of gifts of each gift.
- For each pair of gifts we calculate the Jacquard coefficient.
- The received data is fed MCL
- ...
- Profit !!! (could not resist, litter)
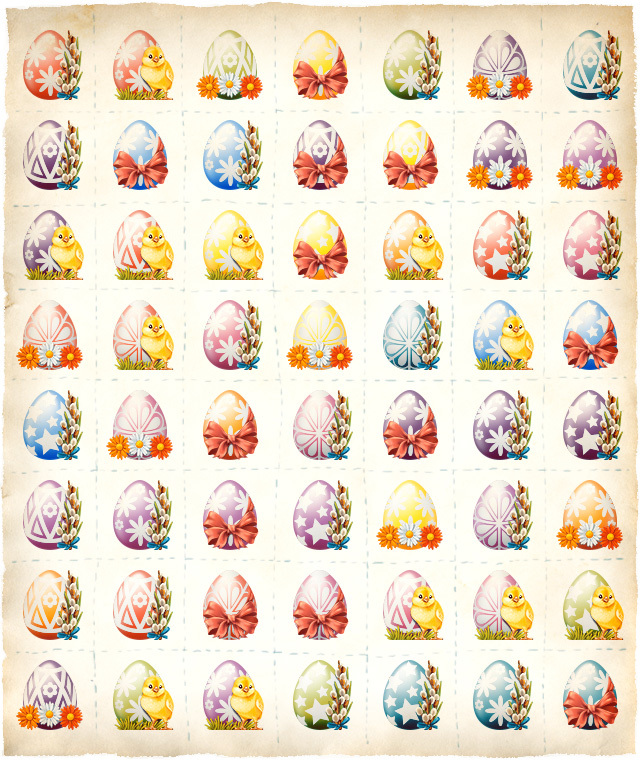
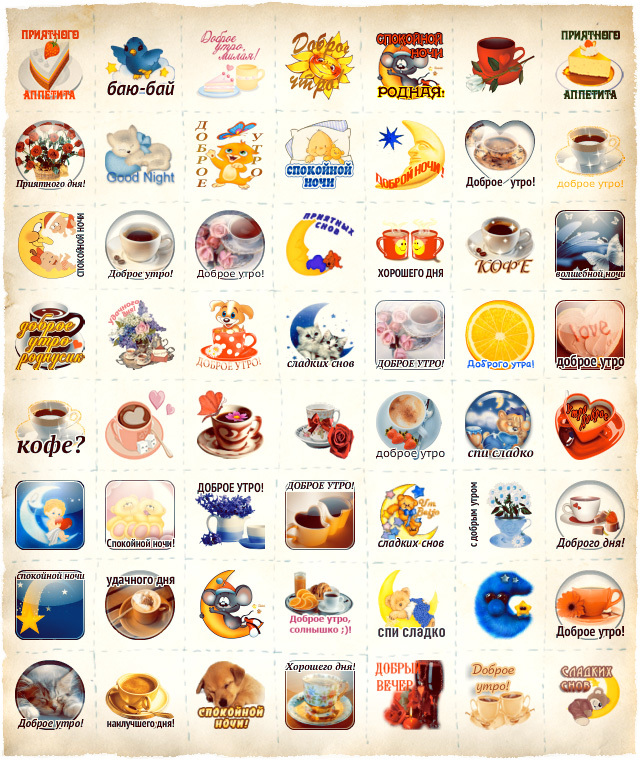
And now, in fact, the pictures! Namely, examples of clusters obtained on real data. One picture - one cluster:
flowers are different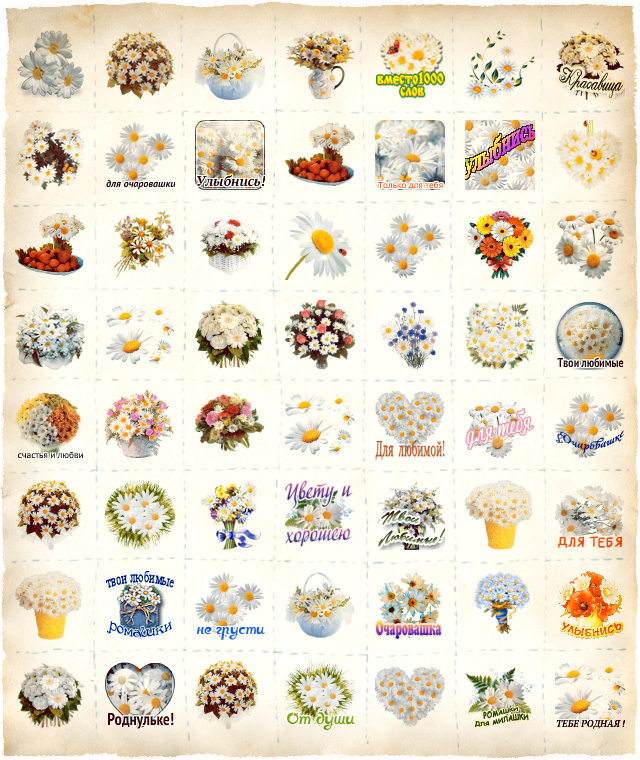

shoes and eggs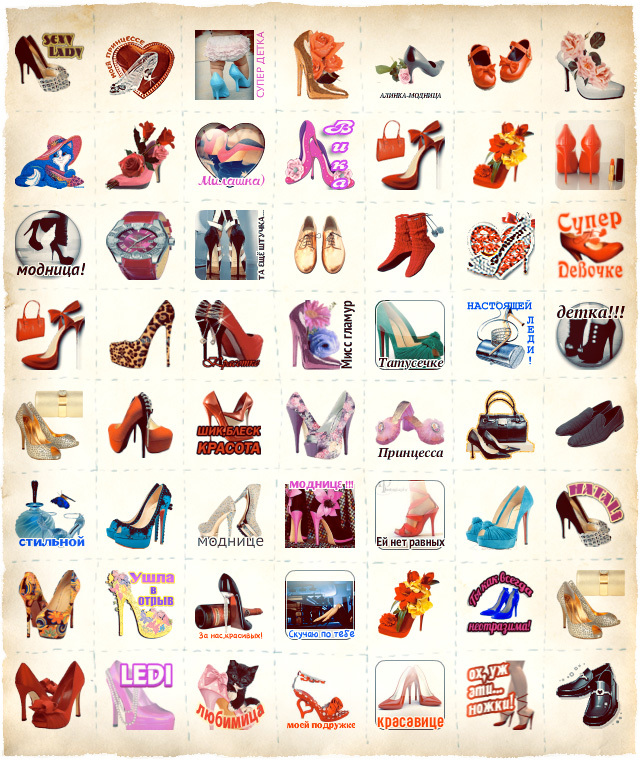
happy new year - go nafig
women and children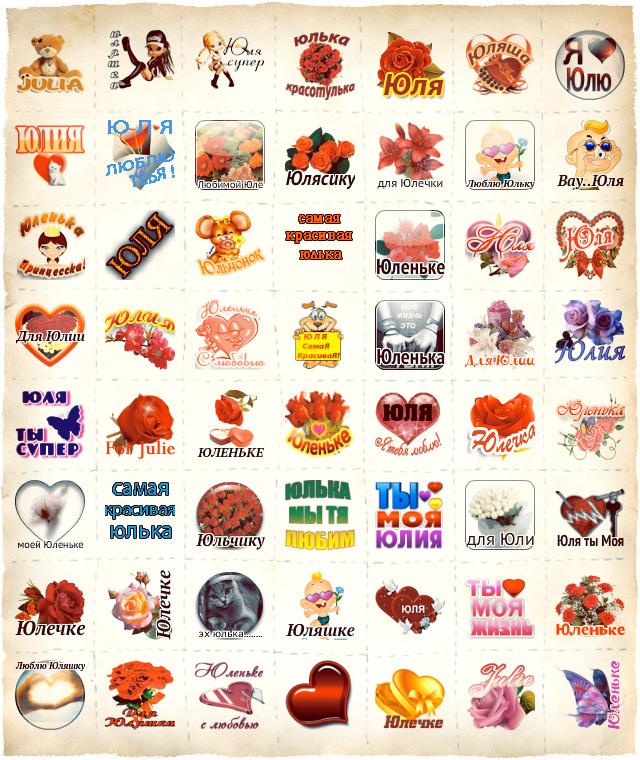
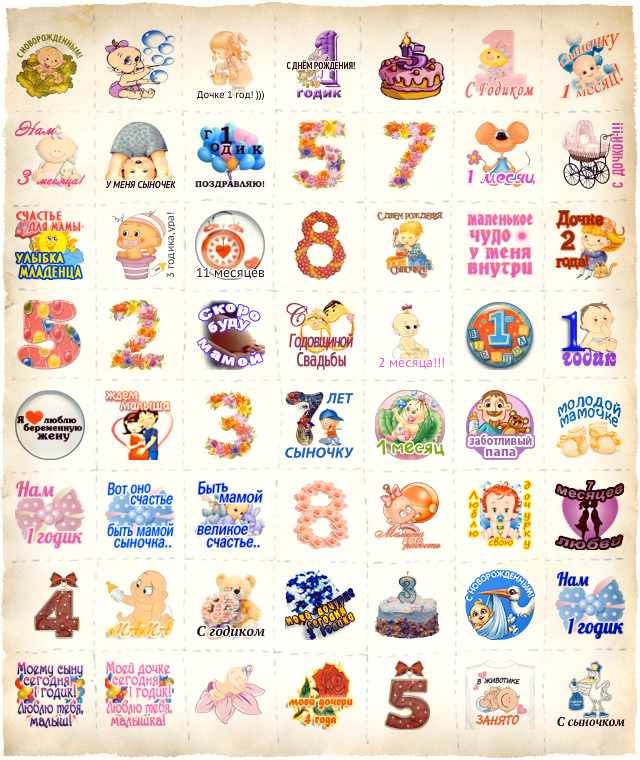
and even gifts with a curved signature!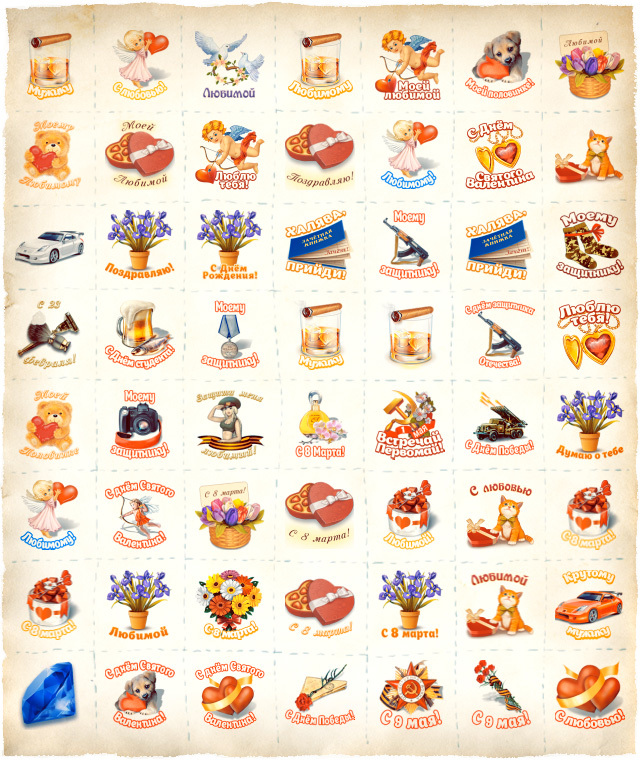
In my opinion, this simple story of one clustering gives a superficial idea of the power that lies behind the words "machine learning". After all, in fact, what do we have at the entrance? One simple fact that two gifts were given by the same user. What do we have at the exit? Clusters of gifts with such semantics, which not every moderator is able to distinguish. The scope of this data is obvious - this is a banal recommendation to users, and automatic tagging, and material for an article on Habr. And, let me be a little in the role of Captain Obvious, gifts can be replaced with domains, search phrases, shopping in a store or countries of tourist travel. If there is data, the main thing is not to be afraid to experiment.
Source: https://habr.com/ru/post/240213/
All Articles