How I patch Zabbix
The other day, I finally got around to updating Zabbix.
Since reading the article Zabbix 2.2 came out in the corresponding blog, I could not wait for Gentoo to unmask version 2.2. Practically there was no such innovation in this version that I would not be interested in and useful in “everyday life”. This monitoring of VMware, and system acceleration, and improvements in the LLDP, in short, almost every item.
Months passed, and version 2.2 was not even disguised.
')
Sometimes I put the routine aside and do something “parallel” with regard to urgent and important tasks and work. This time I remembered the desire to upgrade Zabbix to version 2.2.
Checked in masked *, well, finally, there is 2.2.5
All right, let's go, it's been a year since the release, the stable version doesn't exist, so whatever happens, we'll decide.
We unmask, collect wherever we need (the server and the proxy are the main ones, of course), restart. Reinstall the web interface iiii ...
And nothing, is updating the database.
The thing is not fast, my base is not small, and then the process is completely frozen.
Well, I think it started, as they say, they did not have time to start, but everything is already bad.
In the mysql logs there was an Error number 28 means 'No space left on device', there was more than enough space everywhere. As they say “in the presence of Google, I am godlike” (c), not immediately, but I managed to find / guess that this device is ibdata1 and ibdata2, the size of which is regulated by the innodb_data_file_path parameter. After I changed max from 256M to 512M, the database update was completed successfully and the server started.
The proxy also had problems, and also because of the database. Just sqlite is not updated, so stop the proxy, delete the old database and run the proxy. As they say read carefully Upgrade notes
Of course, during the update, a lot of overdue data has accumulated, so we check what we can check that everything is shown in the interface, and wait until everything is fixed and updated.
After a couple of hours, look at the schedule:

The day was starting to get languid.
We have a turn. From where? .. The main overdue data from one of the proxies. And what kind of data. And the data received by SNMPv3.
Fine. I had questions to this functionality before, but all hands did not reach, but there was hope that the update would resolve these issues. And then the system becomes practically inoperable. At one time, reading about how people using a single server or proxy monitor hundreds of network devices, I could not understand what was the matter? I have a few dozen devices, and everything works at the limit. Already, the DB is utterly optimized, and the server is set to a fast datastor, and a lot of memory has been given to it.
I didn’t want to roll back, so it was decided to try to deal with the problem by all means.
I chose one of the proxies, for which the most SNMP devices, and began to understand.
That's what we have in the logs on the proxy **:
And so randomly across all SNMP hosts, with different items.
I definitely do not have network problems, but to be sure, I of course quickly checked the connectivity, speed and logs of the switches. We check the SNMP itself using snmpwalk and we pull the whole tree. No problem.
Google Somebody got pollers, someone had incorrect timeouts, some bug related to this was fixed in version 2.2.3. Someone has a tricky network problem and lost UDP. But this is not our case.
What then? ..
An interesting fact, if you restart the proxy
That is seen as the queue starts to shrink, but then bang, something happens again and it instantly grows ***.
What is happening? ..
Enable extended logging on zabbix-proxy
DebugLevel = 4
Restart zabbix-proxy and wait for errors
Now, instead of Network Error, we see more complete information.
Status 1, error status -1, number of elements 94
Here is the conclusion that this is NETWORK_ERROR
And just below decoding Too long and deactivating the host. It is clear that if a host is deactivated, data cannot be obtained from it, data is queued, and that is the queue explanation.
Immediately interested in the parameter errstat
Make cat /var/log/zabbix/zabbix_proxy.log | grep errstat
Make cat /var/log/zabbix/zabbxi_proxy.log | grep errstat: -1
It's time to turn off monitoring of all devices for a proxy except one, because otherwise, the log is too difficult to understand. Anyway, the system in this form as it is now for monitoring is not suitable.
Disable, do
cat /var/log/zabbix/zabbxi_proxy.log | grep mapping_num
and restart the proxy
No mistakes at first, and mapping_num is slowly growing from 1 more and more (separate lines are cut to show the principle)
And then oppa 94, and -1 and too long. Those. Immediately after launching, the proxy tests the devices, sends them SNMP requests, increasing the number of items in one request. The queue starts to shrink quickly. Then he (I mean the proxy) reaches the magic number 94, it crashes and the devices begin to turn off with a zabbiks for 15 seconds, which in turn begins to dramatically increase the queue.
As you can see, here is not a Network error at all, here is Too long.
Okay, try to find something on zabbix snmp too long, nothing.
Again, timeouts, poller overload ... In one interesting post there was information that such an error occurred when the OID for the item was incorrectly formed, so I double checked all my OIDs, including through snmpget
Those. In the end, Google could not help me.
We will understand ourselves, this is useful.
So what do we have?
As soon as the number of items becomes 94 (i.e., large enough), something happens and the system gets lost.
Here again, the picture, which will not;)
It's time to climb into the code. In gentoo, you don’t need to download anything, everything is already there, so I just unpacked everything into a working directory.
We find first where the error is displayed. We are looking for errstat
Surprisingly, there are only two such places in the file with the talking title checks_snmp.c
these two places are:
from line 745
and from line 938
While we are interested in the second piece (assuming that the mapping_num is only in it)
Not even the programmer sees that we have a NULL response, and why? ..
Recall that with errstat: -1, which is now clear where it comes from, we have status: 1. Those. the snmp_synch_response function returns 1, but what does this mean? ..
And this means STAT_ERROR (1) (and she can also STAT_TIMEOUT (2) and STAT_SUCCESS (0))
As they say it is not clear, but great ...
Let's enter on the other hand, somewhere here in this file there should be a NETWORK_ERROR return. Let's try to figure out where and why.
The very first entry in the function zbx_get_snmp_response_error (which, as it were, hints)
Yeah. Those. we with our STAT_ERROR enter the switch where we do not fall under any of the above conditions, and thus we get NETWORK_ERROR by default.
We already understood that this default is disorienting us, we need to find out what kind of error it really is. The error code is stored in ss-> s_snmp_errno, we add the output of the variable to the log.
The programmer from me is so-so, so quickly with the help of scrap and someone's mother (s) slayap patchch, like this:
If the status is STAT_ERROR output ss-> s_snmp_errno
I threw the source of zabbiks into the local repository, quickly corrected the ebuild and forth.
Compile, restart, wait.
And here it is our real mistake.
Error -5
Enjoying Net-SNMP snmp_api.h
Something similar was seen in the logs, but according to the phrase Too Long we could not find anything, let's see what kind of error it is and when it occurs.
in snmp_api.c you can see it
There are only two options:
1. The length of the data we want to send is more than the msgMaxSize parameter defined in the received PDU
2. The underlying transport is not able to send a packet of this length.
There is a question how to fix this error. It follows from the above that we need to look for whether we get msgMaxSize, whether we process it correctly, etc. etc. But I see the zabbix source for the first time, and C in the second (well, ok for the third).
In short, it does not cause enthusiasm ... Yes, and perhaps you can break something.
Lyrical digression:
I must say that during the proceedings with this problem, I also stumbled upon the information about the SNMP mass processing. Those. zabbix can request multiple SNMP items in a single request.
SNMP bulk processing details
The bottom line is that zabbix can query up to 128 values in one request, but not all devices are able to process these 128 values at once. And zabbih uses the strategy of finding the maximum value for each specific device. We by the way saw it in the logs. Gradual increase mapping_num. As soon as zabbix receives an error from the SNMPERR_TOO_BIG device, it, using a specific algorithm, searches for the maximum value that returns results without errors.
What is it for me?
The overflow error handling mechanism (let's call it this way) in zabbiks is, you just need to expand it for one more case.
The algorithm itself is painted under the output of our error.
That is, everything is simple, we need to add our condition without disrupting the existing ones. For this we have all the data:
We also take into account that we have two such places (as well as two outputs to the log file) and the resulting patch will be like this:
Compile, restart ...
And here is the result:
Network Error Error disappeared from the logs.
Hooray!..
Of course, in reality, the search for errors and solutions took more time. I had to pick more sources and zabbix and net-snmp, in order to finally stop at two places in the code.
But the feeling of victory over "inert matter" is priceless.
* Desire rolled on October 7, and then 2.2.5 was still disguised. By coincidence, it was unmasked on October 10;
** at the time, do not look, for writing the article imitated the situation later. During the fights, the data was not pulled out of the logs at all; there was no time for the flow;
*** yes, yes, I also modeled the picture. Imagine that where there is green in the beginning, everything is red there;) And then I drank during restarts.
2014.12.31 UPD: According to the results of the discussion of the article, a ticket was opened (thanx to alexvl ):
SNMPv3 failure to send requests that are “Too long” is not handled properly by SNMP bulk
It has been successfully closed (thanx to Aleksandrs Saveljevs) since versions 2.2.9rc1, 2.4.4rc1, 2.5.0
Since reading the article Zabbix 2.2 came out in the corresponding blog, I could not wait for Gentoo to unmask version 2.2. Practically there was no such innovation in this version that I would not be interested in and useful in “everyday life”. This monitoring of VMware, and system acceleration, and improvements in the LLDP, in short, almost every item.
Months passed, and version 2.2 was not even disguised.
')
Sometimes I put the routine aside and do something “parallel” with regard to urgent and important tasks and work. This time I remembered the desire to upgrade Zabbix to version 2.2.
Checked in masked *, well, finally, there is 2.2.5
All right, let's go, it's been a year since the release, the stable version doesn't exist, so whatever happens, we'll decide.
We unmask, collect wherever we need (the server and the proxy are the main ones, of course), restart. Reinstall the web interface iiii ...
And nothing, is updating the database.
The thing is not fast, my base is not small, and then the process is completely frozen.
Well, I think it started, as they say, they did not have time to start, but everything is already bad.
In the mysql logs there was an Error number 28 means 'No space left on device', there was more than enough space everywhere. As they say “in the presence of Google, I am godlike” (c), not immediately, but I managed to find / guess that this device is ibdata1 and ibdata2, the size of which is regulated by the innodb_data_file_path parameter. After I changed max from 256M to 512M, the database update was completed successfully and the server started.
The proxy also had problems, and also because of the database. Just sqlite is not updated, so stop the proxy, delete the old database and run the proxy. As they say read carefully Upgrade notes
Of course, during the update, a lot of overdue data has accumulated, so we check what we can check that everything is shown in the interface, and wait until everything is fixed and updated.
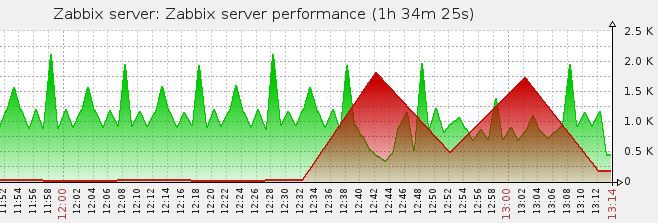
After a couple of hours, look at the schedule:
The day was starting to get languid.
We have a turn. From where? .. The main overdue data from one of the proxies. And what kind of data. And the data received by SNMPv3.
Fine. I had questions to this functionality before, but all hands did not reach, but there was hope that the update would resolve these issues. And then the system becomes practically inoperable. At one time, reading about how people using a single server or proxy monitor hundreds of network devices, I could not understand what was the matter? I have a few dozen devices, and everything works at the limit. Already, the DB is utterly optimized, and the server is set to a fast datastor, and a lot of memory has been given to it.
I didn’t want to roll back, so it was decided to try to deal with the problem by all means.
I chose one of the proxies, for which the most SNMP devices, and began to understand.
That's what we have in the logs on the proxy **:
4447:20141218:124053.605 SNMP agent item "ifAdminStatus.["10130"]" on host "co-xx02" failed: first network error, wait for 15 seconds 4468:20141218:124108.270 resuming SNMP agent checks on host "co-xx02": connection restored And so randomly across all SNMP hosts, with different items.
I definitely do not have network problems, but to be sure, I of course quickly checked the connectivity, speed and logs of the switches. We check the SNMP itself using snmpwalk and we pull the whole tree. No problem.
Google Somebody got pollers, someone had incorrect timeouts, some bug related to this was fixed in version 2.2.3. Someone has a tricky network problem and lost UDP. But this is not our case.
What then? ..
An interesting fact, if you restart the proxy
/etc/init.d/zabbix-proxy restart That is seen as the queue starts to shrink, but then bang, something happens again and it instantly grows ***.
What is happening? ..
Enable extended logging on zabbix-proxy
DebugLevel = 4
Restart zabbix-proxy and wait for errors
Now, instead of Network Error, we see more complete information.
It looks like this
5414:20141218:125955.481 zbx_snmp_get_values() snmp_synch_response() status:1 errstat:-1 mapping_num:94 5414:20141218:125955.481 End of zbx_snmp_get_values():NETWORK_ERROR 5414:20141218:125955.481 End of zbx_snmp_process_standard():NETWORK_ERROR 5414:20141218:125955.481 In zbx_snmp_close_session() 5414:20141218:125955.481 End of zbx_snmp_close_session() 5414:20141218:125955.481 getting SNMP values failed: Cannot connect to "192.168.xx:161": Too long. 5414:20141218:125955.481 End of get_values_snmp() 5414:20141218:125955.481 In deactivate_host() hostid:10207 itemid:43739 type:6 5414:20141218:125955.481 query [txnlev:1] [begin;] 5414:20141218:125955.481 query [txnlev:1] [update hosts set snmp_errors_from=1418896795,snmp_disable_until=1418896810,snmp_error='Cannot connect to "192.168.xx:161": Too long.' where hostid=10207] 5414:20141218:125955.481 query [txnlev:1] [commit;] 5414:20141218:125955.481 SNMP agent item "ifOperStatus.["10143"]" on host "co-xx04" failed: first network error, wait for 15 seconds 5414:20141218:125955.481 deactivate_host() errors_from:1418896795 available:1 5414:20141218:125955.482 End of deactivate_host() Status 1, error status -1, number of elements 94
Here is the conclusion that this is NETWORK_ERROR
And just below decoding Too long and deactivating the host. It is clear that if a host is deactivated, data cannot be obtained from it, data is queued, and that is the queue explanation.
Immediately interested in the parameter errstat
Make cat /var/log/zabbix/zabbix_proxy.log | grep errstat
5412:20141218:130351.410 zbx_snmp_get_values() snmp_synch_response() status:0 errstat:0 mapping_num:11 5433:20141218:130351.470 zbx_snmp_get_values() snmp_synch_response() status:1 errstat:-1 mapping_num:94 5430:20141218:130351.476 zbx_snmp_get_values() snmp_synch_response() status:1 errstat:-1 mapping_num:94 5417:20141218:130353.442 zbx_snmp_get_values() snmp_synch_response() status:0 errstat:0 mapping_num:5 5420:20141218:130353.534 zbx_snmp_get_values() snmp_synch_response() status:1 errstat:-1 mapping_num:94 Yeah, digging deeper.
There should be a picture We need to go deeper, but it won't. I think she got everyone.
Make cat /var/log/zabbix/zabbxi_proxy.log | grep errstat: -1
5416:20141218:130353.540 zbx_snmp_get_values() snmp_synch_response() status:1 errstat:-1 mapping_num:94 5412:20141218:130355.571 zbx_snmp_get_values() snmp_synch_response() status:1 errstat:-1 mapping_num:94 5417:20141218:130355.591 zbx_snmp_get_values() snmp_synch_response() status:1 errstat:-1 mapping_num:94 ... 5420:20141218:130453.187 zbx_snmp_get_values() snmp_synch_response() status:1 errstat:-1 mapping_num:94 5412:20141218:130455.206 zbx_snmp_get_values() snmp_synch_response() status:1 errstat:-1 mapping_num:94 5413:20141218:130455.207 zbx_snmp_get_values() snmp_synch_response() status:1 errstat:-1 mapping_num:94 It's time to turn off monitoring of all devices for a proxy except one, because otherwise, the log is too difficult to understand. Anyway, the system in this form as it is now for monitoring is not suitable.
Disable, do
cat /var/log/zabbix/zabbxi_proxy.log | grep mapping_num
and restart the proxy
No mistakes at first, and mapping_num is slowly growing from 1 more and more (separate lines are cut to show the principle)
You can always look at how growing mapping_num
7876:20141218:131251.660 zbx_snmp_get_values() snmp_synch_response() status:0 errstat:0 mapping_num:4 7872:20141218:131251.681 zbx_snmp_get_values() snmp_synch_response() status:0 errstat:0 mapping_num:6 7872:20141218:131251.919 zbx_snmp_get_values() snmp_synch_response() status:0 errstat:0 mapping_num:8 7876:20141218:131251.919 zbx_snmp_get_values() snmp_synch_response() status:0 errstat:0 mapping_num:9 7868:20141218:131351.965 zbx_snmp_get_values() snmp_synch_response() status:0 errstat:0 mapping_num:13 10502:20141218:135237.884 zbx_snmp_get_values() snmp_synch_response() status:0 errstat:0 mapping_num:31 10507:20141218:135238.244 zbx_snmp_get_values() snmp_synch_response() status:0 errstat:0 mapping_num:62 12429:20141218:141637.942 zbx_snmp_get_values() snmp_synch_response() status:0 errstat:0 mapping_num:31 12429:20141218:141637.966 zbx_snmp_get_values() snmp_synch_response() status:0 errstat:0 mapping_num:31 12433:20141218:141651.142 zbx_snmp_get_values() snmp_synch_response() status:1 errstat:-1 mapping_num:94 And then oppa 94, and -1 and too long. Those. Immediately after launching, the proxy tests the devices, sends them SNMP requests, increasing the number of items in one request. The queue starts to shrink quickly. Then he (I mean the proxy) reaches the magic number 94, it crashes and the devices begin to turn off with a zabbiks for 15 seconds, which in turn begins to dramatically increase the queue.
As you can see, here is not a Network error at all, here is Too long.
Okay, try to find something on zabbix snmp too long, nothing.
Again, timeouts, poller overload ... In one interesting post there was information that such an error occurred when the OID for the item was incorrectly formed, so I double checked all my OIDs, including through snmpget
Those. In the end, Google could not help me.
We will understand ourselves, this is useful.
So what do we have?
As soon as the number of items becomes 94 (i.e., large enough), something happens and the system gets lost.
Here again, the picture, which will not;)
It's time to climb into the code. In gentoo, you don’t need to download anything, everything is already there, so I just unpacked everything into a working directory.
We find first where the error is displayed. We are looking for errstat
Surprisingly, there are only two such places in the file with the talking title checks_snmp.c
these two places are:
from line 745
/* communicate with agent */ status = snmp_synch_response(ss, pdu, &response); zabbix_log(LOG_LEVEL_DEBUG, "%s() snmp_synch_response() status:%d errstat:%ld max_vars:%d", __function_name, status, NULL == response ? (long)-1 : response->errstat, max_vars); and from line 938
status = snmp_synch_response(ss, pdu, &response); zabbix_log(LOG_LEVEL_DEBUG, "%s() snmp_synch_response() status:%d errstat:%ld mapping_num:%d", __function_name, status, NULL == response ? (long)-1 : response->errstat, mapping_num); While we are interested in the second piece (assuming that the mapping_num is only in it)
Not even the programmer sees that we have a NULL response, and why? ..
Recall that with errstat: -1, which is now clear where it comes from, we have status: 1. Those. the snmp_synch_response function returns 1, but what does this mean? ..
And this means STAT_ERROR (1) (and she can also STAT_TIMEOUT (2) and STAT_SUCCESS (0))
As they say it is not clear, but great ...
Let's enter on the other hand, somewhere here in this file there should be a NETWORK_ERROR return. Let's try to figure out where and why.
The very first entry in the function zbx_get_snmp_response_error (which, as it were, hints)
View code zbx_get_snmp_response_error
static int zbx_get_snmp_response_error(const struct snmp_session *ss, const DC_INTERFACE *interface, int status, const struct snmp_pdu *response, char *error, int max_error_len) { int ret; if (STAT_SUCCESS == status) { zbx_snprintf(error, max_error_len, "SNMP error: %s", snmp_errstring(response->errstat)); ret = NOTSUPPORTED; } else if (STAT_ERROR == status) { zbx_snprintf(error, max_error_len, "Cannot connect to \"%s:%hu\": %s.", interface->addr, interface->port, snmp_api_errstring(ss->s_snmp_errno)); switch (ss->s_snmp_errno) { case SNMPERR_UNKNOWN_USER_NAME: case SNMPERR_UNSUPPORTED_SEC_LEVEL: case SNMPERR_AUTHENTICATION_FAILURE: ret = NOTSUPPORTED; break; default: ret = NETWORK_ERROR; } } else if (STAT_TIMEOUT == status) { zbx_snprintf(error, max_error_len, "Timeout while connecting to \"%s:%hu\".", interface->addr, interface->port); ret = NETWORK_ERROR; } else { zbx_snprintf(error, max_error_len, "SNMP error: [%d]", status); ret = NOTSUPPORTED; } return ret; } Yeah. Those. we with our STAT_ERROR enter the switch where we do not fall under any of the above conditions, and thus we get NETWORK_ERROR by default.
We already understood that this default is disorienting us, we need to find out what kind of error it really is. The error code is stored in ss-> s_snmp_errno, we add the output of the variable to the log.
The programmer from me is so-so, so quickly with the help of scrap and someone's mother (s) slayap patchch, like this:
diff -urN zabbix-2.2.5/src/zabbix_server/poller/checks_snmp.c zabbix-2.2.5.new/src/zabbix_server/poller/checks_snmp.c --- zabbix-2.2.5/src/zabbix_server/poller/checks_snmp.c 2014-07-17 17:49:45.000000000 +0400 +++ zabbix-2.2.5.new/src/zabbix_server/poller/checks_snmp.c 2014-10-10 16:38:31.000000000 +0400 @@ -938,7 +938,7 @@ status = snmp_synch_response(ss, pdu, &response); zabbix_log(LOG_LEVEL_DEBUG, "%s() snmp_synch_response() status:%d errstat:%ld mapping_num:%d", - __function_name, status, NULL == response ? (long)-1 : response->errstat, mapping_num); + __function_name, status, NULL == response ? (STAT_ERROR == status ? (long) ss->s_snmp_errno : (long)-1) : response->errstat, mapping_num); if (STAT_SUCCESS == status && SNMP_ERR_NOERROR == response->errstat) { If the status is STAT_ERROR output ss-> s_snmp_errno
I threw the source of zabbiks into the local repository, quickly corrected the ebuild and forth.
Compile, restart, wait.
And here it is our real mistake.
11211:20141218:155253.362 zbx_snmp_get_values() snmp_synch_response() status:0 errstat:0 mapping_num:18 11210:20141218:155253.393 zbx_snmp_get_values() snmp_synch_response() status:1 errstat:-5 mapping_num:94 Error -5
Enjoying Net-SNMP snmp_api.h
#define SNMPERR_TOO_LONG (-5) Something similar was seen in the logs, but according to the phrase Too Long we could not find anything, let's see what kind of error it is and when it occurs.
in snmp_api.c you can see it
some more code
/* * Make sure we don't send something that is bigger than the msgMaxSize * specified in the received PDU. */ if (pdu->version == SNMP_VERSION_3 && session->sndMsgMaxSize != 0 && length > session->sndMsgMaxSize) { DEBUGMSGTL(("sess_async_send", "length of packet (%lu) exceeds session maximum (%lu)\n", (unsigned long)length, (unsigned long)session->sndMsgMaxSize)); session->s_snmp_errno = SNMPERR_TOO_LONG; SNMP_FREE(pktbuf); return 0; } /* * Check that the underlying transport is capable of sending a packet as * large as length. */ if (transport->msgMaxSize != 0 && length > transport->msgMaxSize) { DEBUGMSGTL(("sess_async_send", "length of packet (%lu) exceeds transport maximum (%lu)\n", (unsigned long)length, (unsigned long)transport->msgMaxSize)); session->s_snmp_errno = SNMPERR_TOO_LONG; SNMP_FREE(pktbuf); return 0; } There are only two options:
1. The length of the data we want to send is more than the msgMaxSize parameter defined in the received PDU
2. The underlying transport is not able to send a packet of this length.
There is a question how to fix this error. It follows from the above that we need to look for whether we get msgMaxSize, whether we process it correctly, etc. etc. But I see the zabbix source for the first time, and C in the second (well, ok for the third).
In short, it does not cause enthusiasm ... Yes, and perhaps you can break something.
Lyrical digression:
I must say that during the proceedings with this problem, I also stumbled upon the information about the SNMP mass processing. Those. zabbix can request multiple SNMP items in a single request.
SNMP bulk processing details
The bottom line is that zabbix can query up to 128 values in one request, but not all devices are able to process these 128 values at once. And zabbih uses the strategy of finding the maximum value for each specific device. We by the way saw it in the logs. Gradual increase mapping_num. As soon as zabbix receives an error from the SNMPERR_TOO_BIG device, it, using a specific algorithm, searches for the maximum value that returns results without errors.
What is it for me?
The overflow error handling mechanism (let's call it this way) in zabbiks is, you just need to expand it for one more case.
The algorithm itself is painted under the output of our error.
Again this code
else if (1 < mapping_num && ((STAT_SUCCESS == status && SNMP_ERR_TOOBIG == response->errstat) || STAT_TIMEOUT == status)) { /* Since we are trying to obtain multiple values from the SNMP agent, the response that it has to */ /* generate might be too big. It seems to be required by the SNMP standard that in such cases the */ /* error status should be set to "tooBig(1)". However, some devices simply do not respond to such */ /* queries and we get a timeout. Moreover, some devices exhibit both behaviors - they either send */ /* "tooBig(1)" or do not respond at all. So what we do is halve the number of variables to query - */ /* it should work in the vast majority of cases, because, since we are now querying "num" values, */ /* we know that querying "num/2" values succeeded previously. The case where it can still fail due */ /* to exceeded maximum response size is if we are now querying values that are unusually large. So */ /* if querying with half the number of the last values does not work either, we resort to querying */ /* values one by one, and the next time configuration cache gives us items to query, it will give */ /* us less. */ if (*min_fail > mapping_num) *min_fail = mapping_num; if (0 == level) { /* halve the number of items */ int base; ret = zbx_snmp_get_values(ss, items, oids, results, errcodes, query_and_ignore_type, num / 2, level + 1, error, max_error_len, max_succeed, min_fail); if (SUCCEED != ret) goto exit; base = num / 2; ret = zbx_snmp_get_values(ss, items + base, oids + base, results + base, errcodes + base, NULL == query_and_ignore_type ? NULL : query_and_ignore_type + base, num - base, level + 1, error, max_error_len, max_succeed, min_fail); } else if (1 == level) { /* resort to querying items one by one */ for (i = 0; i < num; i++) { if (SUCCEED != errcodes[i]) continue; ret = zbx_snmp_get_values(ss, items + i, oids + i, results + i, errcodes + i, NULL == query_and_ignore_type ? NULL : query_and_ignore_type + i, 1, level + 1, error, max_error_len, max_succeed, min_fail); if (SUCCEED != ret) goto exit; } } } That is, everything is simple, we need to add our condition without disrupting the existing ones. For this we have all the data:
- status must be STAT_ERROR
- ss-> s_snmp_errno should be SNMPERR_TOO_LONG
We also take into account that we have two such places (as well as two outputs to the log file) and the resulting patch will be like this:
Finally
diff -urN zabbix-2.2.5/src/zabbix_server/poller/checks_snmp.c zabbix-2.2.5.new/src/zabbix_server/poller/checks_snmp.c --- zabbix-2.2.5/src/zabbix_server/poller/checks_snmp.c 2014-07-17 17:49:45.000000000 +0400 +++ zabbix-2.2.5.new/src/zabbix_server/poller/checks_snmp.c 2014-10-10 16:38:31.000000000 +0400 @@ -746,10 +746,10 @@ status = snmp_synch_response(ss, pdu, &response); zabbix_log(LOG_LEVEL_DEBUG, "%s() snmp_synch_response() status:%d errstat:%ld max_vars:%d", - __function_name, status, NULL == response ? (long)-1 : response->errstat, max_vars); + __function_name, status, NULL == response ? (STAT_ERROR == status ? (long)ss->s_snmp_errno : (long)-1) : response->errstat, max_vars); if (1 < max_vars && - ((STAT_SUCCESS == status && SNMP_ERR_TOOBIG == response->errstat) || STAT_TIMEOUT == status)) + ((STAT_SUCCESS == status && SNMP_ERR_TOOBIG == response->errstat) || STAT_TIMEOUT == status || (STAT_ERROR == status && SNMPERR_TOO_LONG == ss->s_snmp_errno))) { /* The logic of iteratively reducing request size here is the same as in function */ /* zbx_snmp_get_values(). Please refer to the description there for explanation. */ @@ -938,7 +938,7 @@ status = snmp_synch_response(ss, pdu, &response); zabbix_log(LOG_LEVEL_DEBUG, "%s() snmp_synch_response() status:%d errstat:%ld mapping_num:%d", - __function_name, status, NULL == response ? (long)-1 : response->errstat, mapping_num); + __function_name, status, NULL == response ? (STAT_ERROR == status ? (long) ss->s_snmp_errno : (long)-1) : response->errstat, mapping_num); if (STAT_SUCCESS == status && SNMP_ERR_NOERROR == response->errstat) { @@ -1001,7 +1001,7 @@ } } else if (1 < mapping_num && - ((STAT_SUCCESS == status && SNMP_ERR_TOOBIG == response->errstat) || STAT_TIMEOUT == status)) + ((STAT_SUCCESS == status && SNMP_ERR_TOOBIG == response->errstat) || STAT_TIMEOUT == status || (STAT_ERROR == status && SNMPERR_TOO_LONG == ss->s_snmp_errno))) { /* Since we are trying to obtain multiple values from the SNMP agent, the response that it has to */ /* generate might be too big. It seems to be required by the SNMP standard that in such cases the */ Compile, restart ...
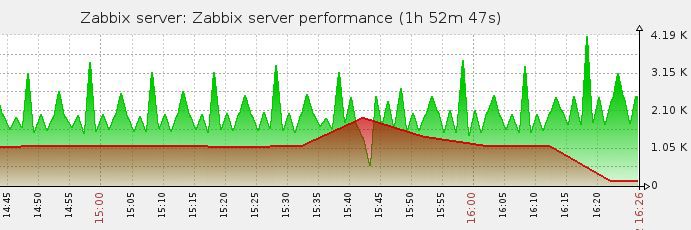
And here is the result:
Network Error Error disappeared from the logs.
Hooray!..
Afterword
Of course, in reality, the search for errors and solutions took more time. I had to pick more sources and zabbix and net-snmp, in order to finally stop at two places in the code.
But the feeling of victory over "inert matter" is priceless.
* Desire rolled on October 7, and then 2.2.5 was still disguised. By coincidence, it was unmasked on October 10;
** at the time, do not look, for writing the article imitated the situation later. During the fights, the data was not pulled out of the logs at all; there was no time for the flow;
*** yes, yes, I also modeled the picture. Imagine that where there is green in the beginning, everything is red there;) And then I drank during restarts.
2014.12.31 UPD: According to the results of the discussion of the article, a ticket was opened (thanx to alexvl ):
SNMPv3 failure to send requests that are “Too long” is not handled properly by SNMP bulk
It has been successfully closed (thanx to Aleksandrs Saveljevs) since versions 2.2.9rc1, 2.4.4rc1, 2.5.0
Source: https://habr.com/ru/post/240169/
All Articles