Development and debugging of UEFI-drivers on Intel Galileo, part 3: starting hardware debugging

Hello, dear readers of Habr.
After a short break, I continue to publish my notes ( first , second ) on the development and debugging of UEFI components on the open hardware platform Intel Galileo. The third part deals with connecting the JTAG debugger based on FT2232H to Galileo and setting up a debugging environment for it.

Entry and Disclaimer
According to the already established tradition, it should be mentioned that you use all of the following information at your own peril and risk; the author is not responsible for any loss of performance of the board, time, mood, and / or faith in humanity. Everything described is obtained from open sources, a list of which is given at the end of this article, and this publication cannot be considered a violation of the NDA on my part.
A starting point
At the moment I am assuming that you already have an Intel Galileo board for which you have compiled the firmware and image of Yocto Linux and can do it again at any time. I will not stop once again on assembling software for Galileo in this part of the article - read the last part , if necessary.It also implies that you have a debugger compatible with OpenOCD, best of all - based on FTDI FTxx32H series chips, since these are exactly what Intel engineers are using to write and test debugging tools for Galileo. I can not guarantee that other debuggers will not work - did not check. In this article, as a debugger, I will use a breakout board on the FT2232H , which differs from the “adult” debuggers on the same chip only by the absence of a beautiful case and a logic level shift chip, for debugging on Galileo not needed.

Iron part
With the iron part, everything is quite simple - you just need to correctly connect the contacts of the JTAG connector on Galileo with the necessary pins FT2232H.Pins of the FTxx32H series chips are marked with xyBUSz, where instead of x is the channel designation (A, B, C or D), instead of y is the designation of the first (D) or second (C) pin set of each channel, and instead of z, the output number ( 0-7 for the first and 0-9 for the second set of pins).
To work with JTAG, you need to connect as follows:
  xDBUS0 <-> TCK
 xDBUS1 <-> TDI
 xDBUS2 <-> TDO
 xDBUS3 <-> TMS
TRST can be connected to any free output of the same channel, in my case it is xCBUS0, you can use any other one, but you will have to make a corresponding change in the OpenOCD configuration.

Software part
We get Intel System Studio
But here everything is a bit more complicated, especially for Windows users who do not have the ability to run sudo apt-get install openocd and after 10 seconds start writing the configuration for their debugger. The guys from Intel are aware of this, so they included OpenOCD and GDB in the Intel System Studio 2015 Beta distribution, which can be downloaded from here after registration . It also has the Intel System Debugger, which acts as a GUI for GDB and is intended for those who have not yet comprehended Tao enough to work with it directly from the console. Your humble servant has already embarked on this Path, but it is difficult, and the temptation to use the GUI is great, because Intel even added support for debugging UEFI not so long ago. As a result, I did succumb, I suggest that you also succumb.After registering, downloading and installing ISS, you need to take a few additional steps: write the configuration for your debugger (the default configurations are only for TinCanTools FLYSWATTER2 and Olimex ARM-USB-OCD-H ), connect the debugging symbols so that you can debug the C code, and not in assembler. On Windows, you also need to install the libusbK driver for the selected debugger channel instead of the standard FTDI driver in order for OpenOCD to find it. Let's get started
We write configuration for OpenOCD
Configuring OpenOCD usually consists of two parts: writing a debugger configuration and debugging board. The good Intel developers have saved us from the second, and the first will be done by analogy. Browse to the directory where you installed System Studio, and from there to debugger \ openocd \ scripts \ interface \ ftdi , and copy the olimex-arm-usb-ocd-h.cfg file , naming a copy of debugger.cfg . Open the resulting file in your favorite editor and delete the ftdi_device_desc , ftdi_layout_signal nSRST , ftdi_layout_signal LED lines, change the VID and PID of the debugger to your values in the ftdi_vid_pid line. If you are using channels B, C or D, add the line ftdi_channel 1 , ftdi_channel 2 or ftdi_channel 3 respectively. Save the changes and configuration for your debugger ready.If you want to know what the magic numbers in the ftdi_layout_init line mean , set up additional signals or transfer the TRST from xCBUS0 to another output - welcome to the documentation .
Ready version of debugger.cfg for breakout boards on FT2232H
interface ftdi ftdi_vid_pid 0x0403 0x6010 ftdi_channel 0 ftdi_layout_init 0x0c08 0x0f1b ftdi_layout_signal nTRST -data 0x0100 -noe 0x0400 Install the libusbK driver
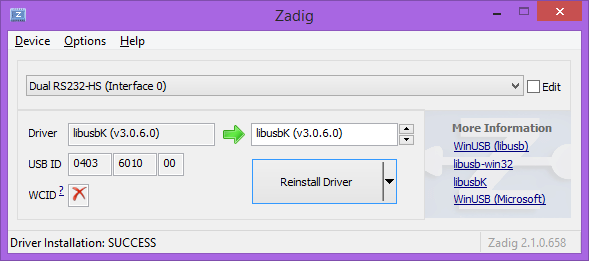
Linux users can safely skip this step, since they have the necessary driver already installed. Windows users need to install the above driver instead of the standard one. This can be done in several ways, the simplest of which, in my opinion, is the use of the Zadig utility. Download and run the latest version, tick the List All Devices in the Options menu, select your device from the list, select libusbK as the driver and click the Replace Driver button.If everything is done correctly, the program window will look something like this:
')
We check the work of OpenOCD
Now you need to check that the debugger is connected correctly and OpenOCD can use it to access Galileo via JTAG. To do this, openocd should be run, specifying the configuration files for the debugger (debugger.cfg created in the first step) and for the board (included in the ISS package) as parameters. To do this, run the command prompt from the administrator, change the current directory to debugger \ openocd \ bin , and from there execute the commandopenocd -f .. \ scripts \ intefrace \ ftdi \ debugger.h -f .. \ scripts \ board \ quark_x10xx_board.cfgIf you did everything right, the command will output something like:
Info : clock speed 4000 kHz Info : JTAG tap: quark_x10xx.cltap tap/device found: 0x0e681013 (mfg: 0x009, part: 0xe681, ver: 0x0) enabling core tap Info : JTAG tap: quark_x10xx.cpu enabled If you only have this instead Error: libusb_open() failed with LIBUSB_ERROR_NOT_SUPPORTED it means something is wrong either with the driver or with the debugger configuration.We get debug symbols
If the firmware build for Galileo, described in the previous part, happened in your main system, you can skip this step. In my case, it happened in a virtual machine, so for source-based debugging you need to get the source code of the firmware and files with debug information from it.Copy the Quark_EDKII_vX.YZ directory from your home directory in VM to the desktop of the main OS, launch Intel Debugger with the xdb_remote script (in Windows, the link to it is in the Start-> ISS-> Debugger Startup-> Quark SoC menu), open the Options- window > Source Directories ... , create on the first tab a rule for replacing the old path to the copied directory with a new one, in my case this is "\ home \ congatec \ Galileo" -> "C: \ Users \ Nikolaj \ Desktop", and on the second tab Add this directory to the Source Directories list. Both of these actions will help the debugger to independently find the source code of the modules being debugged.
Connect to Galileo
Start OpenOCD and the Intel Debugger as described above, click Reset on Galileo, and then the Connect button in the debugger window. If in the Assembler window there is a listing of the module where the shutdown occurred while connecting the debugger - great, you can start hardware debugging. To check if there is an error in the previous step, stop in the DXE phase (3-5 seconds after rebooting the board) and enter the efi "setsuffix .debug" and efi loadthis commands in the field with the xdb> prompt. If everything was done correctly, the debugging symbols will be successfully loaded, and the debugger will go from the Assembler tab to the source editor. If in response to loadthis you get the message “System Table Not Found” - try to stop the execution a little later or a little earlier.
Conclusion and plans
In the next part of the article, we will write a simple DXE driver, adjust the fast build of the firmware with it and try to debug it using both the Intel Debugger prepared in this article and other debugging tools. Thank you for your attention, see you in the next part.PS Dear UFO, maybe now you can add a profile hub UEFI ? It would be great.

Literature
Hi-Speed Devices InterFacing FTDI USB to JTAG TAP | FTDI Application NoteDebug Adapter Configuration | OpenOCD Documentation
Source Level Debug using OpenOCD / GDB / Eclipse on Intel Quark SoC X1000 | Intel Application Note
Source: https://habr.com/ru/post/240075/
All Articles