Intel® Parallel Studio XE 2015 - Talk About New Names and "Chips"
On August 26, 2014, another new version of the Parallel Studio toolkit - 2015 was released. We wrote about the innovations of the previous version almost a year ago, and now is the time to tell us about what appeared in the latest release.
Not so long ago, I tried to shed light on the tangled names of Intel software products in the corresponding post , but the good guys from the marketing again changed everything. So, get acquainted with the new philosophy in the names:
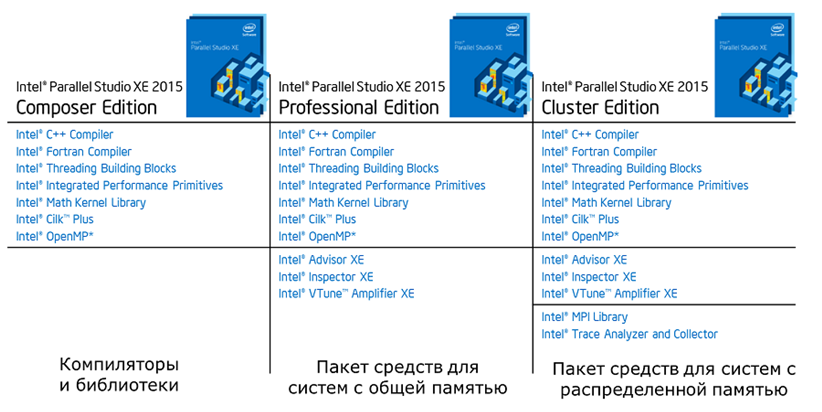
From now on, all the packages of tools are offered under the name of Intel Parallel Studio XE 2015 , but in different versions. It turns out that now in order to use the compiler and libraries, you need Intel Parallel Studio XE 2015 Composer Edition. And the lives of thousands of developers immediately became easier, and all the bugs are gone, frightened by such a formidable name. All right, let's continue without irony. If we add the well-known and used VTune + Inspector + Advisor to such a base bundle, we get the Pro version. Throwing over Intel MPI and ITAC, we get a set called Cluster Edition. I anticipate confusion with similar names, but, nevertheless, I think that the people will gradually get used to this renaming, because there is logic.
Naturally, this is only marketing innovations. Let's see what we get with the advent of the new version in technical terms, but here there really is something to try.
')
Here I will give more specifics about what has appeared. For example, in this version of the compiler, “from now and forever and ever,” standards C ++ 11 and Fortran 2003 are fully supported.
The first one adds new string literals, explicit replacement of virtual functions, thread_local, and improved object constructors.
In the Fortran compiler, we added support for parameterized derived types, thus closing the “gap” in support for the Fortran 2003 standard. An interesting possibility is a certain remote analogue of templates from C ++, which gives us the right to control the size of data during compilation and program execution:
In this example, d can be set in runtime and control the size of the two-dimensional array element. By the way, k must be known at compile time in order to set the length of the integer type in this example.
In addition, support for Fortran 2008 and OpenMP 4.0 standards has expanded. In the very same beloved Fortran by me, a BLOCK design appeared, very useful when working with DO CONCURRENT. For OpenMP added support for the directives CANCEL, CANCELLATION POINT and DEPEND for tasks. In general, OpenMP was paid the most attention not only to the new version of the compiler, but also actively worked on its extended support in the profiler. But more on that later.
In addition to such a rich supplement in the standards, the reports on optimization, and in particular, on the work of the vectorizer, were substantially revised. In the blog I mentioned, I talked about this in more detail. Here I want to add that the integration with Visual Studio really works, and now the reports delight the eye with their clarity:

Well, at the end of the compiler theme - added the ability to offload calculations on integrated graphics - Intel Graphics Technology, implemented using directives. The topic is voluminous, so I will not be scattered in this post, but reserve the right to write a separate story about it.
But these are all useful amenities for a very limited number of developers. But the fact that almost everyone who is faced with concurrency will be able to appreciate is the analysis of OpenMP scalability. Now at the end of the profiling, a separate item for OpenMP will be displayed on the Summary page, provided that the application was assembled with the corresponding key (and Intel’s compiler) and there are parallel areas in it.

We can clearly see how much time our application has worked consistently, and, accordingly, evaluate how it will continue to scale, taking into account the Amdahl law. Moreover, there is an approximation of the ideal runtime of the parallel part, which is calculated without taking into account the overhead projector and with the ideal load balance. So, we can now estimate in advance whether it is worth investing efforts in one or another piece of code or algorithm. As is customary, it is possible to go directly to the code of interest. A handy thing that I’m sure will be useful to many developers.
What else? Ability to use external collectors. Suppose we wrote a script that collects various events occurring in the OS, and we want them to be collected during the profiling of our application. Now there is such an opportunity, and the result will be grouped and shown on the same timeline.
For those who like to work on the "apples", a graphical interface for OS X is created. Profiling is not there, but you can view the results collected on Linux or Windows, well, or collect profiles remotely.
The Inspector has significantly reworked the mechanism for finding errors related to common data. According to the developers and based on a comparison of the version of XE 2013 Update 3 and the "freshly released", the acceleration of work reaches 20 times, which is good news. In addition, the amount of memory used has also decreased.
An interesting feature is a new graph that shows real-time memory usage. We started the analysis of work with memory, and we look at it, realizing at the same time how actively the memory is wasted. It looks like this:

Upon completion of the analysis, you can also find possible errors that led to a significant increase in the memory used by going to the required piece of code and running through the stack:

What's new in Advisor? This is of course a simulation feature for Xeon Phi!
Let me remind you that this tool without implementing any parallel model, or easier, without rewriting anything in the code, allows you to evaluate the possible performance gains in different parts of our application. Moreover, there is an opportunity to profile it and find out which places to pay close attention to. Let's say what happens if we parallelize in this loop and run the calculation? How many times will we accelerate? All that is needed is to insert annotations into the section of code of interest to us and run the tool.
So, now we can estimate in advance how good our algorithm is for running on Xeon Phi:

These images show that in one case the algorithm scales well and the feasibility of using Xeon Phi is high, but the other, on the contrary, does not scale from 16 threads.
In addition, it became possible to predict behavior when changing the number of iterations and their duration / complexity:

In general, many different “snacks” have appeared, which will definitely come in handy when developing highly optimized parallel and sequential code. All of them can and should be tried here completely free of charge, that is, as a gift, as usual, for 30 days.
Not so long ago, I tried to shed light on the tangled names of Intel software products in the corresponding post , but the good guys from the marketing again changed everything. So, get acquainted with the new philosophy in the names:
From now on, all the packages of tools are offered under the name of Intel Parallel Studio XE 2015 , but in different versions. It turns out that now in order to use the compiler and libraries, you need Intel Parallel Studio XE 2015 Composer Edition. And the lives of thousands of developers immediately became easier, and all the bugs are gone, frightened by such a formidable name. All right, let's continue without irony. If we add the well-known and used VTune + Inspector + Advisor to such a base bundle, we get the Pro version. Throwing over Intel MPI and ITAC, we get a set called Cluster Edition. I anticipate confusion with similar names, but, nevertheless, I think that the people will gradually get used to this renaming, because there is logic.
Naturally, this is only marketing innovations. Let's see what we get with the advent of the new version in technical terms, but here there really is something to try.
Compilers
Naturally, the compiler, as usual, in the new version has become even faster and more productive than before. In part, I have already described some new "buns" here , mainly focusing on new compiler reports.')
Here I will give more specifics about what has appeared. For example, in this version of the compiler, “from now and forever and ever,” standards C ++ 11 and Fortran 2003 are fully supported.
The first one adds new string literals, explicit replacement of virtual functions, thread_local, and improved object constructors.
In the Fortran compiler, we added support for parameterized derived types, thus closing the “gap” in support for the Fortran 2003 standard. An interesting possibility is a certain remote analogue of templates from C ++, which gives us the right to control the size of data during compilation and program execution:
TYPE humongous_matrix(k, d) INTEGER, KIND :: k = kind(0.0) INTEGER(selected_int_kind(12)), LEN :: d REAL(k) :: element(d,d) END TYPE TYPE(humongous_matrix(8,10000000)) :: giant In this example, d can be set in runtime and control the size of the two-dimensional array element. By the way, k must be known at compile time in order to set the length of the integer type in this example.
In addition, support for Fortran 2008 and OpenMP 4.0 standards has expanded. In the very same beloved Fortran by me, a BLOCK design appeared, very useful when working with DO CONCURRENT. For OpenMP added support for the directives CANCEL, CANCELLATION POINT and DEPEND for tasks. In general, OpenMP was paid the most attention not only to the new version of the compiler, but also actively worked on its extended support in the profiler. But more on that later.
In addition to such a rich supplement in the standards, the reports on optimization, and in particular, on the work of the vectorizer, were substantially revised. In the blog I mentioned, I talked about this in more detail. Here I want to add that the integration with Visual Studio really works, and now the reports delight the eye with their clarity:
Well, at the end of the compiler theme - added the ability to offload calculations on integrated graphics - Intel Graphics Technology, implemented using directives. The topic is voluminous, so I will not be scattered in this post, but reserve the right to write a separate story about it.
VTune Amplifier XE
The new version of the studio has changed for the better and VTune. Now we have even more opportunities for profiling on both the CPU and the GPU. For example, since we can now do offload on the GPU, there is a corresponding analysis, however, so far only on Windows. In the same place expanded and support for OpenCL. In addition, the TSX transaction analysis feature has been added. By the way, a very good overview of the transactional memory in the Haswell processor is presented here .But these are all useful amenities for a very limited number of developers. But the fact that almost everyone who is faced with concurrency will be able to appreciate is the analysis of OpenMP scalability. Now at the end of the profiling, a separate item for OpenMP will be displayed on the Summary page, provided that the application was assembled with the corresponding key (and Intel’s compiler) and there are parallel areas in it.
We can clearly see how much time our application has worked consistently, and, accordingly, evaluate how it will continue to scale, taking into account the Amdahl law. Moreover, there is an approximation of the ideal runtime of the parallel part, which is calculated without taking into account the overhead projector and with the ideal load balance. So, we can now estimate in advance whether it is worth investing efforts in one or another piece of code or algorithm. As is customary, it is possible to go directly to the code of interest. A handy thing that I’m sure will be useful to many developers.
What else? Ability to use external collectors. Suppose we wrote a script that collects various events occurring in the OS, and we want them to be collected during the profiling of our application. Now there is such an opportunity, and the result will be grouped and shown on the same timeline.
For those who like to work on the "apples", a graphical interface for OS X is created. Profiling is not there, but you can view the results collected on Linux or Windows, well, or collect profiles remotely.
Inspector and Advisor
Finally left the tools that can greatly simplify the life of any developer, a kind of bonus in the package Parallel Studio XE.The Inspector has significantly reworked the mechanism for finding errors related to common data. According to the developers and based on a comparison of the version of XE 2013 Update 3 and the "freshly released", the acceleration of work reaches 20 times, which is good news. In addition, the amount of memory used has also decreased.
An interesting feature is a new graph that shows real-time memory usage. We started the analysis of work with memory, and we look at it, realizing at the same time how actively the memory is wasted. It looks like this:
Upon completion of the analysis, you can also find possible errors that led to a significant increase in the memory used by going to the required piece of code and running through the stack:
What's new in Advisor? This is of course a simulation feature for Xeon Phi!
Let me remind you that this tool without implementing any parallel model, or easier, without rewriting anything in the code, allows you to evaluate the possible performance gains in different parts of our application. Moreover, there is an opportunity to profile it and find out which places to pay close attention to. Let's say what happens if we parallelize in this loop and run the calculation? How many times will we accelerate? All that is needed is to insert annotations into the section of code of interest to us and run the tool.
So, now we can estimate in advance how good our algorithm is for running on Xeon Phi:
These images show that in one case the algorithm scales well and the feasibility of using Xeon Phi is high, but the other, on the contrary, does not scale from 16 threads.
In addition, it became possible to predict behavior when changing the number of iterations and their duration / complexity:
In general, many different “snacks” have appeared, which will definitely come in handy when developing highly optimized parallel and sequential code. All of them can and should be tried here completely free of charge, that is, as a gift, as usual, for 30 days.
Source: https://habr.com/ru/post/239555/
All Articles