YouTrack 6.0, distinct and flexible. What can a new tracker?
The latest version of YouTrack tracker has been released . In the next browser panel you can already download it or try it in the cloud , and here we will tell you what is particularly good in it.
In YouTrack 6.0, an information panel (dashboard) appeared to help both development teams and project managers, a lot of new reports, a new screenshot editor, and improved management of groups and access rights.

')
The new version of YouTrack is modestly called YouTrack Harmony. In teams that use principles and approaches of agile, its new features will definitely be in demand (if at the conferences our colleagues are not sly, saying what exactly they lack in our tracker).
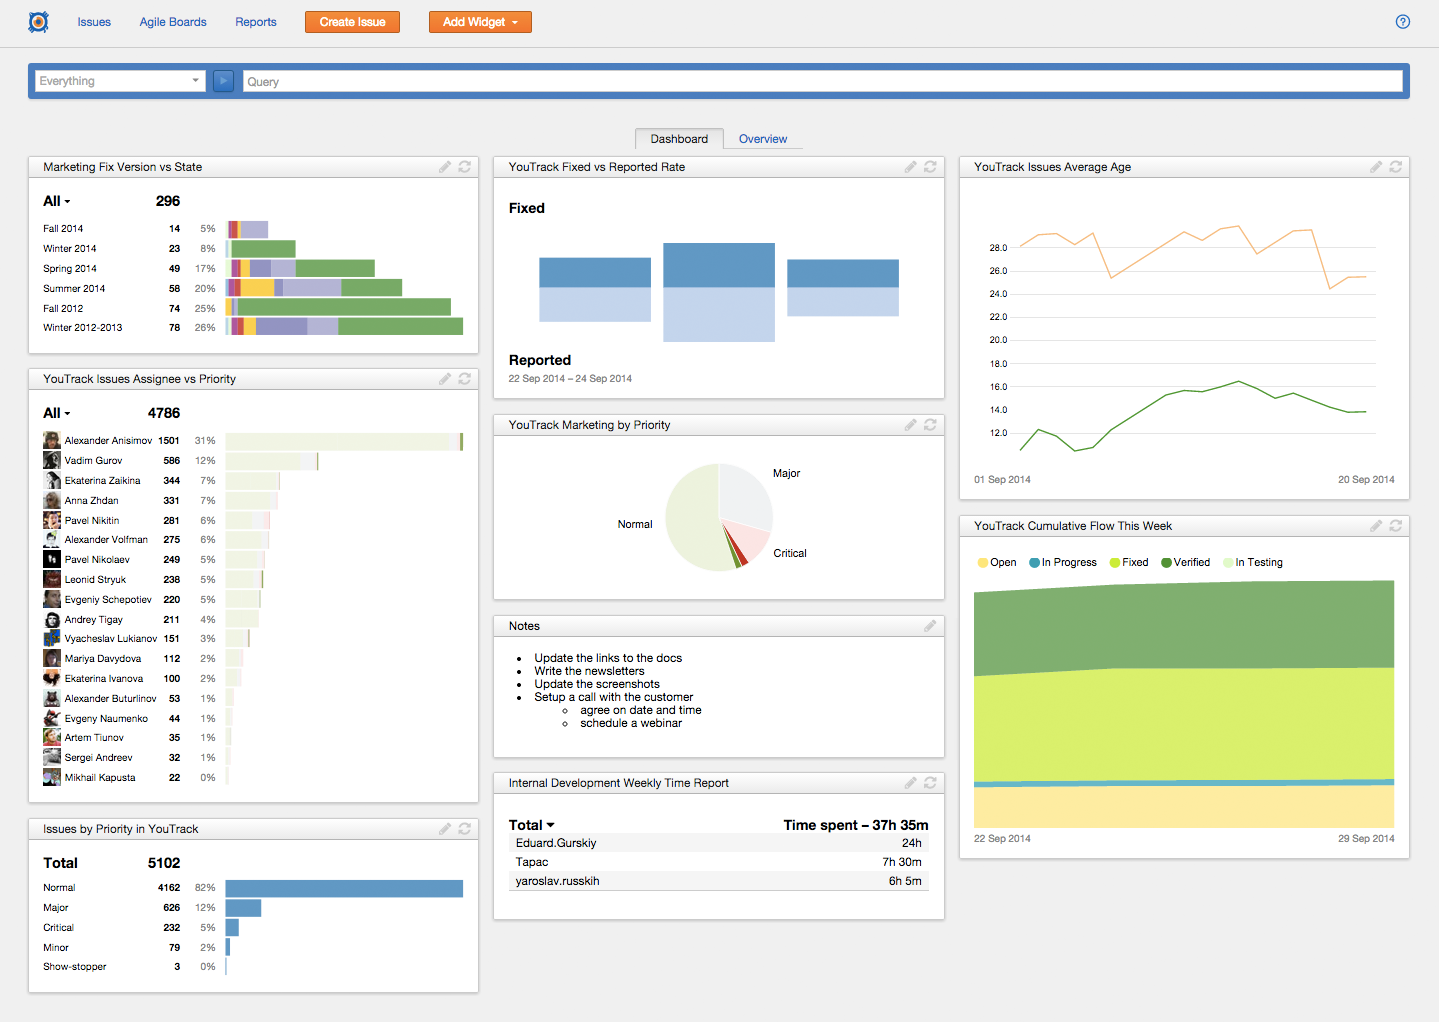
Information panel (Dashboard) is available by clicking on the logo in the main menu.
Here you can find everything that you may need in your project (except for hands and brains).
You can add as many widgets as you want to on the board (just like on the Yandex website, right? * )
Widgets can be of three types: reports, top issues and notes. Those. reports, the most important tasks and notes (which you create yourself, as stickers on the monitor). Each widget can be customized, for example, to define a search query for top issues, so that this widget displays exactly the tasks that are important to you.
YouTrack Harmony has 17 different reports. They are divided into progress reports (Timeline reports) and project status reports (Snapshot reports). Project progress reports provide a picture of how indicators change over time, and status reports show the status at a specific point or period.
Project progress reports include:
Burndown chart is a well-known to followers of agile practices that bring the number of tasks done to the optimum, comparative graphs (for example, Fixed vs Reported rate) show whether the team is overloaded from incoming tasks or everything goes smoothly, and one of the most interesting graphs is Average issue age, the change in the average time that your tasks spend in a certain state.
To build a graph of Average issue age, moving averages are used - functions familiar to some of those present from financial analysis. The moving average at each point in time is calculated for a given previous period (for example, a week). The moving average is used to smooth the graph by eliminating excessive deviations. For example, if most of the tasks in a project are in the In Progress state for 5 days, and some task has been hanging there for 25 days, then with a relatively small number of tasks it will make a large contribution to the average value. But if we calculate not just the average for the entire project time, but only for the last 7 days, for example, then such a task will not give a large contribution. When calculating the moving average, it will be assumed that it hangs in In Progress for only 7 days (for the fact that outside the window of our choice in 7 days is simply not taken into account).
When you select the report Average issue age, two graphs are plotted - the average itself (by default, the moving average is shown, the other curves on the chart turn on with colored buttons above it) and the number of tasks that passed from the state of interest to some other state. Which state is interesting - In Progress or another, is indicated when creating the schedule. At any time, this setting can be changed, and then the schedule will be recalculated.
In addition to state (State), you can use other fields with enumerated values. For example, you can follow the transfer of tasks from one type to another (Bug -> Feature).
The upper graph shows data on the residence time of tasks in the In Progress state and on the number of tasks.
For each point on the graph, moving maximum is the maximum value over the previous 7 days, moving average is the average over the previous 7 days.
The bottom chart for each day shows the number of tasks transferred from the In Progress state to another state (blue bars) and the number of tasks remaining in the In Progress state.
Status reports have a basic report that can be flexibly configured, Issues per two fields, and several predefined reports on this database, such as Issues per assignee, Issues per project, Issues per arbitrary field. In addition, there is the State transition report, the Matrix report, and several other reports that are not a special case of the Issues per two fields.
Let's take a closer look at the Issues per two fields report. When you create a report, you must specify the name of the report, the project (s) by which it is built, which fields should be postponed by the X and Y axes. You can also refine the search query (if you need to filter only part of the tasks in the report), adjust the type of report and scope . By default, only the one who created it will see the report.

For example, to see which of my colleagues puts me more tasks, I can specify the query "Assignee: me". At the same time, you can see how they are prioritized.

It turned out, as it is easy to see, as if in a ditty: the most of the tasks I set myself.
Chastushka (if anyone did not know):
If you started describing a task or a problem and abandoned it halfway (and so - several times), then YouTrack will now remember all the drafts. You can open several drafts in different browser tabs and edit them at the same time, and also return to the task that you started to describe earlier, or delete the description that has become unnecessary.
We rewrote the image editor. Now it works right in the browser, and you no longer have to bother with Java updates to launch the applet. To attach a screenshot to the task in YouTrack, you need to do it using PrtScr (Windows, Linux) or Cmd + Ctrl + Shift + 4 (Mac OS), paste it into the task description or comment (for example, using Ctrl + V or Cmd + V ), and then in the editor, trim the excess, emphasize the important or cover up the private:

If you updated to the new version of YouTrack from the old one, then at the first start of the applet, a message will appear about the possibility of disabling the old applet. If you agree, then the Disable deprecated Screenshot Applet checkbox is selected in your profile. If you just installed a new version of YouTrack, and you did not have the previous one, then this box will be the default for all users you create in it.
For those to whom the old editor is still more convenient, we left the opportunity to go back. To do this, go to your profile settings ( Username | Profile ) and remove the " Disable deprecated Screenshot Applet " checkbox there .
YouTrack uses the usual for modern security settings system: users are grouped, groups are assigned roles, roles are delegated to perform different actions (read issue, update issue, delete user, etc.) It is recommended to follow this scheme, although it is technically possible to assign the role is not a group, but an individual user.
In YouTrack Harmony, the administration interface for users, groups, and roles has improved significantly, and the filtering capabilities of the user list have expanded:
The new YouTrack improved search. You can now combine search terms with and (for example, tag documentation AND tag important), and use parentheses in conditional expressions, for example, (Affected versions: 5.1 or Priority: Critical) and Fix versions: 5.2.
It also became possible to search for issues with a field value in which there are several keywords. For example, summary: customer and summary: report as a result will issue only those tickets that contain both customer and report in the summary field.
One of the main advantages of YouTrack is the ability to perform any action using the keyboard, without a mouse. Now you can not only use convenient keyboard support, but also customize hot key combinations. Settings apply to all projects and users on the server; you can configure hotkeys for the task list and for the Agile board.
You can view hotkeys by Ctrl + / .
You can customize your key scheme in the Administration | Server settings. Global :
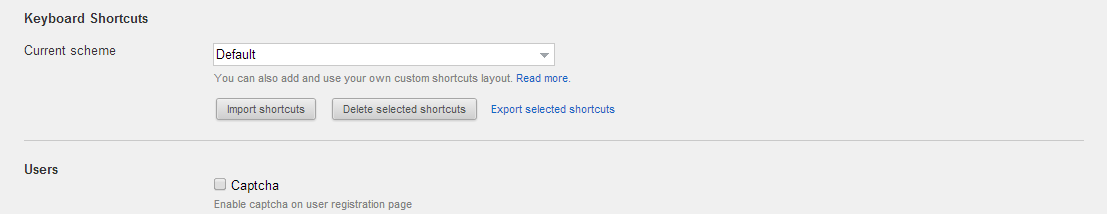
To complete the setup, click Export selected shortcuts , edit the resulting file, and then execute Import Shortcuts . This is the path of a true Jedi, because the export is done in JSON, and it must be edited. Here is a detailed description of the process .
We hope that YouTrack is even easier and more predictable to use and will be grateful for your feedback. If you write them to our tracker , you can appreciate not only the new interface, but also how quickly we respond to your messages. Thank!
In YouTrack 6.0, an information panel (dashboard) appeared to help both development teams and project managers, a lot of new reports, a new screenshot editor, and improved management of groups and access rights.
')
The new version of YouTrack is modestly called YouTrack Harmony. In teams that use principles and approaches of agile, its new features will definitely be in demand (if at the conferences our colleagues are not sly, saying what exactly they lack in our tracker).
Information panel
Information panel (Dashboard) is available by clicking on the logo in the main menu.
Here you can find everything that you may need in your project (except for hands and brains).
You can add as many widgets as you want to on the board (just like on the Yandex website, right? * )
Widgets can be of three types: reports, top issues and notes. Those. reports, the most important tasks and notes (which you create yourself, as stickers on the monitor). Each widget can be customized, for example, to define a search query for top issues, so that this widget displays exactly the tasks that are important to you.
Reports
YouTrack Harmony has 17 different reports. They are divided into progress reports (Timeline reports) and project status reports (Snapshot reports). Project progress reports provide a picture of how indicators change over time, and status reports show the status at a specific point or period.
Project progress reports
Project progress reports include:
- Burndown hart
- Fixed vs Reported rate
- Verified vs Reopened rate
- Resolved vs New / Reopened rate
- Resolution time
- Average issue age
- Cumulative flow
Burndown chart is a well-known to followers of agile practices that bring the number of tasks done to the optimum, comparative graphs (for example, Fixed vs Reported rate) show whether the team is overloaded from incoming tasks or everything goes smoothly, and one of the most interesting graphs is Average issue age, the change in the average time that your tasks spend in a certain state.
The average time the task is in a certain state
To build a graph of Average issue age, moving averages are used - functions familiar to some of those present from financial analysis. The moving average at each point in time is calculated for a given previous period (for example, a week). The moving average is used to smooth the graph by eliminating excessive deviations. For example, if most of the tasks in a project are in the In Progress state for 5 days, and some task has been hanging there for 25 days, then with a relatively small number of tasks it will make a large contribution to the average value. But if we calculate not just the average for the entire project time, but only for the last 7 days, for example, then such a task will not give a large contribution. When calculating the moving average, it will be assumed that it hangs in In Progress for only 7 days (for the fact that outside the window of our choice in 7 days is simply not taken into account).
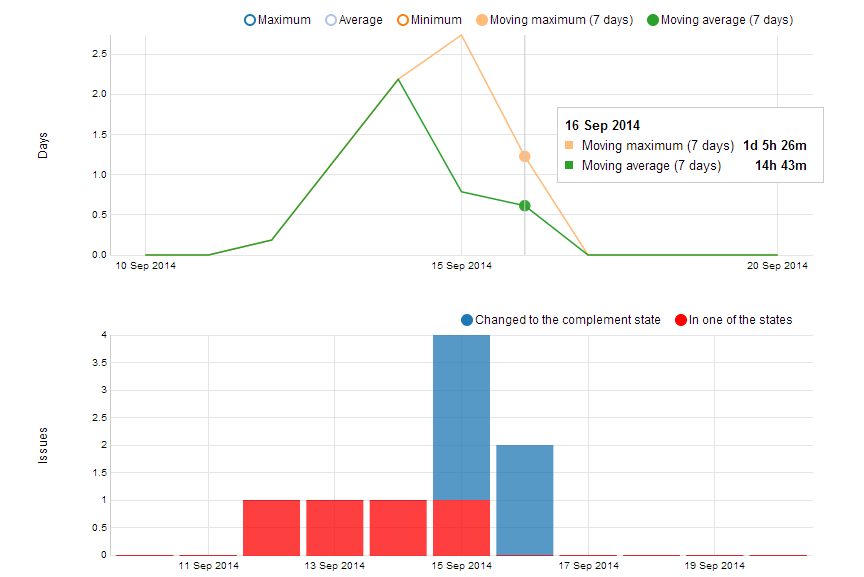
When you select the report Average issue age, two graphs are plotted - the average itself (by default, the moving average is shown, the other curves on the chart turn on with colored buttons above it) and the number of tasks that passed from the state of interest to some other state. Which state is interesting - In Progress or another, is indicated when creating the schedule. At any time, this setting can be changed, and then the schedule will be recalculated.
In addition to state (State), you can use other fields with enumerated values. For example, you can follow the transfer of tasks from one type to another (Bug -> Feature).
The upper graph shows data on the residence time of tasks in the In Progress state and on the number of tasks.
For each point on the graph, moving maximum is the maximum value over the previous 7 days, moving average is the average over the previous 7 days.
The bottom chart for each day shows the number of tasks transferred from the In Progress state to another state (blue bars) and the number of tasks remaining in the In Progress state.
Status reports
Status reports have a basic report that can be flexibly configured, Issues per two fields, and several predefined reports on this database, such as Issues per assignee, Issues per project, Issues per arbitrary field. In addition, there is the State transition report, the Matrix report, and several other reports that are not a special case of the Issues per two fields.
Let's take a closer look at the Issues per two fields report. When you create a report, you must specify the name of the report, the project (s) by which it is built, which fields should be postponed by the X and Y axes. You can also refine the search query (if you need to filter only part of the tasks in the report), adjust the type of report and scope . By default, only the one who created it will see the report.
For example, to see which of my colleagues puts me more tasks, I can specify the query "Assignee: me". At the same time, you can see how they are prioritized.
It turned out, as it is easy to see, as if in a ditty: the most of the tasks I set myself.
Chastushka (if anyone did not know):
The children argued in the country,
Who terrier biting.
It turned out that biting
At the very hostess cottages.
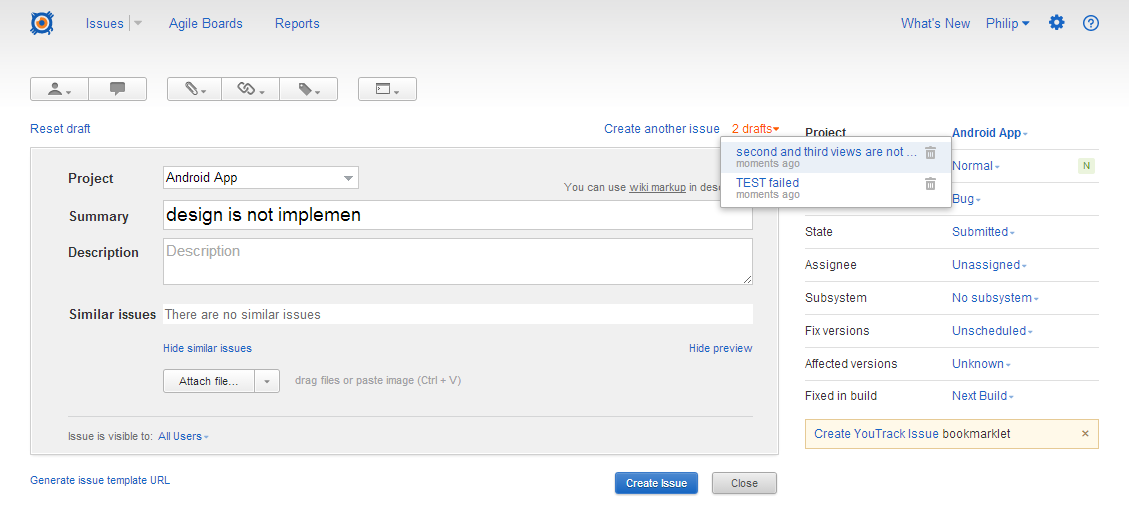
Work with multiple task drafts
If you started describing a task or a problem and abandoned it halfway (and so - several times), then YouTrack will now remember all the drafts. You can open several drafts in different browser tabs and edit them at the same time, and also return to the task that you started to describe earlier, or delete the description that has become unnecessary.
Image editor
We rewrote the image editor. Now it works right in the browser, and you no longer have to bother with Java updates to launch the applet. To attach a screenshot to the task in YouTrack, you need to do it using PrtScr (Windows, Linux) or Cmd + Ctrl + Shift + 4 (Mac OS), paste it into the task description or comment (for example, using Ctrl + V or Cmd + V ), and then in the editor, trim the excess, emphasize the important or cover up the private:
If you updated to the new version of YouTrack from the old one, then at the first start of the applet, a message will appear about the possibility of disabling the old applet. If you agree, then the Disable deprecated Screenshot Applet checkbox is selected in your profile. If you just installed a new version of YouTrack, and you did not have the previous one, then this box will be the default for all users you create in it.
For those to whom the old editor is still more convenient, we left the opportunity to go back. To do this, go to your profile settings ( Username | Profile ) and remove the " Disable deprecated Screenshot Applet " checkbox there .
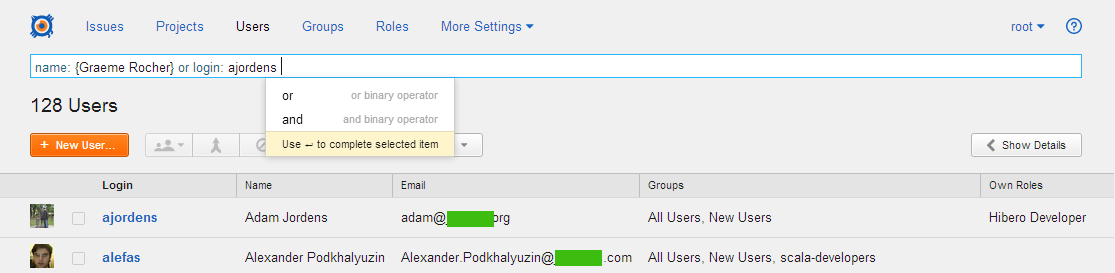
Users, groups, roles and assignment of access rights
YouTrack uses the usual for modern security settings system: users are grouped, groups are assigned roles, roles are delegated to perform different actions (read issue, update issue, delete user, etc.) It is recommended to follow this scheme, although it is technically possible to assign the role is not a group, but an individual user.
In YouTrack Harmony, the administration interface for users, groups, and roles has improved significantly, and the filtering capabilities of the user list have expanded:
Using AND in search queries
The new YouTrack improved search. You can now combine search terms with and (for example, tag documentation AND tag important), and use parentheses in conditional expressions, for example, (Affected versions: 5.1 or Priority: Critical) and Fix versions: 5.2.
It also became possible to search for issues with a field value in which there are several keywords. For example, summary: customer and summary: report as a result will issue only those tickets that contain both customer and report in the summary field.
Customize Hot Keys
One of the main advantages of YouTrack is the ability to perform any action using the keyboard, without a mouse. Now you can not only use convenient keyboard support, but also customize hot key combinations. Settings apply to all projects and users on the server; you can configure hotkeys for the task list and for the Agile board.
You can view hotkeys by Ctrl + / .
You can customize your key scheme in the Administration | Server settings. Global :
To complete the setup, click Export selected shortcuts , edit the resulting file, and then execute Import Shortcuts . This is the path of a true Jedi, because the export is done in JSON, and it must be edited. Here is a detailed description of the process .
We hope that YouTrack is even easier and more predictable to use and will be grateful for your feedback. If you write them to our tracker , you can appreciate not only the new interface, but also how quickly we respond to your messages. Thank!
Source: https://habr.com/ru/post/239385/
All Articles