sketchometry - dynamic geometry in the browser
sketchometry is an interactive dynamic geometry, web application developed based on the JSXGraph library. This article is a tutorial on its use.
To see what it is, go to the site sketchometry . We press the big round bloambu in the upper right corner with the inscription "start sketchometry" - and in front of us is a drawing board with a toolbar at the top. On different devices it looks different, exactly how you can get an idea by changing the width of the window.
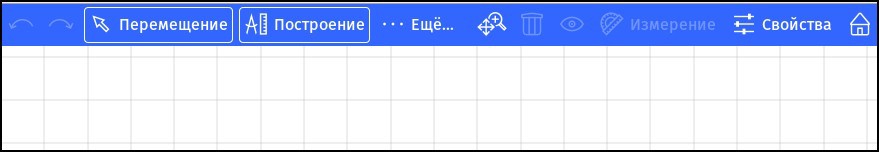
On my laptop, the upper part with the toolbar looks like this:
')
On the left, we see the undo and redo buttons.
To the right are buttons that enable or disable the move and build modes. If the button is highlighted, then the mode is enabled, if not - disabled. By default, both modes are enabled.
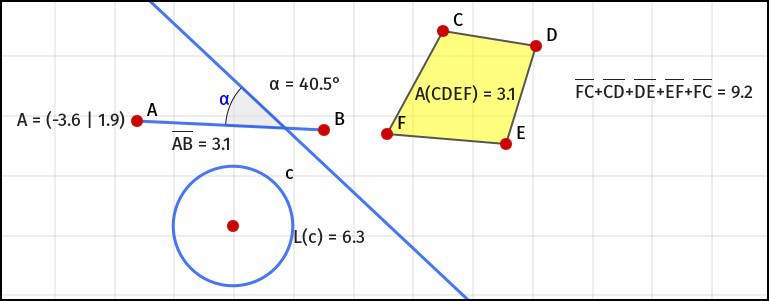
Well, since the build mode is on, let's build something.
Most of the constructions are performed with gestures with a mouse or finger. The description of gestures is here (short in English and German) and here (in German).
In addition to the gestures presented in the table, there are two more ways to build a circle based on the objects already available - a circle and a segment. In both cases, you must press the left key and hold for a few seconds. In the first case, the existing circle is copied. In the second, a circle is built, the radius of which is equal to the original segment. In both cases, without releasing the keys, the circle can be moved to the right place and there to quit.
We move further to the right on the main toolbar. The next button, “More ...”, opens the additional construction toolbar.

Using the tools of this panel, you can build:
Continue familiarity with the main toolbar.
The next tool is Scale / Navigation.

Scaling commands:
The next one is a tool for deleting objects, a basket. Deleting is done with a simple click, without asking for confirmation. But the cancellation of action is possible even after reloading the page.
Next - instrment "Eye" (hide / show objects).
The next tool is a measurement tool.
You can measure almost everything (except the function graph). However, in the case of measuring the straight line and the ray, we obtain NaN.
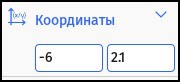
When measuring a point, we get its coordinates. And in the rest of cases, everything is quite expected - length, area, angles.
If you select several objects (for points it is impossible), we get the sum of measured values.
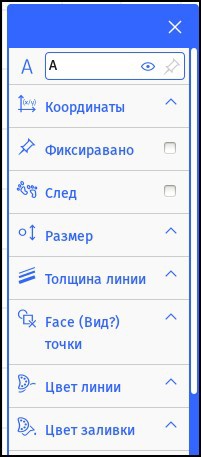
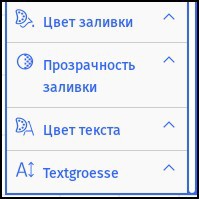
And finally, the last actual tool - properties.
Here, in general, everything is clear. Each window is, in essence, a menu for selecting a property value. Selecting some items opens additional fields.
For example:
Similar additional fields appear in other windows.
Let's get acquainted with other dialogues.
The rest of the window as a whole, perhaps, does not make sense. Their differences are only in small details.
The last (rightmost) button in the main toolbar is the exit to the gallery. The gallery looks like this: We see that each drawing in the gallery has its own window, which is flipped through with a mouse click or a gesture.
Each window has a toolbar and, in addition, there is a gallery toolbar.
Let's start with the gallery panel.
Pressing "New" we just get on a clean board.
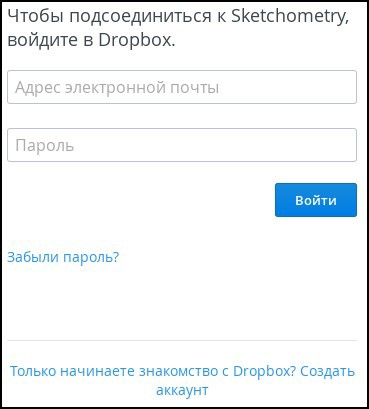
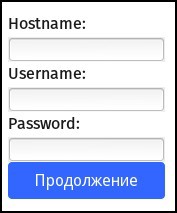
By clicking "Import" you can import a drawing from the clouds:

In the first three cases, the authentication forms open in a separate window. In the fourth - on the spot. That's what they look like (for example - Dropbox and WebDAV).
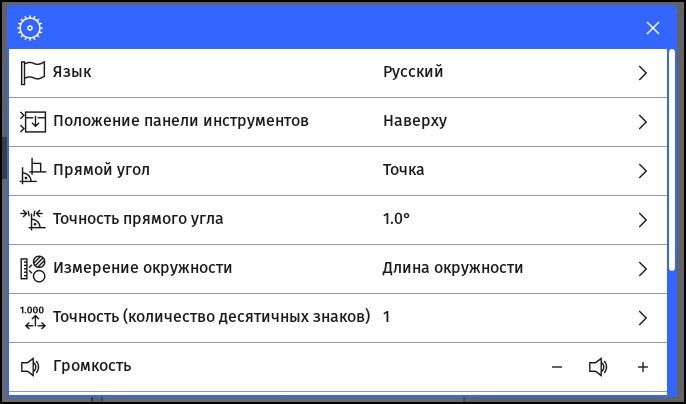
The next button is settings.

The Help button is simply a link to http://www.sketchometry.org/help/
We now turn to the drawing window.
On the left we see the name of the drawing. It is editable in place.
On the right, the first button is export to the cloud. It opens almost the same window as the "Import from the Cloud" button. The difference in the last line:
This line allows you to save a drawing on your computer, while specifying the file format (the file format can be set when saving to other clouds). What are these formats:
And the last thing to say is about the right two buttons. This is cloning and deleting a drawing.
That's all.
Well, it was, so to speak, a fairy tale. And now…
These are three spoonfuls of tar.
To see what it is, go to the site sketchometry . We press the big round bloambu in the upper right corner with the inscription "start sketchometry" - and in front of us is a drawing board with a toolbar at the top. On different devices it looks different, exactly how you can get an idea by changing the width of the window.
Toolbar
On my laptop, the upper part with the toolbar looks like this:
')
On the left, we see the undo and redo buttons.
To the right are buttons that enable or disable the move and build modes. If the button is highlighted, then the mode is enabled, if not - disabled. By default, both modes are enabled.
Well, since the build mode is on, let's build something.
Constructions
Most of the constructions are performed with gestures with a mouse or finger. The description of gestures is here (short in English and German) and here (in German).
| Building | Gesture | Result |
|---|---|---|
| Point |  |  |
| Straight |  | 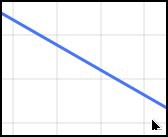 |
| Circle | 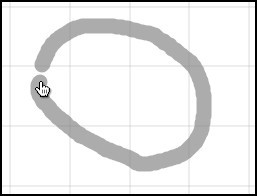 | 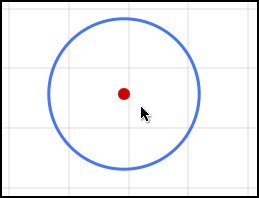 |
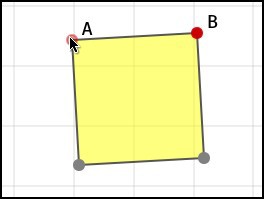
| Triangle | 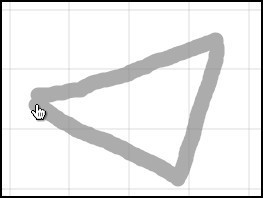 | 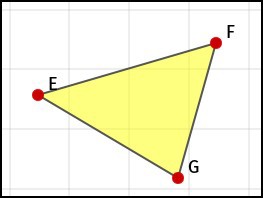 |
| Four square | 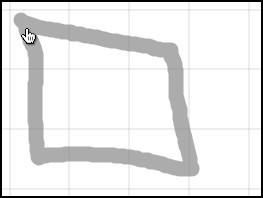 |  |
| Circle center and point | 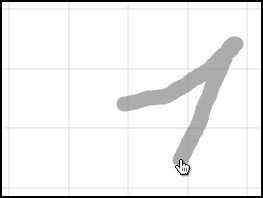 | 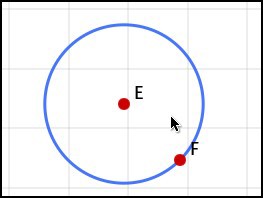 |
| Ray |  |  |
| Straight through point | 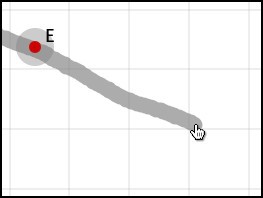 |  |
| Circle through point | 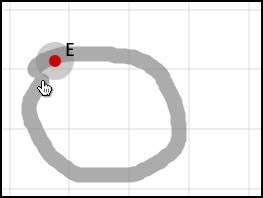 | 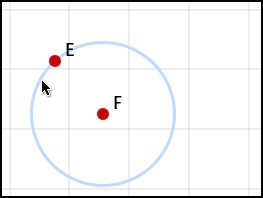 |
| Straight through two points |  |  |
| Ray at two points | 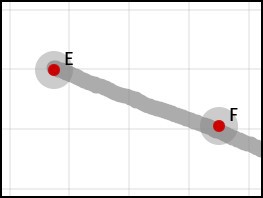 | 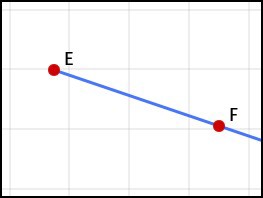 |
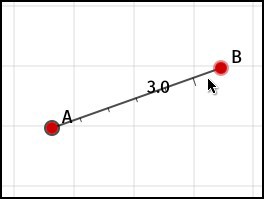
| Section |  | 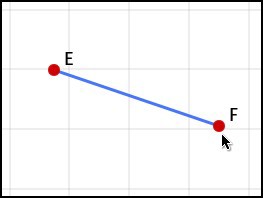 |
| Circle center and point | 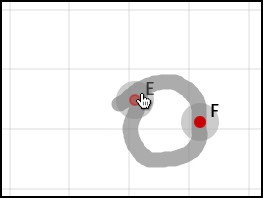 | 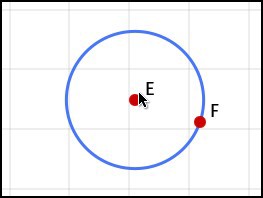 |
| Mid point | 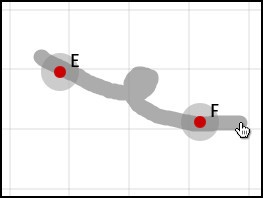 |  |
| Reflected point |  | 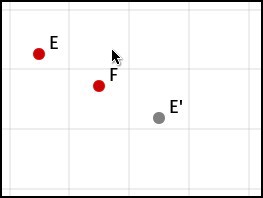 |
| "Free" perpendicular | 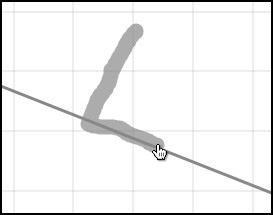 | 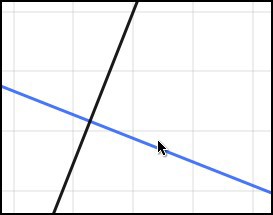 |
| Perpendicular through the point on the line | 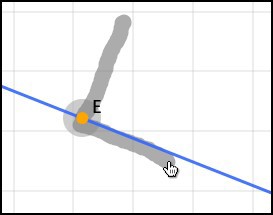 | 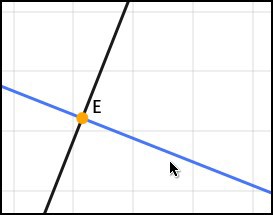 |
| Perpendicular segment through the free point | 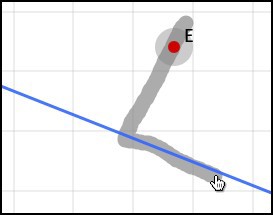 | 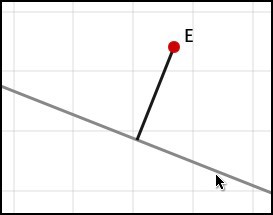 |
| Perpendicular straight through free point |  | 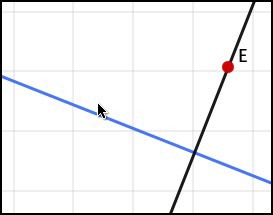 |
| Parallel straight | 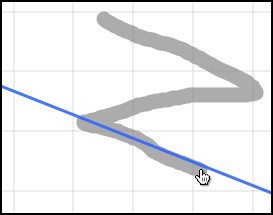 | 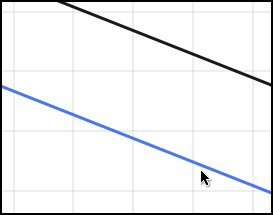 |
| Parallel line through a given point | 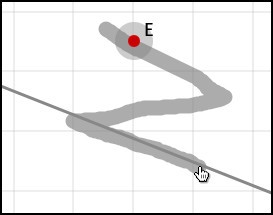 |  |
| Point reflection | 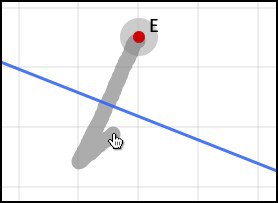 | 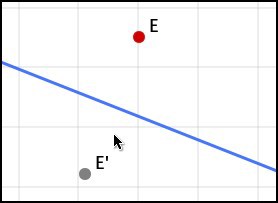 |
| Bisector | 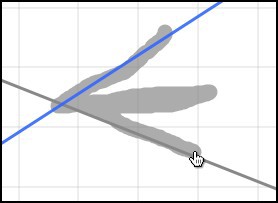 | 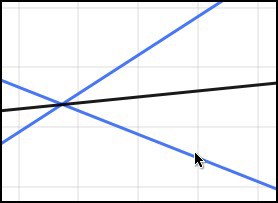 |
| Angle | 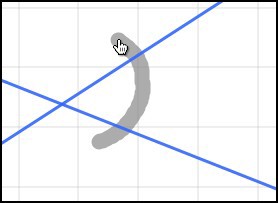 |  |
| Three Point Circumference |  |  |
| Sector on three points | 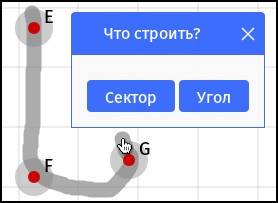 | 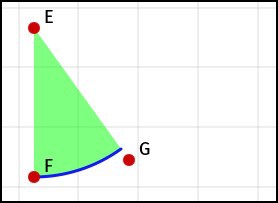 |
| Three point angle |  | 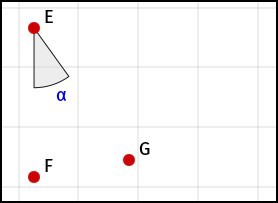 |
| Polygon | 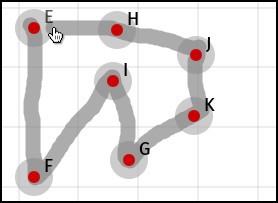 | 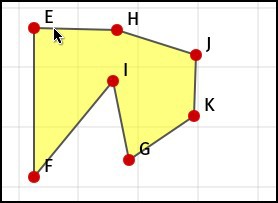 |
| Tangent | 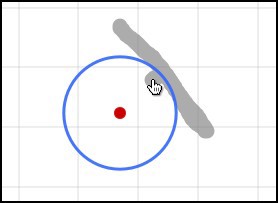 |  |
In addition to the gestures presented in the table, there are two more ways to build a circle based on the objects already available - a circle and a segment. In both cases, you must press the left key and hold for a few seconds. In the first case, the existing circle is copied. In the second, a circle is built, the radius of which is equal to the original segment. In both cases, without releasing the keys, the circle can be moved to the right place and there to quit.
We move further to the right on the main toolbar. The next button, “More ...”, opens the additional construction toolbar.
Using the tools of this panel, you can build:
- Graph function.
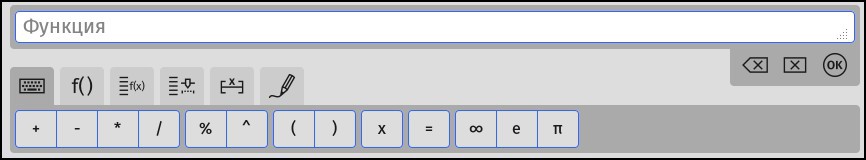 Here we see the function input field and below are several tabs. The first is a tab for entering some characters. The remaining characters are entered from the keyboard. Yes, and these can also be entered from the keyboard.
The second tab is the selection of a predefined function from the list.
The third tab is the selection of a function from the list of those already built.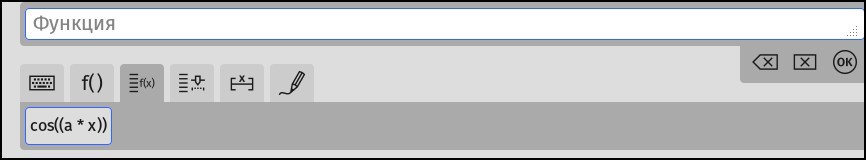 The fourth tab is a selection of a slider from the list. Its current value will be used.
  The fifth tab is the setting of the function definition area.
  The sixth is a handwriting tab.
- The angle of three points.
Choose three points (the vertex should be the second one), we get the angle.

- Sector on three points.
Select three points (the center should be the second in this case), we get a sector.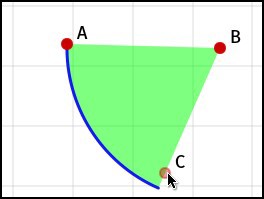
- Correct polygon.
By selecting this tool, we set the number of sides and then select two points that define one of the sides.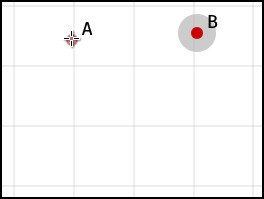
- Ruler.
This is essentially a segment with divisions, next to which its length is shown.
To measure, for example, the distance between points, select the “Ruler” tool, click on one of the points, and then drag the other end of the ruler to the second point.
- Slider

- Text.
It looks almost the same as the function graphing tool. The only difference is that the “value” button appeared on the right, which inserts the value of a slider or function with a given argument.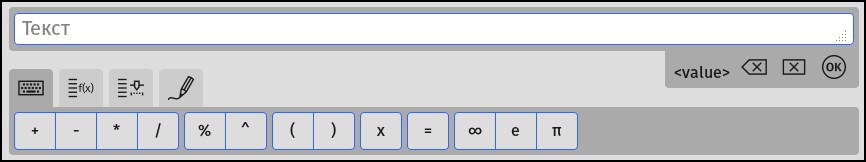
Toolbar - continued
Continue familiarity with the main toolbar.
The next tool is Scale / Navigation.
Scaling commands:
- Reduce.
- Return the original.
- Zoom.
- To the left.
- Up.
- In the middle.
- Way down.
- To the right.
The next one is a tool for deleting objects, a basket. Deleting is done with a simple click, without asking for confirmation. But the cancellation of action is possible even after reloading the page.
Next - instrment "Eye" (hide / show objects).
The next tool is a measurement tool.
You can measure almost everything (except the function graph). However, in the case of measuring the straight line and the ray, we obtain NaN.
When measuring a point, we get its coordinates. And in the rest of cases, everything is quite expected - length, area, angles.
If you select several objects (for points it is impossible), we get the sum of measured values.
And finally, the last actual tool - properties.
Object properties settings windows
| Board properties | Point properties | Point properties, bottom |
|---|---|---|
 |  |  |
For example:
| Input point coordinates | Point size | Dot shape | Fill point color (upper right corner - no fill) |
|---|---|---|---|
 |  |  |  |
Let's get acquainted with other dialogues.
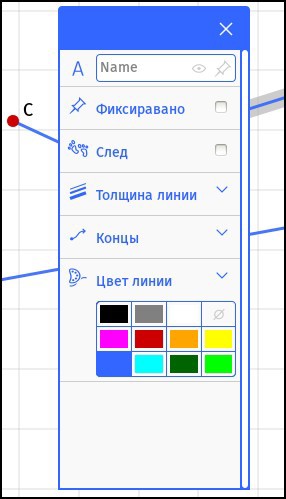 | This is the settings dialog for straight lines, rays and segments. Here the only new thing is the ability to specify the type of ends. The first two buttons specify whether the beam or a segment extends beyond the boundaries. That is, the segment may look like a straight line. The right two buttons set the ends of the lines in the form of arrows. Moreover, in the case of a ray and a straight line, the ends are counted on the border of the visible area of the drawing. If a continuation beyond the boundary of a segment or ray is given, too. |
The rest of the window as a whole, perhaps, does not make sense. Their differences are only in small details.
| The circle properties window has an additional radius input field. | 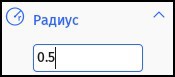 |
| The function properties window has an additional function input field. If you click there, the graph window will open, which we have already reviewed. |  |
| In the slider properties window there are input fields for the interval of values and the step of changing the value. |  |
| In the properties window of the polygon, you can set the ability to move it and whether it will leave a trace. By the way, many objects can leave a mark. | 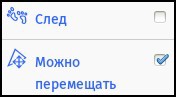 |
Gallery
The last (rightmost) button in the main toolbar is the exit to the gallery. The gallery looks like this:
We see that each drawing in the gallery has its own window, which is flipped through with a mouse click or a gesture.Each window has a toolbar and, in addition, there is a gallery toolbar.
Let's start with the gallery panel.
Pressing "New" we just get on a clean board.
By clicking "Import" you can import a drawing from the clouds:
In the first three cases, the authentication forms open in a separate window. In the fourth - on the spot. That's what they look like (for example - Dropbox and WebDAV).
The next button is settings.
The Help button is simply a link to http://www.sketchometry.org/help/
We now turn to the drawing window.
On the left we see the name of the drawing. It is editable in place.
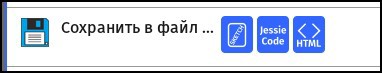
On the right, the first button is export to the cloud. It opens almost the same window as the "Import from the Cloud" button. The difference in the last line:
This line allows you to save a drawing on your computer, while specifying the file format (the file format can be set when saving to other clouds). What are these formats:
- The sketch is the format in which the geonext program saved the drawings, developed by the same Bayrotsk University as sketchometry and the JSXGraph library on which sketchometry is based.
- Jessie Code is a file containing a drawing as text in JessieCode language. And JessieCode is a highly specialized language - a superstructure over JSXGraph. JessieCode syntax can be found here , and practice - here .
- HTML - page containing script on JessieCode.
And the last thing to say is about the right two buttons. This is cloning and deleting a drawing.
That's all.
Well, it was, so to speak, a fairy tale. And now…
Afterstory
- About the license. As such, the license text is nowhere to be found. Only somewhere on the side it says that
sketchometry is free to use. It can be used for education purposes. For commercial usage please get in contact with the address in the imprint .
- The work on sketchometry is still far from finished, therefore, besides features, there are glitches. The most serious is the complete disappearance of the drawing when you try to perform some actions. I met this when changing the visibility of the slider and when trying to force the polygon to leave a trace (I really don’t know why this may be necessary, but still).
- It would be desirable, of course, to show real learning tasks, but they are not there yet.
These are three spoonfuls of tar.
Applications
Source: https://habr.com/ru/post/239259/
All Articles