Testing for mobile devices: emulators, simulators and remote debugging
In the old days of developing mobile sites and applications debugging was a difficult task. Yes, it was possible to get the device and quickly check the work - but what could you do if you found a bug?
With no debugging tools, you had to rely on different hacks. In general, they boiled down to attempts to reproduce the bug in the desktop browser and then catch it using Chrome Developer Tools or somewhere else. For example, it was possible to reduce the size of the browser window or change the user agent.
Roughly speaking, these hacks did not work. If you rule a bug on the desktop, you are not sure that it is fixed on a mobile device (MU). Therefore, we had to constantly rush between the device and the desktop.
')
Now we have a set of tools that allow you to receive meaningful data directly from the MU. In addition, you can use desktop tools for debugging directly to the MU.
In this article we will examine several emulators and simulators that allow you to quickly and easily test sites and applications. Then look at the tools for remote debugging, allowing you to connect to the MU.
Testing on physical devices is justified. But this does not mean that you do not need to test on emulators and simulators. They allow you to expand the tested set of devices and check the changes on the fly.
For testing apple devices, iPhones and iPads, there are several options. The first among them is the official Apple iOS Simulator, included in the Xcode distribution. Allows you to test different combinations of software and hardware - but only on a Mac.
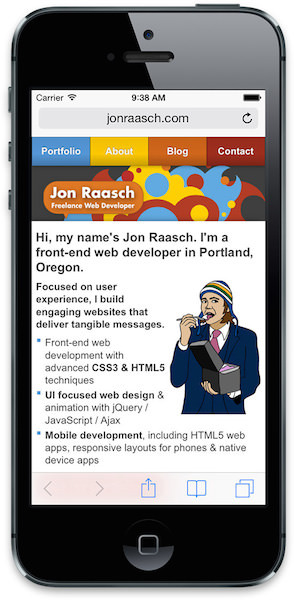
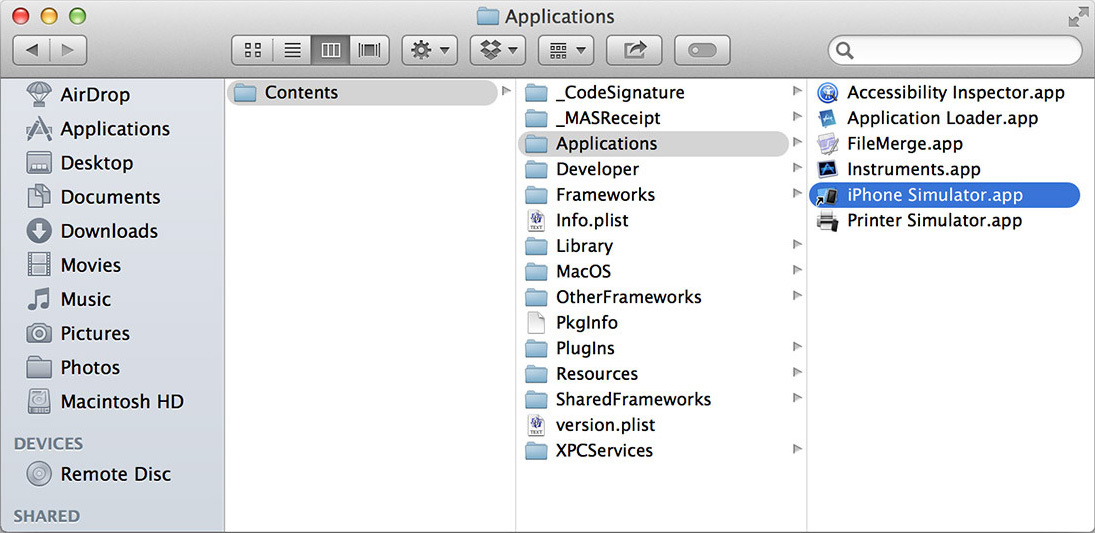
Install and run Xcode. Then RMB and select “Show Package Contents”. Then go through “Contents” → “Applications” → “iPhone Simulator.”
Although it is not easy to find it, it is easy to use the simulator. Open Safari in the simulator and test your site. You can switch between different iPhone and iPad devices, change the iOS version, rotate the device, etc.
If you don't have a Mac, you'll have to bother. You can take iPadian , iPad simulator for Windows. In addition to it, there are several other options, in particular online . But to be honest, they are not particularly good.
The android emulator is cross-platform. Unfortunately, it is difficult to configure.
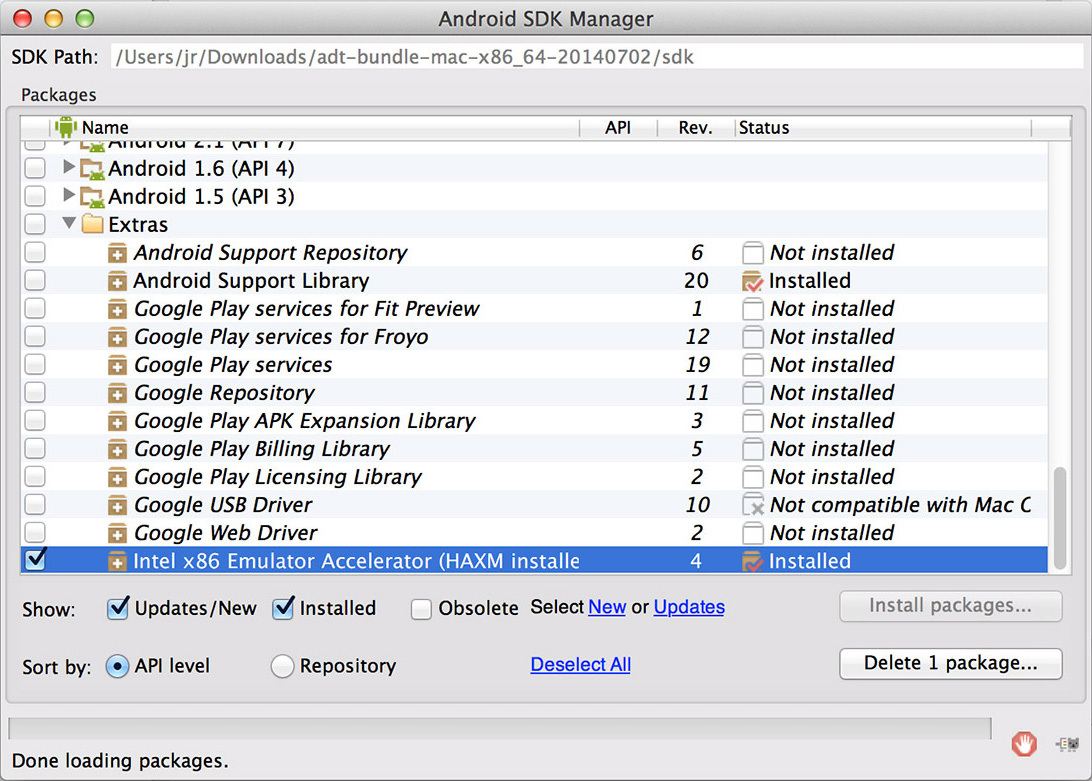
To get started, download a compilation including Android Development Tools (ADT) for Eclipse and Android software development kit (SDK). Then follow the installation instructions , do not forget to install the “Intel x86 Emulator Accelerator (HAXM installer)” as well as the default settings. You will also need to install HAXM (IntelHaxm.dmg on Mac and IntelHaxm.exe on PC).
Then create an Android virtual device (AVD) for the device under test. The AVD Manager has a list of ready devices in “Device Definitions”. To get started, select one of them and click “Create AVD”
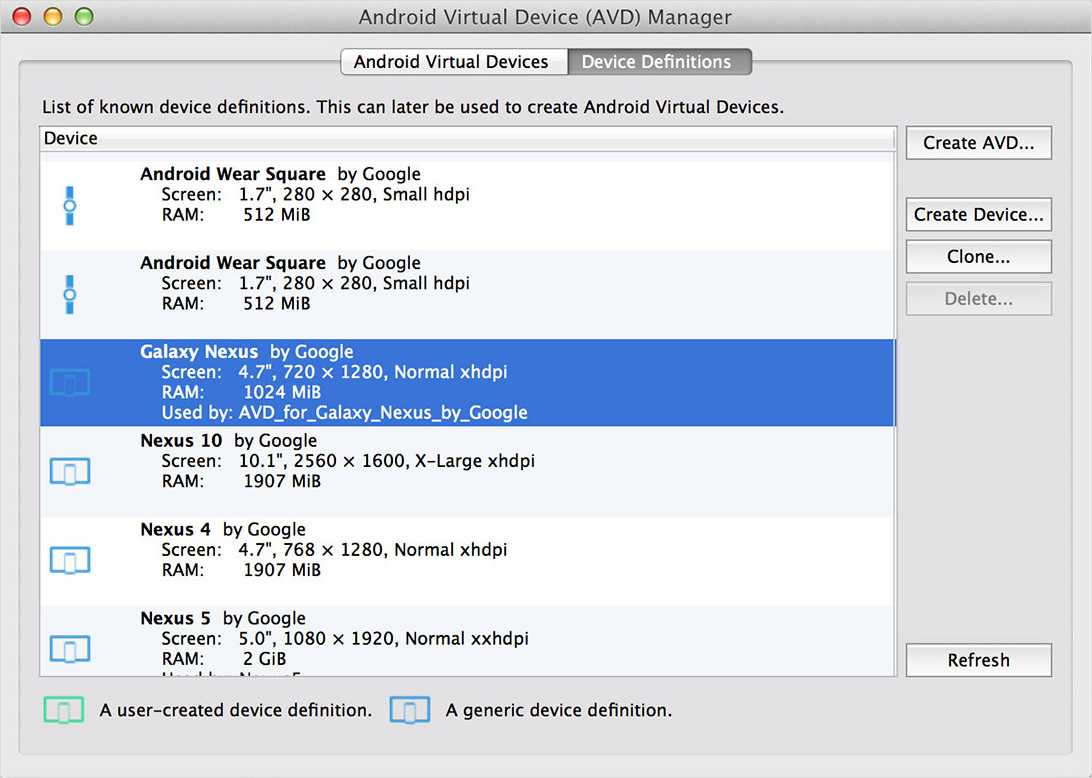
Select any CPU, and put “No skin“ and “Use host GPU”. Now you can launch a virtual device and use the Android browser for testing.

It does not hurt to learn keyboard commands for more convenient interaction with the emulator.
Alternatively, you can use the Manymo - emulator, embedded in the browser. It can even be embedded in the page.
Other simulators and emulators:
Blackberry
Windows Phone Emulator for Windows 8
Opera Mini Emulator
Emulators and simulators are useful, but not 100% reliable. You should always try to conduct testing on the maximum number of real devices.
But this does not mean that you need to buy them all. You can use the services of remote testing services that offer a web interface for testing on remote devices. You will be able to interact with the phone and see its screen.
For testing devices from Samsung, such as the Galaxy S5, you can use the Samsung Remote Test Lab services for free - they provide for testing a large selection of their devices.
You can also use Keynote Mobile Testing resources. They are not cheap, but the number of available devices is amazing, and some can be used for free.
If you need physical devices, you can contact the Open Device Lab , where there is a list of the closest available testing laboratories.
Remote debugging on the MU reveals many difficulties. For example, how to get meaningful data from a small, relatively deadly device?
Remote debugging tools provide an interface for connecting to the MU from the desktop. Thus, we work with data from real devices on a powerful desktop computer.
With the release of the 6th version of Apple introduced a tool for debugging MU via Safari Web Inspector.
First you need to enable remote debugging on the device. “Settings” → “Safari” → “Advanced” and enable “Web Inspector”
Then connect the device to the computer via USB. Then open Safari (versions no less than 6) and in “Preferences” → “Advanced” select “Show Develop menu in menu bar”.
In this menu, you will see your device and several pages with settings.
Each page contains many tools, DOM Inspector and the like.
Besides the DOM Inspector, iOS 'you can use:
- time schedule for viewing network requests, layout and rendering pages, JavaScript work
- debugger with the ability to set breakpoints
- javascript console
All this is described in detail in the “ Safari Web Inspector Guide ”.
As in the case of the iOS simulator, remote debugging can only be done with Mac.
In the case of Android, remote debugging tools allow you to work from your desktop using Chrome's Developer Tools. In addition, these tools are again cross-platform.
First, on your phone, go to “Settings” → “About Phone” (for Android 4.4+), or “Settings” → “About Tablet”. Then you need to click on “Build Number” seven times. Other than jokes. After that you will see a message about the developer.
Then back to the main settings of the “Developer Options” you need the item “USB debugging”.
In the address bar of your Chrome browser, type about: inspect. Allow “Discover USB devices”, and you will see your MU in the menu.
You should also see open bookmarks in a mobile browser. Select the one you need and you will be available:
DOM Inspector,
Network panel with external resources
Source panel for JavaScript debugging
Javascript console
Details can be found in the tutorial “Introduction to Chrome Developer Tools, Part One.”

You can also do remote debugging in the Android emulator.
If you have to debug an iOS device on Windows, or Linux, or debug a device running under Windows Phone or BlackBerry - try Weinre (web inspector remote). Works everywhere.
The weinre setting is complicated because it must be installed both on the server and on the page. First you need to install Node, and then install the Weinre module:
Then start the debug server (we substitute the ip-address of the computer):
Then go to localhost: 8080 and copy the contents of the tag.
With no debugging tools, you had to rely on different hacks. In general, they boiled down to attempts to reproduce the bug in the desktop browser and then catch it using Chrome Developer Tools or somewhere else. For example, it was possible to reduce the size of the browser window or change the user agent.
Roughly speaking, these hacks did not work. If you rule a bug on the desktop, you are not sure that it is fixed on a mobile device (MU). Therefore, we had to constantly rush between the device and the desktop.
')
Now we have a set of tools that allow you to receive meaningful data directly from the MU. In addition, you can use desktop tools for debugging directly to the MU.
In this article we will examine several emulators and simulators that allow you to quickly and easily test sites and applications. Then look at the tools for remote debugging, allowing you to connect to the MU.
Emulators and simulators
Testing on physical devices is justified. But this does not mean that you do not need to test on emulators and simulators. They allow you to expand the tested set of devices and check the changes on the fly.
IOS simulator
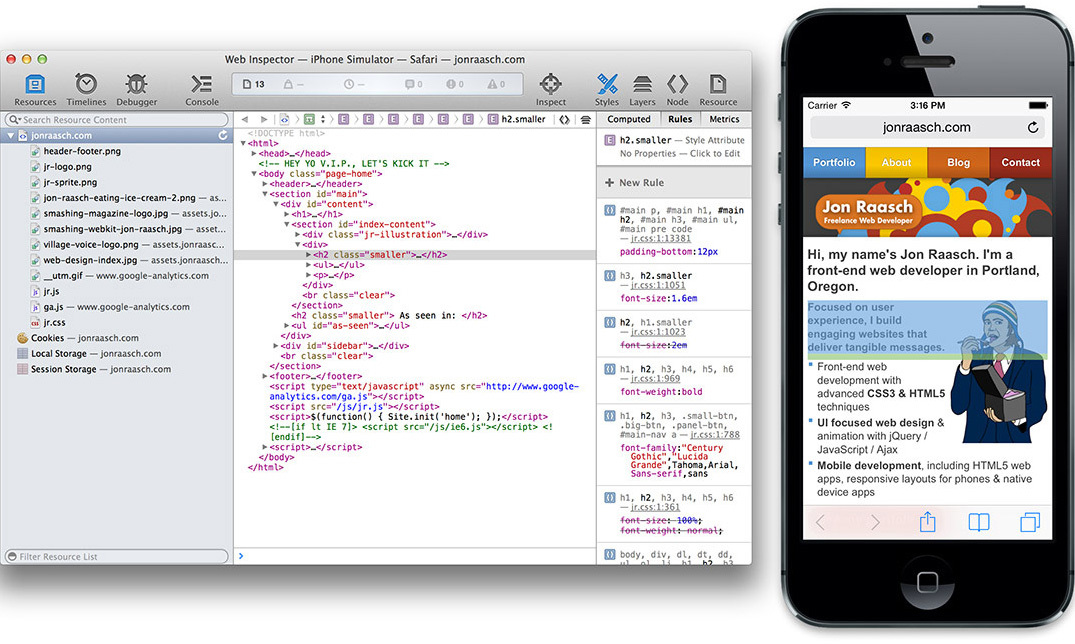
For testing apple devices, iPhones and iPads, there are several options. The first among them is the official Apple iOS Simulator, included in the Xcode distribution. Allows you to test different combinations of software and hardware - but only on a Mac.
Install and run Xcode. Then RMB and select “Show Package Contents”. Then go through “Contents” → “Applications” → “iPhone Simulator.”
Although it is not easy to find it, it is easy to use the simulator. Open Safari in the simulator and test your site. You can switch between different iPhone and iPad devices, change the iOS version, rotate the device, etc.
If you don't have a Mac, you'll have to bother. You can take iPadian , iPad simulator for Windows. In addition to it, there are several other options, in particular online . But to be honest, they are not particularly good.
Android emulator
The android emulator is cross-platform. Unfortunately, it is difficult to configure.
To get started, download a compilation including Android Development Tools (ADT) for Eclipse and Android software development kit (SDK). Then follow the installation instructions , do not forget to install the “Intel x86 Emulator Accelerator (HAXM installer)” as well as the default settings. You will also need to install HAXM (IntelHaxm.dmg on Mac and IntelHaxm.exe on PC).
Then create an Android virtual device (AVD) for the device under test. The AVD Manager has a list of ready devices in “Device Definitions”. To get started, select one of them and click “Create AVD”
Select any CPU, and put “No skin“ and “Use host GPU”. Now you can launch a virtual device and use the Android browser for testing.
It does not hurt to learn keyboard commands for more convenient interaction with the emulator.
Alternatively, you can use the Manymo - emulator, embedded in the browser. It can even be embedded in the page.
Other simulators and emulators:
Blackberry
Windows Phone Emulator for Windows 8
Opera Mini Emulator
Remote Testing
Emulators and simulators are useful, but not 100% reliable. You should always try to conduct testing on the maximum number of real devices.
But this does not mean that you need to buy them all. You can use the services of remote testing services that offer a web interface for testing on remote devices. You will be able to interact with the phone and see its screen.
For testing devices from Samsung, such as the Galaxy S5, you can use the Samsung Remote Test Lab services for free - they provide for testing a large selection of their devices.
You can also use Keynote Mobile Testing resources. They are not cheap, but the number of available devices is amazing, and some can be used for free.
If you need physical devices, you can contact the Open Device Lab , where there is a list of the closest available testing laboratories.
Remote debugging
Remote debugging on the MU reveals many difficulties. For example, how to get meaningful data from a small, relatively deadly device?
Remote debugging tools provide an interface for connecting to the MU from the desktop. Thus, we work with data from real devices on a powerful desktop computer.
iOS
With the release of the 6th version of Apple introduced a tool for debugging MU via Safari Web Inspector.
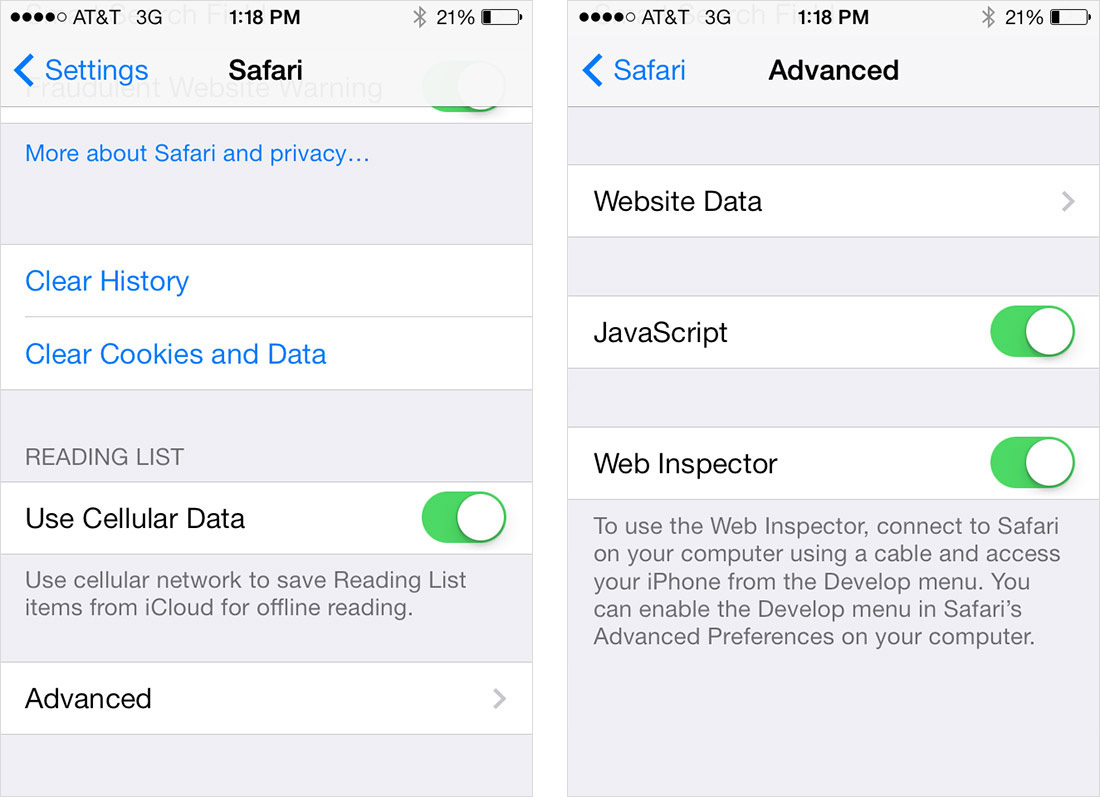
First you need to enable remote debugging on the device. “Settings” → “Safari” → “Advanced” and enable “Web Inspector”
Then connect the device to the computer via USB. Then open Safari (versions no less than 6) and in “Preferences” → “Advanced” select “Show Develop menu in menu bar”.
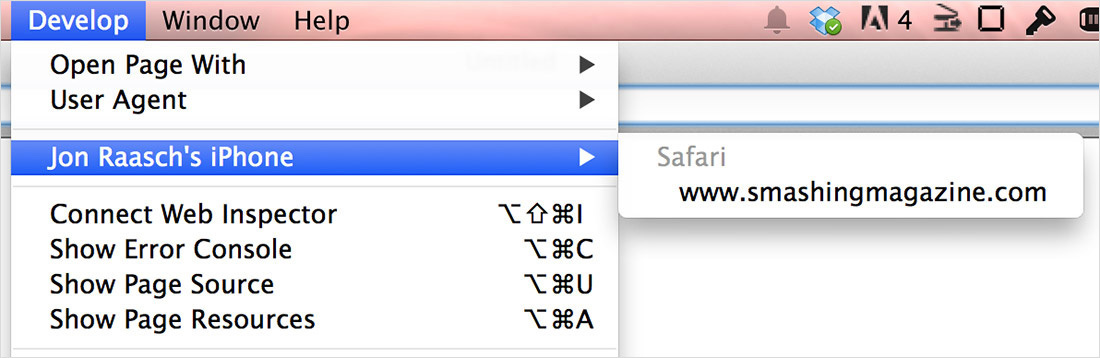
In this menu, you will see your device and several pages with settings.
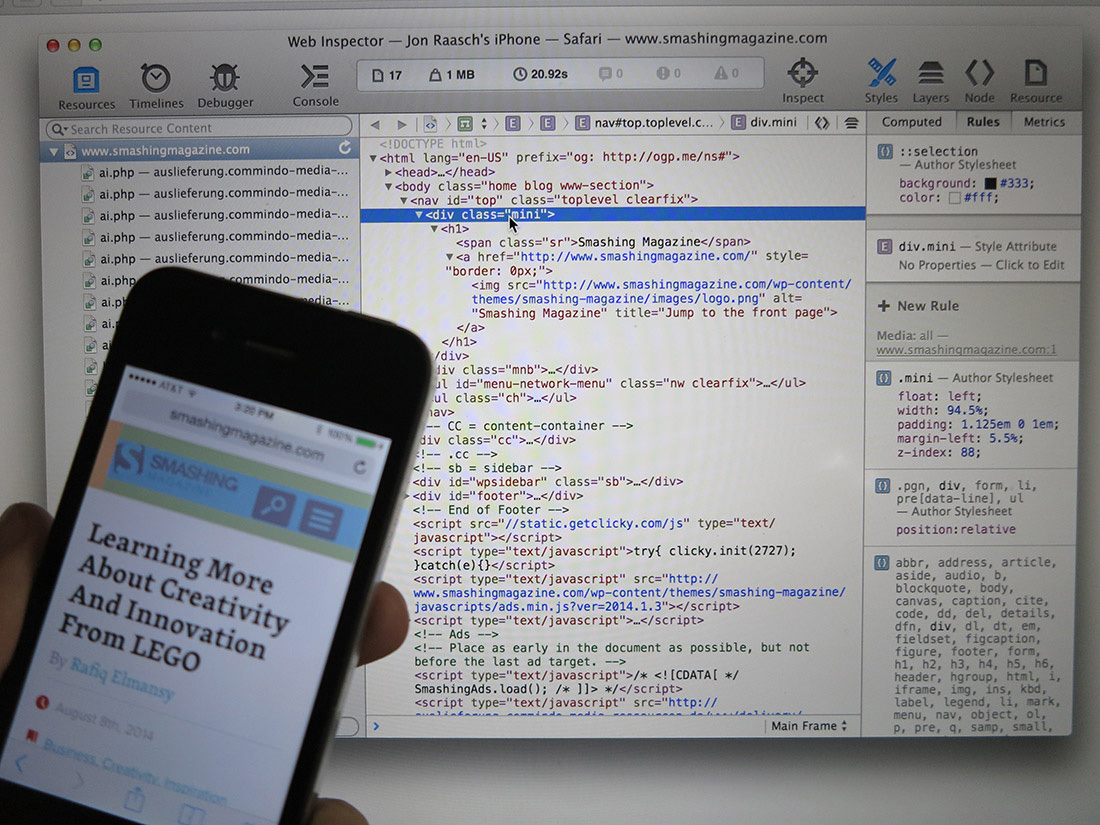
Each page contains many tools, DOM Inspector and the like.
Besides the DOM Inspector, iOS 'you can use:
- time schedule for viewing network requests, layout and rendering pages, JavaScript work
- debugger with the ability to set breakpoints
- javascript console
All this is described in detail in the “ Safari Web Inspector Guide ”.
As in the case of the iOS simulator, remote debugging can only be done with Mac.
Android
In the case of Android, remote debugging tools allow you to work from your desktop using Chrome's Developer Tools. In addition, these tools are again cross-platform.
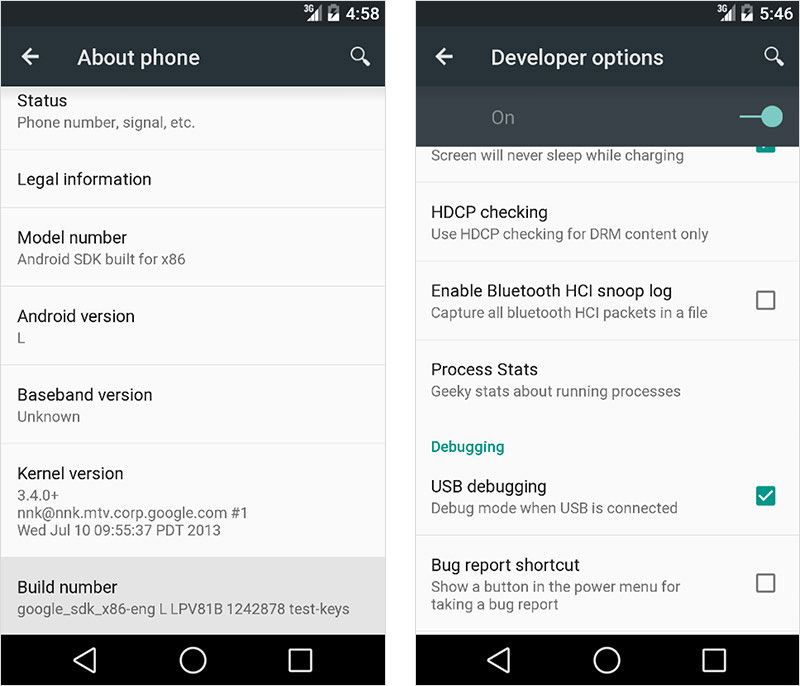
First, on your phone, go to “Settings” → “About Phone” (for Android 4.4+), or “Settings” → “About Tablet”. Then you need to click on “Build Number” seven times. Other than jokes. After that you will see a message about the developer.
Then back to the main settings of the “Developer Options” you need the item “USB debugging”.
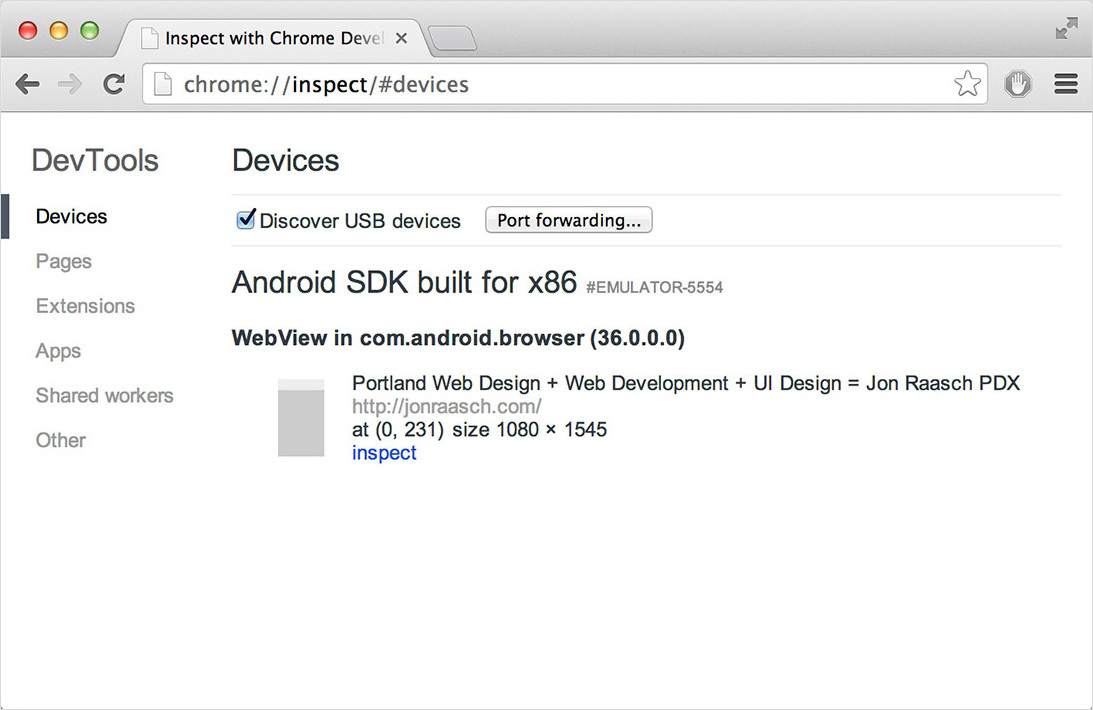
In the address bar of your Chrome browser, type about: inspect. Allow “Discover USB devices”, and you will see your MU in the menu.
You should also see open bookmarks in a mobile browser. Select the one you need and you will be available:
DOM Inspector,
Network panel with external resources
Source panel for JavaScript debugging
Javascript console
Details can be found in the tutorial “Introduction to Chrome Developer Tools, Part One.”
You can also do remote debugging in the Android emulator.
Weinre
If you have to debug an iOS device on Windows, or Linux, or debug a device running under Windows Phone or BlackBerry - try Weinre (web inspector remote). Works everywhere.
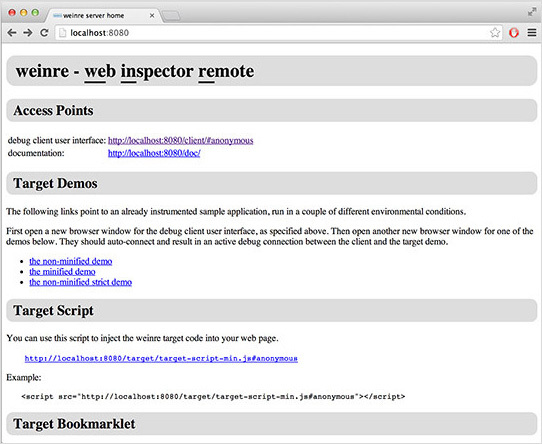
The weinre setting is complicated because it must be installed both on the server and on the page. First you need to install Node, and then install the Weinre module:
npm install –g weinreThen start the debug server (we substitute the ip-address of the computer):
weinre --boundHost 10.0.0.1Then go to localhost: 8080 and copy the contents of the tag.
. .
, user interface for debugging clients (http://localhost:8080/client/#anonymous). , , (targets).

.
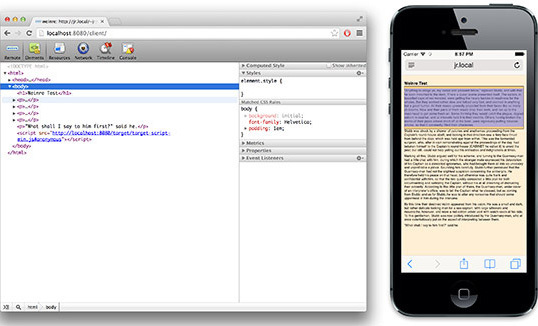
Weinre , , iOS Android. , JavaScript.
Ghostlab.
, , . .
, , .
:
“Mobile Emulators and Simulators: The Ultimate Guide,” Maximiliano Firtman
“Introduction to Chrome Developer Tools, Part One,” Seth Ladd, HTML5 Rocks
“About Safari Web Inspector,” Safari Developer Library, Apple
“Enable Remote Debugging With Safari Web Inspector in iOS 6” Dave Ackerman, Modus Create
“Remote Debugging on Android With Chrome,” Chrome Developer Tools
“Weinre as Remote Debugger,” Mozilla Developer Network. .
, user interface for debugging clients (http://localhost:8080/client/#anonymous). , , (targets).
.
Weinre , , iOS Android. , JavaScript.
Ghostlab.
, , . .
, , .
:
“Mobile Emulators and Simulators: The Ultimate Guide,” Maximiliano Firtman
“Introduction to Chrome Developer Tools, Part One,” Seth Ladd, HTML5 Rocks
“About Safari Web Inspector,” Safari Developer Library, Apple
“Enable Remote Debugging With Safari Web Inspector in iOS 6” Dave Ackerman, Modus Create
“Remote Debugging on Android With Chrome,” Chrome Developer Tools
“Weinre as Remote Debugger,” Mozilla Developer Network
. .


, user interface for debugging clients (http://localhost:8080/client/#anonymous). , , (targets).


.


Weinre , , iOS Android. , JavaScript.

Ghostlab.


, , . .

, , .

:

“Mobile Emulators and Simulators: The Ultimate Guide,” Maximiliano Firtman
“Introduction to Chrome Developer Tools, Part One,” Seth Ladd, HTML5 Rocks
“About Safari Web Inspector,” Safari Developer Library, Apple
“Enable Remote Debugging With Safari Web Inspector in iOS 6” Dave Ackerman, Modus Create
“Remote Debugging on Android With Chrome,” Chrome Developer Tools
“Weinre as Remote Debugger,” Mozilla Developer Network
. .
, user interface for debugging clients (http://localhost:8080/client/#anonymous). , , (targets).
.
Weinre , , iOS Android. , JavaScript.
Ghostlab.
, , . .
, , .
:
“Mobile Emulators and Simulators: The Ultimate Guide,” Maximiliano Firtman
“Introduction to Chrome Developer Tools, Part One,” Seth Ladd, HTML5 Rocks
“About Safari Web Inspector,” Safari Developer Library, Apple
“Enable Remote Debugging With Safari Web Inspector in iOS 6” Dave Ackerman, Modus Create
“Remote Debugging on Android With Chrome,” Chrome Developer Tools
“Weinre as Remote Debugger,” Mozilla Developer Network
. .


, user interface for debugging clients (http://localhost:8080/client/#anonymous). , , (targets).


.


Weinre , , iOS Android. , JavaScript.

Ghostlab.


, , . .

, , .

:

“Mobile Emulators and Simulators: The Ultimate Guide,” Maximiliano Firtman
“Introduction to Chrome Developer Tools, Part One,” Seth Ladd, HTML5 Rocks
“About Safari Web Inspector,” Safari Developer Library, Apple
“Enable Remote Debugging With Safari Web Inspector in iOS 6” Dave Ackerman, Modus Create
“Remote Debugging on Android With Chrome,” Chrome Developer Tools
“Weinre as Remote Debugger,” Mozilla Developer NetworkSource: https://habr.com/ru/post/237499/
All Articles