PT Reporting Portal: how to see the main security threats
The analysis of large data flows in recent years has become a serious problem for a variety of security tools. Vulnerability scanners and firewalls, incident management systems and DLP modules all deal with thousands of events that are aggregated daily, hourly or even every minute. It is very difficult for security specialists to disassemble these endless logs manually. Yes, and the effectiveness of the protection suffers: even if the system has detected a critical vulnerability or attack, it still takes time for this finding to be noticed by a person among many other messages.
In the summer, we held a small competition called “ What we lack in SIEM ”. Almost all information security specialists who sent us their feedback on modern security monitoring systems noted the need for a “smart” interface that would automatically sort and visualize data in order to sharpen the attention of experts on the most important results.
')
Similar requests have arisen from users of the MaxPatrol security and compliance control system. This system uses one of the world's largest vulnerability bases to scan the infrastructures of the largest companies, banks, telecoms and industrial enterprises with tens of thousands of nodes. You can imagine what order describes the number of records in the audit results!
Early versions of the scanner did not suggest such flows, so the interface was quite simple. However, along with the amount of data, the wishes of customers who wanted to implement various analytical functions using scan results also grew. Which of the found vulnerabilities are the most dangerous? Which of the company's divisions is the weak link? Has the level of security increased after the introduction of new vaunted antiviruses?
In response to such questions, our developers tried various approaches to create a system for building analytical reports on the criteria specified by the client. For example, in some cases, XML-reports of the MaxPatrol system were processed simply using macros in Excel. Later, for one of the clients, a reporting module based on Microsoft SQL Server Reporting Services and a separate MS SQL Server database was implemented. In the end, it became clear that a more universal solution of Business Intelligence class is needed, which is in the interests of all customers.
Technology
Basic requirements for BI solutions have long been known. On the one hand, it is the ability to build a unified consolidated reporting system from a variety of information systems. On the other hand, reducing the speed of receiving and processing data at any level. These two requirements contradict each other, representing the classic extreme task of creating a universal and highly interactive interface.
As a result of a comparative analysis, the QlikView platform was chosen as a technology platform for our Positive Technologies Reporting Portal (PT RP) analytical reporting portal. It is distinguished by two key technical features:
- An associative data model, which is a table linked by key fields. This model is created dynamically at the moment of loading data, while fields with the same name are associated with each other. When a user selects a value in one table, all associated values in other tables are automatically selected.
- In-memory request processing instead of using relational database management systems. This ensures ultra-high performance and eliminates the problems of traditional business analysis tools that are slow due to constant access to the data source: such systems are able to provide only static, pre-prepared information.
Briefly, the work of PT RP can be described as follows. The security monitoring system MaxPatrol issues scan reports for the specified period in XML format. Using special tools, these XML reports are imported into the intermediate storage - a database based on MS SQL Server. In this database, scan data is compared with organizational data: enterprise structure, grouping and typing of nodes, scan schedule, etc. Then, the consolidated data from the intermediate database is analyzed by the BI system and displayed on the web portal in the form of lists, indicators and change schedules metrics and KPI scores.

Opportunities
A few words about how we chose what to display on the portal. You can, of course, say simply: what the client wants. However, in practice, the client himself does not always understand what kind of security indicators can be obtained and how best to display them. This is one of the reasons why not all customers are ready to independently parse the scan data, although the integration bus in XML format gives them this opportunity.
That is why the reporting portal combines a set of formats and scenarios that have been developed by our specialists as a result of many years of experience with the capabilities of user customization and the formation of arbitrary rejected reports.
What are "our" formats and scripts? This, for example, is a high-level data view that can be projected onto the practical realities of a client from the point of view of different user groups - be they top managers, security specialists, or IT staff. Usually, all these people are forced to send huge reports with obvious redundancy of information and poor processability. We wanted to give them a common tool with which they could jointly research the data, exchange slices of the strictly necessary data and clearly see the progress of the work, both their own and others.
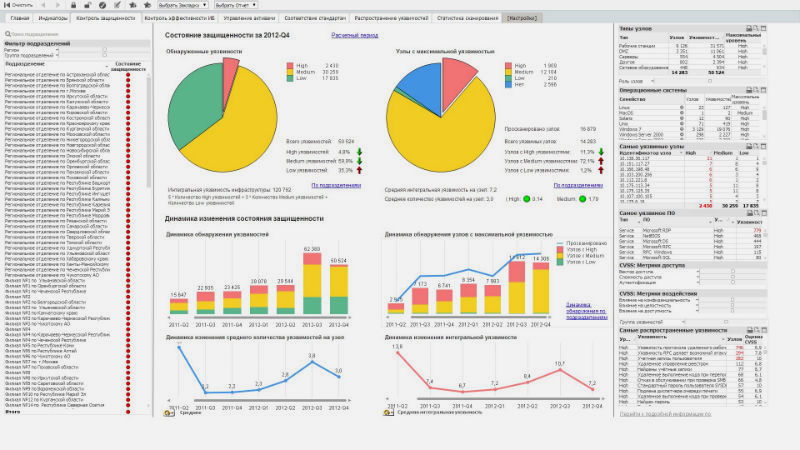
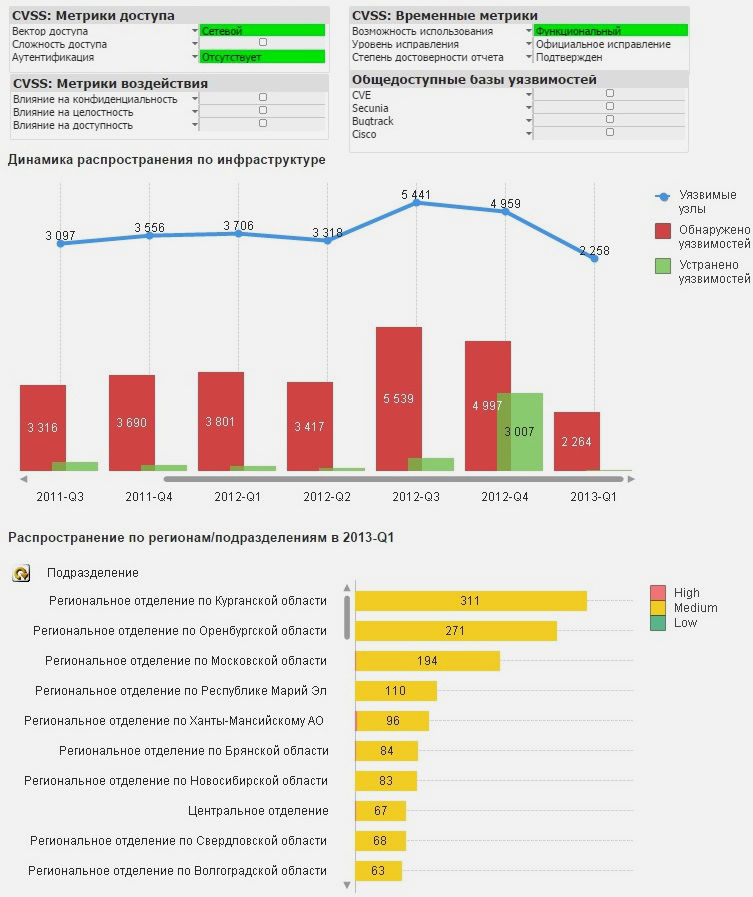
Now let's see how it looks. Depending on the specified threshold values, the status of safety indicators are color coded: normal - green, excess - yellow, critical excess - red, undefined status - gray. The central element on the main page of the portal displays a summary indicator of the security status. But what indicators can be:
- Security monitoring: the percentage of found vulnerabilities of different levels and the number of nodes with found vulnerabilities, as well as the change in these indicators compared to the previous reporting period.
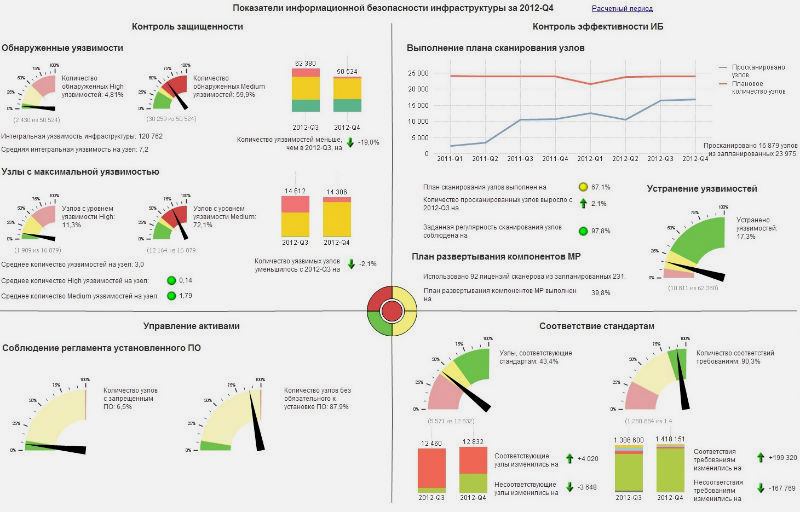
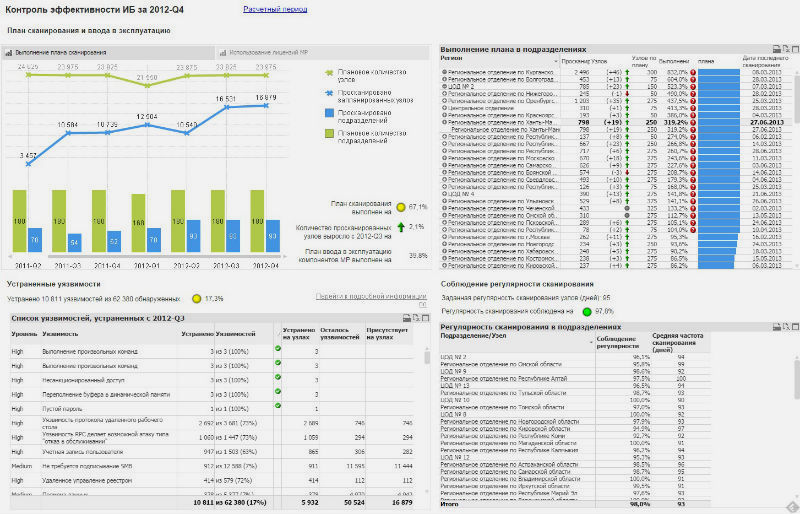
- Control of the effectiveness of information security: the percentage of eliminated vulnerabilities, compliance with the plan for scanning and commissioning MP components, as well as changing the number of scanned nodes.
- Compliance with standards: current state and dynamics of audits for compliance with state, industry and corporate safety standards.
- Asset management: inventory and control of installed software: we distinguish between mandatory, prohibited and supported software - and all other software that is subject to verification.
The choice of the reporting period can be used for retrospective analysis on any indicator.
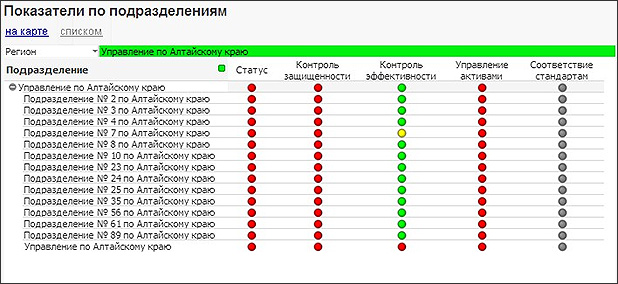
The portal can display selected IB-indicators for the entire infrastructure, as well as for individual departments and regions, by type of nodes or operating systems. At the same time, data can be visualized on a map or any other scheme suitable for a specific client: it can be a building or office diagram, a network diagram or an organizational chart with a list of responsible employees. By the way, practical consolidation of such data in highly distributed infrastructures is a long-standing headache of information security specialists. Delivery of data from the regions, and then “returning” the recommendations of specialists and monitoring the implementation of these recommendations can take a decent amount of time without proper automation.

The found vulnerabilities can be filtered by any metrics of the CVSS standard (for example, select the most critical ones) and see the dynamics of propagation and elimination of vulnerabilities throughout the infrastructure, as well as by individual divisions and regions.
In addition, the portal has a number of opportunities that are achieved by flexible settings and the use of various scenarios.
Implementation practice and other details
For the first time, the PT Reporting Portal analytical reporting portal was presented to the expert community in the spring of 2013 at the Positive Hack Days III practical safety forum. Currently, there are already several customers, including one of the largest Russian banks that use this solution.
If you are interested in practical details of this work, as well as other features of using business intelligence tools in the field of information security, you can ask Positive Technologies experts on the webinar this Thursday, September 18, at 14:00 on our company website.
Update: And if you did not have time for the webinar on Thursday, just wait a few days - we will post a webinar recording on the same site: www.ptsecurity.ru/lab/webinars
Source: https://habr.com/ru/post/237171/
All Articles