Analyzing Weird Correlations
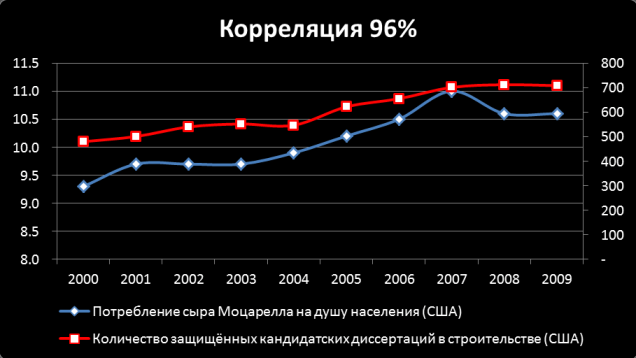
Recently I noticed in the Facebook feed a link to an article with a bunch of examples of “strange correlations” like in the picture. The source is here , and there are 20 examples of such examples. I decided to practice statistics and check how these correlations are really amazing.
Interested please under the cat.
Remove trends
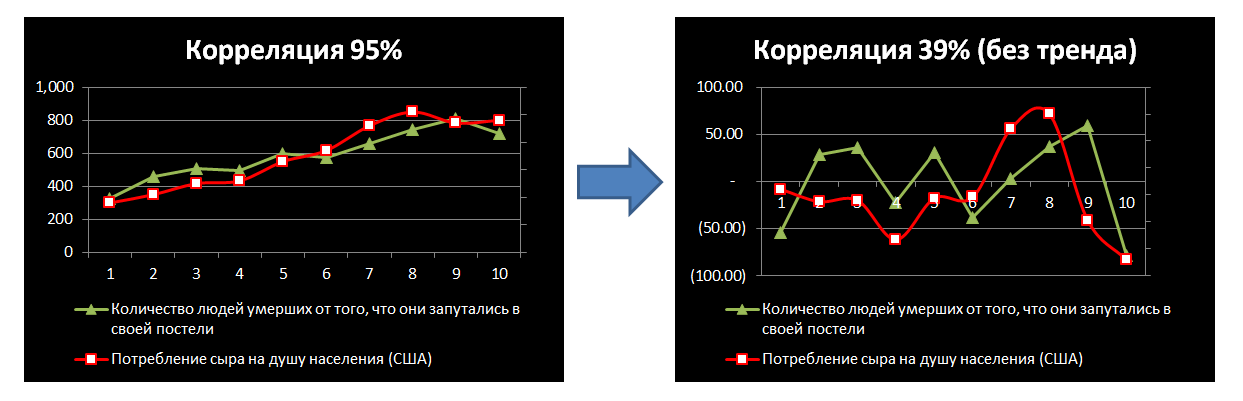
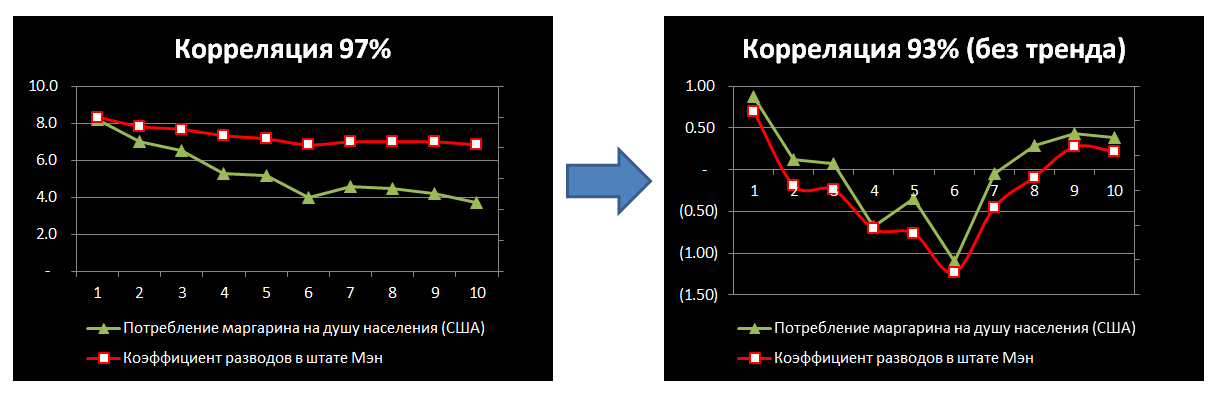
If two indicators grow all the time, then they will have a positive correlation, and this is not surprising. Correlation must be measured by stationary variables. To remove the trends, I constructed a linear regression of time for each indicator, subtracted from the actual data and checked the correlation of the residuals.
')
In some cases, the correlation has greatly decreased:
In others, nothing has changed:
So there must be something else!
By the way, I noticed that positive correlations were found significantly more than negative ones. I think the fact is that in the database of indicators that the author used, there are a lot of growing indicators. People in general love to measure something growing. As a result, a bunch of indicators for which “trend residues” have a strong negative correlation were not found, since the coincident positive trend shifted the correlation closer to zero.
What is the general probability to get such a correlation by chance?
Here we will take up the formula! It turned out that on average in these variables there are 11 points and after correction for trends, the average correlation is around 70%. Knowing the correlation and the number of points, you can get a variable that is distributed as a t-student with the number of degrees of freedom n-2:

We obtain t = 2.98 and the probability of obtaining such a correlation with independent variables is about 0.77%. The resulting figure is quite impressive, but the question is not closed!
And here is the twin paradox?
The probability of 0.77% seems too low to believe in coincidence, but intuition is wrong here. This situation is similar to the famous birthday paradox.
The probability that two people were born on the same day is 1/365. But among only 23 people with a 50% chance there will be a couple born on the same day. This happens because it doesn’t matter to us exactly which two people it will be, and among 23 people you can make up a lot of couples.
The same thing happens with the correlation of various indicators, if it does not matter which of them will correlate. Two random variables will correlate strongly in one attempt out of 65. I multiply the probability by 2, since the correlation below -70% also interests us.

But if you take only 9 random variables (11 points each), then with a 50% probability there will be a correlation of more than 70% or less - 70%

In practice, I probably had to look at a lot more variables. Very many indicators can actually or should correlate and filter precisely the “amazing” that was difficult. But after statistical analysis it is clear that there is nothing surprising in the indicators found. Again, intuition brings a person into the issues of probability estimation.
Source: https://habr.com/ru/post/236503/
All Articles