JSOC: how to measure availability of the Security Operation Center?
Good day. We are continuing the series of articles from behind the scenes of the Jet Security Operation Center. When it comes to the "cloud" service, there is always the question of the number of "9 decimal points" in terms of its availability. I would like to talk about what constitutes the availability of SOC in terms of hardware and software, and by what means we control this accessibility. The article will be much more technical, so I ask readers to be patient.
The final goal of our service (JSOC) is to identify and promptly analyze customer information security incidents. This creates three basic requirements for its availability:
These requirements generate three different levels of monitoring the availability of a JSOC service.
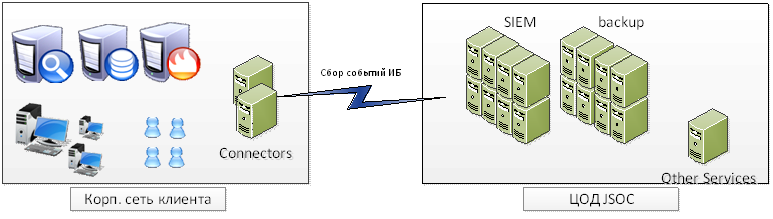
Everything here is quite simple and does not differ from deep monitoring of any other IT-application. Consider the typical connection scheme of our client:
')
With this scheme, availability monitoring monitors:
These indicators are fully monitored via Zabbix. For each indicator, statistics are collected and the triggers are set to the specified threshold values: warning - 20% of the maximum value, critical - 2-5% of the maximum value. In general, there is nothing unusual, and it is probably not necessary to describe once again.
The result of this model is the ability to quickly obtain information about external and internal problems in the operation of the service, potentially “bottlenecks” in terms of infrastructure. But all these parameters do not give us an understanding of the integrity of the information we have and of whether we see everything we need on the customer’s network, and whether we can promptly react to the incident.
This leads us to the second task: it is necessary to control what information comes to us from source systems, how complete and relevant it is, how correctly it is disassembled by the system. In the case of a SIEM system, the following parameters acquire criticality:
It is clear that the task of controlling the incoming data and analyzing them for completeness and integrity is primarily the task of the SIEM itself. Unfortunately, out of the box it is not always possible to get acceptable results.
But, as noted earlier, HP ArcSight is primarily a framework. And we, creating JSOC, began to make our own model of control of incoming information. That's what happened in the end.
The last measure of the measurement remains - the speed of the system in the construction of reports and the investigation of the incident by the analyst. In our case, potential delays entail a violation of the SLA, so we, of course, could not leave this question aside.
In this case, as a rule, it is sufficient to determine the set of operations and reports necessary to investigate the most critical or frequency incidents and to measure their execution time on the customer's weighted average case. Information about the speed of execution we take from two sources at once.
The first one is reports and operations that are performed on a schedule and show us “reference” performance indicators. In this case, we made two types of reports that run according to a schedule: a report on a deliberately empty filter and a report on typical events (the same monitoring of sources) with summation over the fields. Based on the results of these reports, we also collect statistics and see the dynamics of changes:

The second is information on the time of execution of current reports by employees.
Behind this, I would like to finish the story that, in our opinion, ensures the availability of the JSOC core and how we solve the problem of its control. Thanks for attention.
The final goal of our service (JSOC) is to identify and promptly analyze customer information security incidents. This creates three basic requirements for its availability:
- The platform for collecting and processing information must be accessible and workable. If information about events and incidents has nowhere to go, there can be no talk of any incidents identified.
- Information from the sources of information security events should be as complete as possible: we must receive all the required audit events, on the basis of which our scenarios for identifying incidents are built.
- At the moment when the system recorded the incident, we should be able to collect and analyze as quickly as possible all the information necessary for its investigation.
These requirements generate three different levels of monitoring the availability of a JSOC service.
Level 1. JSOC infrastructure
Everything here is quite simple and does not differ from deep monitoring of any other IT-application. Consider the typical connection scheme of our client:
')
With this scheme, availability monitoring monitors:
- Network availability component:
- availability of the core of the SIEM system from the VDI platform, and, accordingly, the ability to work with the system of monitoring engineers;
- channel performance between sites: network connectivity between the connector servers and the system core;
- communication between connector servers and key client sources that are connected to collect events;
- availability of access from the core of the SIEM system to additional servers for processing and analyzing events
- availability of the core of the SIEM system from the VDI platform, and, accordingly, the ability to work with the system of monitoring engineers;
- Performance levels of hardware and OS:
- CPU load and performance
- use and distribution of RAM;
- availability of free space in the file sections;
- general performance of the disk subsystem.
- CPU load and performance
- Analysis of the state of network components:
- the number of packet processing errors on network equipment;
- information on the quality of site-2-site tunnel operation between sites (session status, percentage of losses, etc.);
- utilization of network interfaces on all intermediate equipment;
- the load on the Internet channel created by the transfer of traffic.
- the number of packet processing errors on network equipment;
- Monitoring the status of key system and application services at the OS level:
- the state of the OS services required for JSOC operation;
- status and key indicators (duration of work, use of resources) by ArcSight processes.
- the state of the OS services required for JSOC operation;
- Monitoring for system log errors:
- network equipment and firewalls;
- virtualization tools;
- OS on kernel components and connector servers.
- network equipment and firewalls;
- Monitor connector logs and the ArcSight core for errors.
These indicators are fully monitored via Zabbix. For each indicator, statistics are collected and the triggers are set to the specified threshold values: warning - 20% of the maximum value, critical - 2-5% of the maximum value. In general, there is nothing unusual, and it is probably not necessary to describe once again.
The result of this model is the ability to quickly obtain information about external and internal problems in the operation of the service, potentially “bottlenecks” in terms of infrastructure. But all these parameters do not give us an understanding of the integrity of the information we have and of whether we see everything we need on the customer’s network, and whether we can promptly react to the incident.
Level 2. Information integrity from sources
This leads us to the second task: it is necessary to control what information comes to us from source systems, how complete and relevant it is, how correctly it is disassembled by the system. In the case of a SIEM system, the following parameters acquire criticality:
- control not only the state of sources, but also incoming types of events;
- All received events must be correctly parsed by the system. We need to clearly understand that events are processed correctly and our rules will work;
- the flow of events transmitted by the source system must be sent to the JSOC with minimal loss. We collect data in a mode close to real-time.
It is clear that the task of controlling the incoming data and analyzing them for completeness and integrity is primarily the task of the SIEM itself. Unfortunately, out of the box it is not always possible to get acceptable results.
- ArcSight has a fairly high-quality mechanism for determining the state of connected systems. In case of falling connectors, problems with the availability of end sources, the presence of a cache on the connector, the built-in correlation rules + visualization work.
The main problem here is related to the fact that the standard content does not take into account the possibility of connecting several customers to one system. As a result, all the default rules and dashboards are not suitable for our tasks. - There is also a basic functionality for determining the absence of information from the source of events according to the principle: “there has not been a single event in the last N hours.”
But at the same time, all control goes entirely on the source (Microsoft Windows, Cisco ASA, etc.) and does not take into account the different types of events. Moreover, for all systems it is possible to include only the total monitoring time, there is no audit of changes in the number of events compared to the “normal” operation.
Consider, for example, gathering events from a Cisco ASA firewall with the required audit level. One of the most important tasks in monitoring this equipment for us is the identification and processing of remote access VPN sessions terminated by a firewall. At the same time, in the general flow of events they make up less than 1%. And their “disappearance” (for example, the accidental change of audit settings by the customer) in the total volume of events may simply go unnoticed. - There is a built-in mechanism for parsing events and evaluating the success of its normalization, which can signal that the received event did not coincide with the preset format and did not fit into the format.
This event is called an “unparsed event” and notification of it can be delivered either by mail or by creating a case directly in the ArcSight console. Thus, it helps to solve problem number 2 quite successfully. - There is a built-in notification mechanism in cases when the difference in time between the label on the source and the connector reaches a certain threshold.
And here everything is fine. Except that these events are not displayed in general dashboards and there are no alerts on them. Together with the definition of caching events on the connector - this is almost a ready-made solution to task 3.
But, as noted earlier, HP ArcSight is primarily a framework. And we, creating JSOC, began to make our own model of control of incoming information. That's what happened in the end.
- To begin with, we “slightly” changed the source definition logic. For each type of source, we identified categories of important events for us and identified the most frequent ones from them, the presence of which can be taken as a basis.
For example, for Windows, you can write this "mapping":
4624, Logon / Logoff: Logon
4768, Account Logon: Kerberos Ticket Events
4663, Object Access: File System
4688, Detailed Tracking: Process Creation
4689, Detailed Tracking: Process Termination
4672, Logon / Logoff: Special Logon
5140, Object Access: File Share
etc.
For Cisco ASA, this is:
602303,602304,713228,713050, VPN Connection
302013-302016, SessionStatistic
106023, AccessDenied
etc.
ArcSight allows you to simply make such a mapping through configuration files. As a result, earlier the event of the status of the source looked like this (on the example of Windows):Timestamp CustomerName ConnectorName Eventname DeviceName Event count DeviceVendor DeviceProduct 2 Sep 2014 17:37:29 MSK Jet infosystems Jet_windows Connector Device Status arc-srv1 - 10.31.120.25 13 Microsoft Microsoft Windows
Now, in JSOC, each of our categories of events has its own status:Timestamp CustomerName ConnectorName Eventname DeviceName Event count DeviceVendor DeviceProduct 2 Sep 2014 17:37:29 MSK Jet infosystems Jet_windows Connector Device Status arc-srv1 - 10.31.120.24 126 Microsoft Object Access: File Share 2 Sep 2014 17:37:29 MSK Jet infosystems Jet_windows Connector Device Status arc-srv1 - 10.31.120.24 24 Microsoft Logon / Logoff: Logon 2 Sep 2014 17:37:29 MSK Jet infosystems Jet_windows Connector Device Status arc-srv1 - 10.31.120.24 53 Microsoft Microsoft Windows - For each "new type" of the source, long-term dynamic profiling is carried out by volume and number of events received from it in ArcSight. As a rule, the profile measurement unit is 1 hour, the profiling duration is 1 month. The main purpose of profiling is to determine the average and maximum values of the number of events from sources at different time intervals (working day, night, weekend, etc.)
Once the profile is built, we can already assess the "integrity" of the incoming information. The individual monitoring rules in ArcSight are configured as follows:- the absence of events is determined not by a specified interval, but by comparison with the profile (if there really should not be events from a given source during this time interval, for example, events on changing the configuration of a network device);
- by deviations: if the number of events in the last hour is 20% less / more than the baseline at the same intervals in our profile, this is a reason to sort out the situation in more detail;
- definition of new sources (there are events, but this source is not in the profile).
Thus, the implemented “long” dynamic profiling allows us to quickly track problems in data transfer and monitor the integrity of the information we receive.
An example of such a status for one of the sources (proxy server):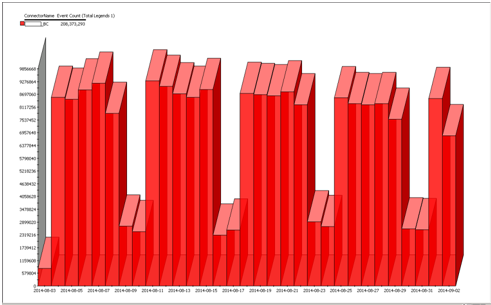
- Improved standard rules and dashboards. Added information about customers, added two separate status tracking profiles for connectors and connected devices. As a result, all the rules are entered into a single structure for generating incidents and a case is created for each of them (as well as when monitoring system components).
It turned out about the following: there are two dashboards near the same ESM (one is standard, the other is ours). There is no problem with standard monitoring. And in our version - there are obvious problems with connecting to sources, the absence of events of a certain category and an increased flow of events from one of the devices.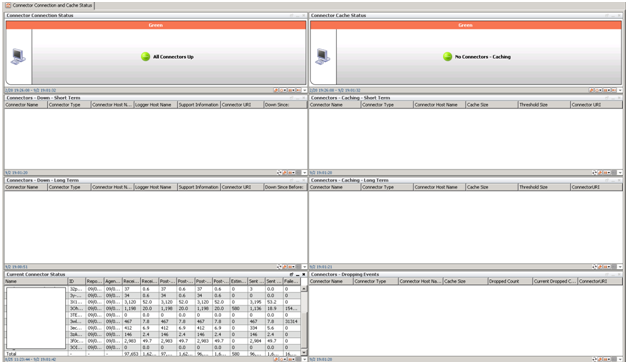

- One very small but important problem remains: some of the audit events on target systems are very rare. For example, adding a user to a domain administrators group in Active Directory or events to change the configuration of a network device (collected through Cisco ACS tacacs-server), etc. At the same time, the very fact of the occurrence of such an event is often already an IS incident even without an additional correlation in the construction of complex chains of events.
And here, the “last argument of the kings” is the old and familiar scripting technique: in agreement with the customer, we emulate a test event on the target system with a certain frequency and thus make sure that random errors in the work with the audit will not cause no incident detection.
It is worth noting that, despite the high level of control over the events built in the framework of the model described above, we, nevertheless, regularly (at least once a month) conduct combat tests of the audit system and our incident handling team. In this case, the methodology is as follows: the customer independently (or with our help) performs a set of actions that lead to the identification of the incident. For our part, firstly, we record the fact of receiving all the initial information in the JSOC, and secondly, we once again confirm the correctness of the correlation rules, and finally, we check the reaction and level of incident analysis with the first line of our JSOC team.
Level 3. Speed
The last measure of the measurement remains - the speed of the system in the construction of reports and the investigation of the incident by the analyst. In our case, potential delays entail a violation of the SLA, so we, of course, could not leave this question aside.
In this case, as a rule, it is sufficient to determine the set of operations and reports necessary to investigate the most critical or frequency incidents and to measure their execution time on the customer's weighted average case. Information about the speed of execution we take from two sources at once.
The first one is reports and operations that are performed on a schedule and show us “reference” performance indicators. In this case, we made two types of reports that run according to a schedule: a report on a deliberately empty filter and a report on typical events (the same monitoring of sources) with summation over the fields. Based on the results of these reports, we also collect statistics and see the dynamics of changes:
The second is information on the time of execution of current reports by employees.
Behind this, I would like to finish the story that, in our opinion, ensures the availability of the JSOC core and how we solve the problem of its control. Thanks for attention.
Source: https://habr.com/ru/post/236347/
All Articles