Learn to cook Log4j + Logstash + ElasticSearch + Kibana 3 + Auth (Google OAuth2 / BasicAuth / CAS Authentication)

Task
Setting up a convenient tool for processing and receiving logs.
Conditions
- MIT or Apache 2.0 license
- The ability to receive and process multi-line messages
- Easy to set up and use
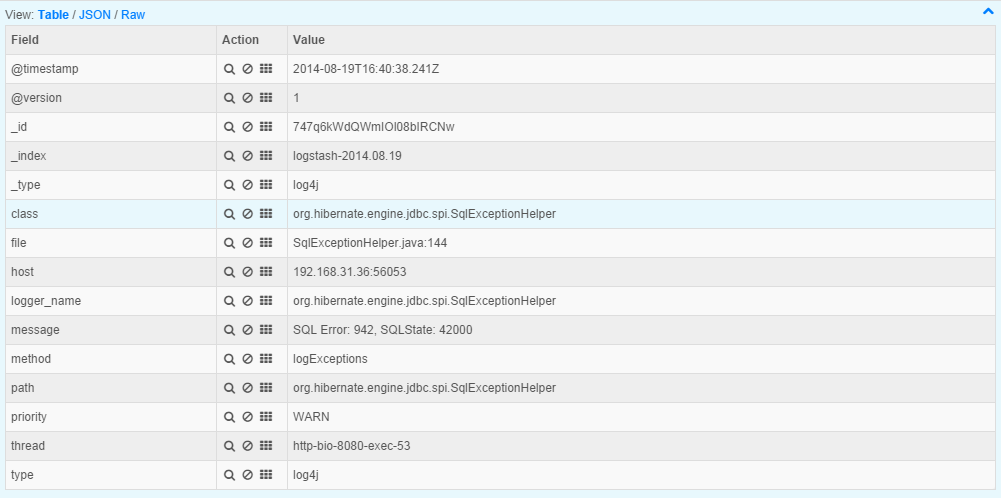
- Ability to work with logs from Log4j
Decision
Logstash + ElasticSearch + Kibana 3.
Implementation
First, let's deploy Logstash + ElasticSearch + Kibana 3 on our server:
')
# , 7 java -version # , Logstash cd /srv # mkdir slog # cd slog # Logstash, http://logstash.net/ curl -O https://download.elasticsearch.org/logstash/logstash/logstash-1.4.2.tar.gz # tar.gz tar zxvf logstash-1.4.2.tar.gz # Logstash cd logstash-1.4.2 # Logstash bin/logstash -e 'input { stdin { } } output { stdout {} }' # . , (Ctrl + C). Now we will configure the configuration file for Logstash, detail here.
The file can be saved anywhere, for example, I save in logstash / conf / main.conf .
My version of the configuration file:
input { log4j { mode => "server" host => "logstash_server_ip" port => logstash_server_port type => "log4j" } } output { elasticsearch { embedded => "true" } } More details:
input
mode - Type of service, server / client
host - the IP address of the server to which the log4j logs will transmit
port = logstash_server_port - port for exchange of logs
type - type of messages to denote logs.
output
embedded - Do I need to run my own elasticsearch service or will I need to establish a connection to an existing one
Now we will configure the transfer of logs from Log4j:
For this, we will use the Logstash plugin for Log4j, and the SocketAppender from Log4j.
Add the settings in Log4j:
logstash_server_port - the port that we will specify in the Logstash settings for the exchange of logs
logstash_server_ip - ip address of the server where Logstash is located
xml
<appender name="LOGSTASH" class="org.apache.log4j.net.SocketAppender"> <param name="port" value="logstash_server_port" /> <param name="remoteHost" value="logstash_server_ip" /> </appender> <root> <appender-ref ref="LOGSTASH" /> </root> properties
log4j.rootLogger=logstash log4j.appender.logstash=org.apache.log4j.net.SocketAppender log4j.appender.logstash.port=logstash_server_port log4j.appender.logstash.remoteHost=logstash_server_ip Now we try to start the system:
# Logstash cd /srv/slog/logstash-1.4.2/ # : bin/logstash agent -f conf/main.conf # , web bin/logstash agent -f conf/main.conf web At the end of the launch, a similar message will be displayed on the screen:
Using milestone 1 input plugin 'log4j'. This plugin should work, but would benefit from use by folks like you. Please let us know if you find bugs or have suggestions on how to improve this plugin. For more information on plugin milestones, see http://logstash.net/docs/1.4.2/plugin-milestones {:level=>:warn} Which says that the Log4j plugin is in test state.
Now go to the visual part.
http: // logstash_server_ip: 9292
logstash_server_ip - server ip address
9292 is the default port, it can be changed in the configuration file.
The standard Kibana view seemed to me not very convenient, but you can customize it for yourself. Personally, I took the option from this article as a basis and made the presentation more convenient, in my opinion.
Here is my option
{ "title": "Home dashboard dark", "services": { "query": { "idQueue": [], "list": { "0": { "id": 0, "color": "#7EB26D", "alias": "", "pin": false, "type": "lucene", "enable": true, "query": "priority: \"INFO\"" }, "1": { "id": 1, "color": "#E24D42", "query": "priority: \"ERROR\"", "alias": "", "pin": false, "type": "lucene", "enable": true }, "2": { "id": 2, "color": "#6ED0E0", "alias": "", "pin": false, "type": "lucene", "enable": true, "query": "priority: \"WARN\"" } }, "ids": [ 0, 1, 2 ] }, "filter": { "idQueue": [], "list": { "0": { "type": "time", "field": "@timestamp", "from": "now-6h", "to": "now", "mandate": "must", "active": true, "alias": "", "id": 0 } }, "ids": [ 0 ] } }, "rows": [ { "title": "Filtering", "height": "150px", "editable": true, "collapse": false, "collapsable": true, "panels": [ { "error": false, "type": "filtering", "span": 12 }, { "loading": false, "error": false, "sizeable": false, "span": 12, "height": "150px", "editable": true, "type": "query", "query": "*", "pinned": true, "history": [ "priority: \"WARN\"", "priority: \"ERROR\"", "priority: \"INFO\"", "@&~(HHH.+)", "@&~(foo.+)", "*", "level:\"WARN\"", "level:\"ERROR\"", "level:\"INFO\"" ], "remember": 10 } ], "notice": true }, { "title": "Graph", "height": "200px", "editable": true, "collapse": false, "collapsable": true, "panels": [ { "span": 12, "editable": true, "group": [ "default" ], "type": "histogram", "mode": "count", "time_field": "@timestamp", "value_field": null, "auto_int": true, "resolution": 99, "interval": "5m", "fill": 2, "linewidth": 3, "timezone": "browser", "spyable": true, "zoomlinks": true, "bars": false, "stack": false, "points": false, "lines": true, "legend": true, "x-axis": true, "y-axis": true, "percentage": false, "interactive": true, "queries": { "mode": "all", "ids": [ 0, 1, 2 ] }, "title": "Events over time", "intervals": [ "auto", "1s", "1m", "5m", "10m", "30m", "1h", "3h", "12h", "1d", "1w", "1M", "1y" ], "options": true, "tooltip": { "value_type": "cumulative", "query_as_alias": true }, "scale": 1, "y_format": "none", "grid": { "max": null, "min": 0 }, "annotate": { "enable": false, "query": "*", "size": 20, "field": "_type", "sort": [ "_score", "desc" ] }, "pointradius": 5, "show_query": true, "legend_counts": true, "zerofill": true, "derivative": false } ], "notice": false }, { "title": "Events", "height": "150px", "editable": true, "collapse": false, "collapsable": true, "panels": [ { "title": "All events", "error": false, "span": 12, "editable": true, "group": [ "default" ], "type": "table", "size": 100, "pages": 5, "offset": 0, "sort": [ "@timestamp", "desc" ], "style": { "font-size": "9pt" }, "overflow": "min-height", "fields": [ "@timestamp", "priority", "message", "class", "host" ], "highlight": [ "level" ], "sortable": true, "header": true, "paging": true, "spyable": true, "queries": { "mode": "all", "ids": [ 0, 1, 2 ] }, "field_list": false, "status": "Stable", "trimFactor": 300, "normTimes": true, "all_fields": false, "localTime": false, "timeField": "@timestamp" } ], "notice": false } ], "editable": true, "failover": false, "index": { "interval": "day", "pattern": "[logstash-]YYYY.MM.DD", "default": "NO_TIME_FILTER_OR_INDEX_PATTERN_NOT_MATCHED", "warm_fields": true }, "style": "dark", "panel_hints": true, "pulldowns": [ { "type": "query", "collapse": false, "notice": false, "query": "*", "pinned": true, "history": [], "remember": 10, "enable": false }, { "type": "filtering", "collapse": true, "notice": true, "enable": false } ], "nav": [ { "type": "timepicker", "collapse": false, "notice": false, "status": "Stable", "time_options": [ "5m", "15m", "1h", "6h", "12h", "24h", "2d", "7d", "30d" ], "refresh_intervals": [ "5s", "10s", "30s", "1m", "5m", "15m", "30m", "1h", "2h", "1d" ], "timefield": "@timestamp", "now": true, "filter_id": 0, "enable": true } ], "loader": { "save_gist": false, "save_elasticsearch": true, "save_local": true, "save_default": true, "save_temp": true, "save_temp_ttl_enable": true, "save_temp_ttl": "30d", "load_gist": true, "load_elasticsearch": true, "load_elasticsearch_size": 20, "load_local": true, "hide": false }, "refresh": false } Authentication:
The disadvantage of this system is the absence of any authentication, due to the fact that it was designed for internal networks. But this is quickly resolved by this fork from github.
In order to use it first we need to install node.js on our server. Personally, I used this tutorial.
# cd /usr/src # http://nodejs.org/download/. # http://nodejs.org/dist/v0.10.31/node-v0.10.31.tar.gz # wget http://nodejs.org/dist/v0.10.31/node-v0.10.31.tar.gz # tar zxf node-v0.10.4.tar.gz # node.js cd node-v0.10.4 # ./configure # make make install # node.js # . # cd /srv/slog # : git clone https://github.com/fangli/kibana-authentication-proxy cd kibana-authentication-proxy/ git submodule init git submodule update npm install # Kibana cd kibana && git checkout master && git pull # config.js . # nano , nano /srv/slog/kibana-authentication-proxy/config.js For the initial launch, you need to edit the following settings: es_host / es_port
In them we set the connection settings for ElasticSearch. If in the previous case we used the built-in ElasticSearch for the built-in Kibana, then now we need to configure it on a separate custom Kibana. To do this, edit our main.conf file by adding the ElasticSearch port settings:
elasticsearch_server_port - port on which elasticsearch will be available
Final version:
input { log4j { mode => "server" host => "logstash_server_ip" port => logstash_server_port type => "log4j" } } output { elasticsearch { embedded => "true" embedded_http_port => elasticsearch_server_port } } Now we change settings in config.js
"Es_host" : logstash_server_ip
"Es_port" : elasticsearch_server_port
Now authentication. This fork allows you to configure one of 3 authentications: Google OAuth2 / Basic Authentication / CAS Authentication.
For example, let's configure Basic Authentication:
"enable_basic_auth": true, "basic_auth_users": [ {"user": "admin", "password": "admin"}, ], Run:
# Logstash + ElasticSearch # web cd /srv/slog/logstash-1.4.2/ bin/logstash agent -f conf/main.conf # Logstash . cd /srv/slog/kibana-authentication-proxy/ node app.js The default port for this Kibana fork is 9201
So now it is available at:
http: // logstash_server_ip: 9201.
Result

UPD: After updating Logstash to version 1.5. * The recipe does not work, there will be time - I will post an updated version.
Source: https://habr.com/ru/post/236341/
All Articles