A few words about vSphere vFRC
Starting with vSphere 5.5, a feature such as vFRC appeared in the VMWare vSphere Enterprise Plus license.
What is it and for what?
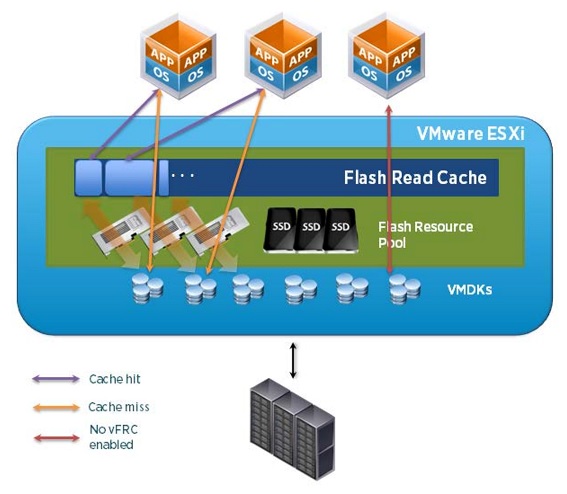
vFRC - vFlash Read Cashe is the function of caching read operations of the virtual machine disk to the local SSD drive of the virtualization host.
That is, insert the SSD drive in the ESXi host. in the host settings, add this disk (s) to the vFRC pool, go to the properties of the virtual machine, and for each of its disks, if necessary, add the necessary size vFRC. For example, a disk at VM on 100 GB, added vFRC on 20 GB. Got some kind of hybrid drive. All write operations go to the main one, and all read operations are cached on the vFRC SSD mirror. According to a certain statistical algorithm, the most frequent read requests blocks remain in this cache. When migrating a VM to a neighboring vFRC host, the disk data of this VM is also transferred to the FRC pool of the new host. If there is no vFRC pool there, or there is not enough space in it, then vFRC is disabled for such a machine. The operation of this rule has the ability to customize.
I have long wanted to test this technology and now, finally, my hands have reached.
A PNY 120 GB SSD (eMLC) was inserted into the ESXi host and configured as vFRC.
An attempt to test in the forehead did not show good results. IOMETER did not want to give an increase in IOPS.
Began to study the issue and found that when connecting vFRC we have the ability to specify the size of the block that will be used for caching. The default block size is 8 kilobytes. The problem, as it turned out, was buried here.
ESXi has tools for collecting and analyzing statistics on VM communication with a disk subsystem. In the same place we can look at the statistics of circulation by blocks of various sizes. An analysis of these statistics will show us the block size most often used by the system. It all depends on the service that creates the disk load.
So, to view statistics using vscsiStats , enable SSH on the ESXi host and connect to the command line. I will make a reservation that part of the data in an article from google and documentation.
1.Watch the list of machines and disks they use on the host: vscsiStats -l
2. Let's start collecting statistics on the disk of interest: vscsiStats -s -w YYYYY -i XXXX (Where YYYYY would have virtual machine GroupGand and XXXX its Virtual SCSI Disk handleID)
3. Next, run the standard load and wait.
4. See our stats: vscsiStats -p ioLength -c -w YYYYY -i XXXX
')
We get a printout of the form:
min, 512
• max, 1052672
• mean, 18434
• count, 21150
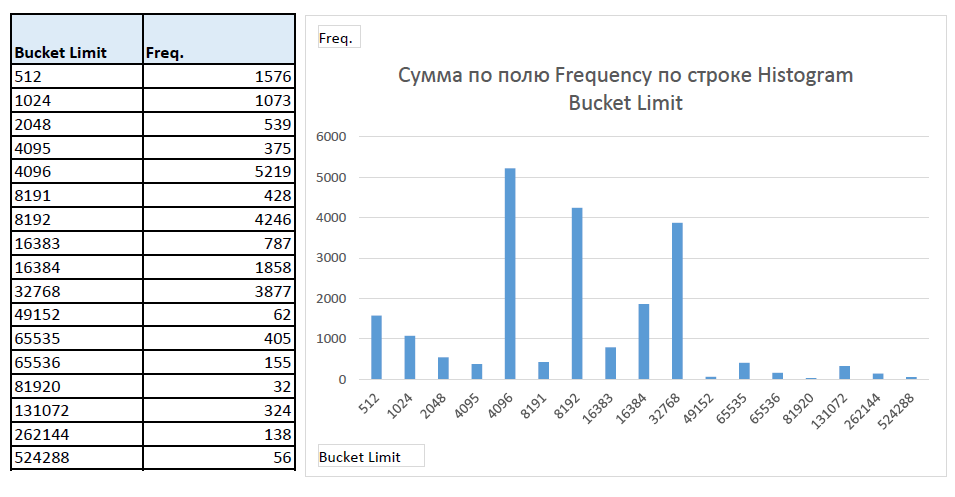
• Frequency, Histogram Bucket Limit
• 1576,512
• 1073,1024
• 539.2048
• 375.4095
• 5219 , 4096
• 428,8191
• 4246,8192
• 787.16383
• 1858.16384
• 3877,32768
• 62.49152
• 405,65535
• 155,65536
• 32,81920
• 324.131072
• 138,262144
• 9,524288
• 47,524288
Where the first column indicates the number of blocks (hits), and the second column indicates the size of these blocks. We are looking for the largest number and we understand which block is the most popular among us. In our particular case, this is 4 kilobytes.
Finishing statistics collection: vscsiStats -x
And we change the size of the used block in the vFRC settings of the VM disk.
Now, how to view vFRC job statistics? In graphic form in any way. Command line only. Not convenient, probably in the future they will finish, because vSphere has a convenient and powerful graphical interface for working with statistics.
All the same in the command line we are looking for a disk cache that serves our VM:
~ # esxcli storage vflash cache list
vfc-413278667-vfrc-test
We look at its details:
~ # esxcli storage vflash cache get -c vfc-413278667-vfrc-test
World ID: 2299121
Cachename: vfc-413278667-vfrc-test
Vmdkname: vfrc-test-flat.vmdk
We look at the statistics:
~ # esxcli storage vflash cache stats get -c vfc-413278667-vfrc-test
Or reset the statistics:
~ # esxcli storage vflash cache stats reset -c vfc-413278667-vfrc-test
Fine. Let's see how it works in reality.
We cling to VM a new thick (Thick Eager Zeroed) disk for 5 gigabytes, we connect to it a vFRC disk, also for 5 gigabytes. We create a cache of the most efficient working conditions. The entire VM disk is covered in a read cache.
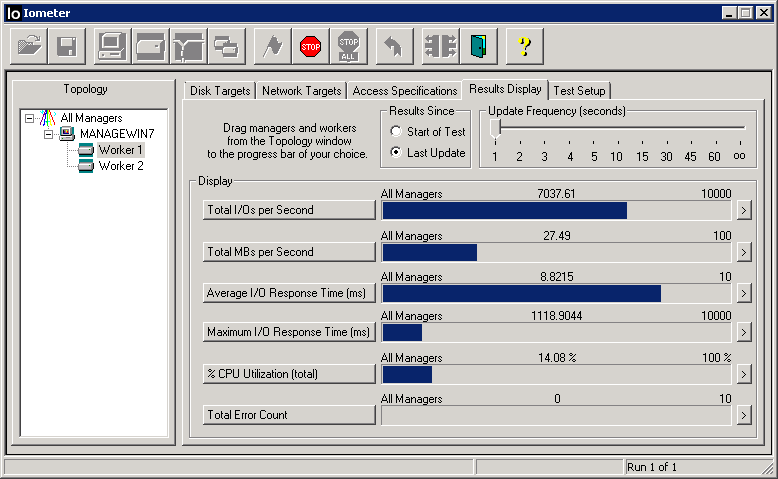
Launch IOMETER and watch.
64 threads, 1 worker, 4kb BS, 100% random, 100% read
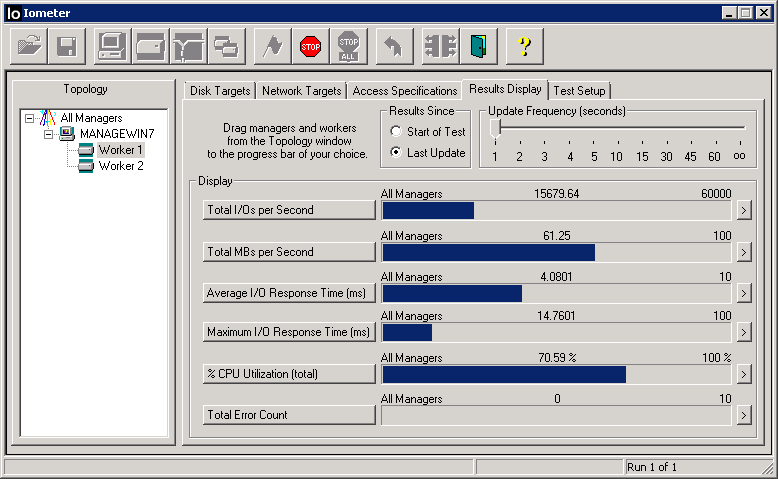
To begin with, we put a virtual machine disk on a storage system that provides 10,000 IOPS for random reading.
IOMETER honestly shows them. For a couple of minutes, nothing happens, but after IOPS numbers start to grow smoothly. After 2 hours, they reach the level of 15.000 IOPS and this is limited. It seems that we have reached the limit and all our data is cached.
We check, go to the storage system and look at the IOPS that reach it.

Yes, we see that about 1700 IOPS reach the VM disk. Perhaps not 100% of the data is in the cache. Perhaps this is a feature of the technology. I can not argue.
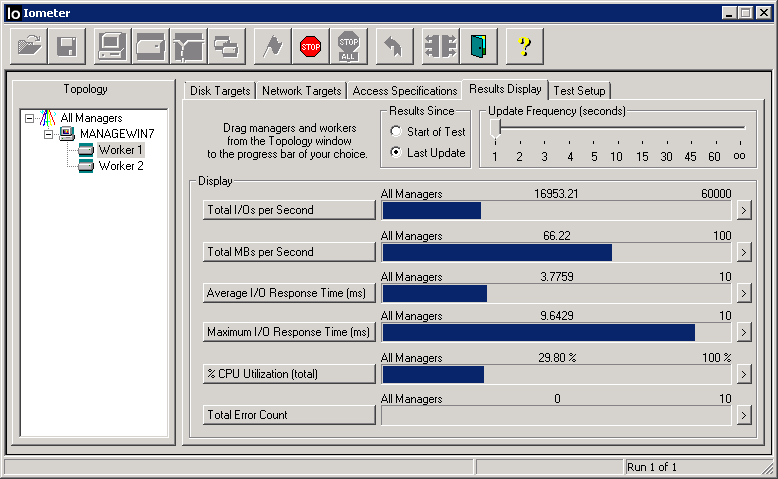
Next, we try to transfer the VM disk to a deliberately fast storage system, which provides guaranteed 60.000 IOPS for random reading.
Everything is logical, we see only 16.000 IOPS. the data is taken from vFRC, and not from the VM disk, otherwise we would get significantly larger IOPS.
For the final check, we transfer the VM disk to a deliberately slow stack, which gives no more than 200 IOPS for random reading (1 SATA 7.2k disk)
We get 7.000 IOPS !!! Great result for such a slow storage!
What can we get from statistics?
Enter the command and see:
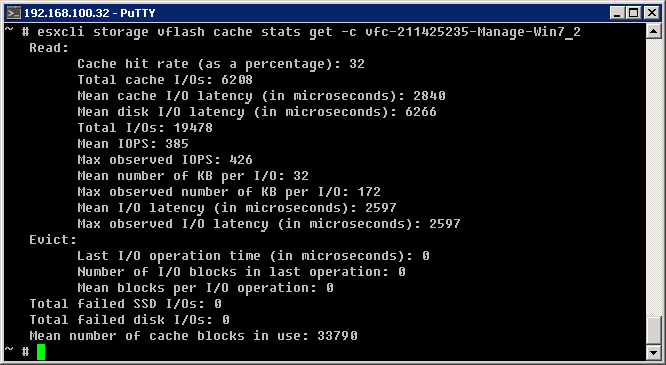
So, my opinion - statistics is no good. Not only that the data it does not understand the mere mortal, as they are also taken from the ceiling. Suppose the most interesting indicator, the percentage of hitting the cache, from the very beginning of the test was equal to 36, after which within 2 hours it went down to 32%. Fake. The remaining parameters are no better and have no relation to reality. Personally, I rejected the statistics. No good.
The statistics of the vSphere itself is also oddity. After connecting the vFRC, the statistics on transferring the amount of data for reading and writing all VM disks stops being saved. That is, there is just zero. The recording latency becomes about 50ms (although in reality it is not). Such it is only displayed in the statistics. Upgrading to vSphere 5.5-u2 did not correct the situation.
What does the statistics on VM latency for reading from the vSphere graphical environment show us? And everything is fine there:
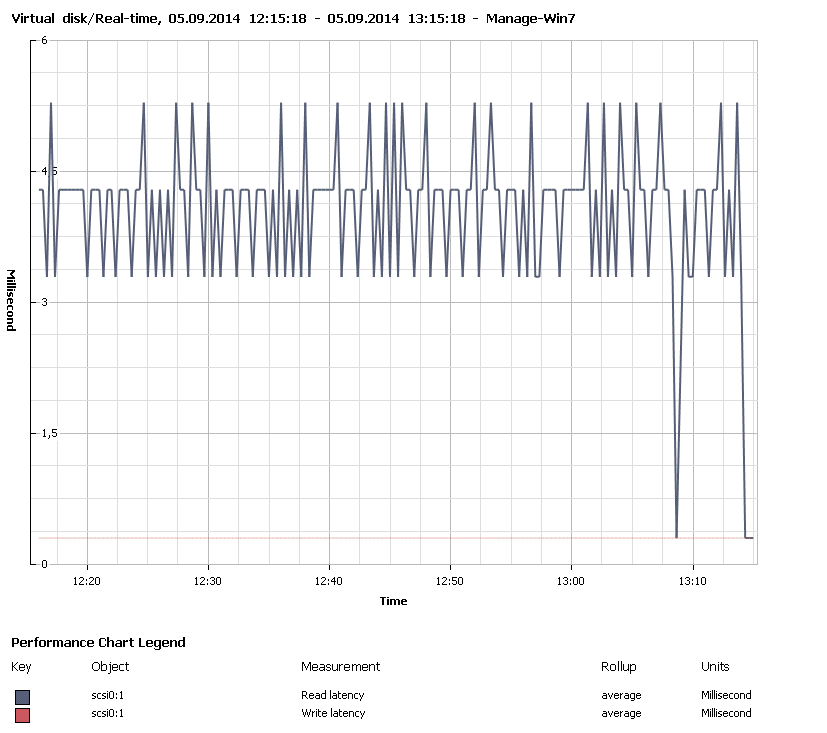
Excellent latency. The effect of changing storage for the VM disk is not detected.
A small conclusion: the technology is quite suitable and working. Yes, there are some flaws, but they will probably be fixed, and you can use it now :)
For greater efficiency, it is recommended to use a PCI-E SSD under vFRC. PCI-E cards must be compatible with ESXi at the driver level.
Source: https://habr.com/ru/post/235785/
All Articles