How do we conduct A / B tests
Recently on Habré there are more and more posts about the feasibility of conducting A / B testing (about their benefits, increasing conversions). If you carefully follow the instructions, a very interesting thing turns out: a slight change in the interface and output information logic can lead to a significant change in the conversion, if you multiply all the conversion numbers under such a cat, you can get a 2-fold increase.
I already imagine dozens or even hundreds of webmasters and managers who check every project change with the help of A / B tests, order an audit in usability laboratories and wait for the growth of conversions to notorious 2 times. What is actually happening - let's see ...
In fact, the A / B test is a common statistical experiment and fully complies with all the rules of statistics. According to these rules, the notion of a “change in conversion of 17%” cannot exist.
We were tasked with the top - to learn how to conduct A / B tests and use it all the time.
“What could be simpler” - I thought, we divide all traffic by user cookie into even / odd, we hang something in the URL and Ya.metrika or GA themselves will tell the whole truth about testing. I understand it now - how wrong.
We are very lucky. Our System Architect quickly got acquainted with the materiel and understood everything and made a simple interface for recalculating all the necessary parameters. We began to measure (for reference - the daily attendance of the site rarely falls below 30,000 unique users):
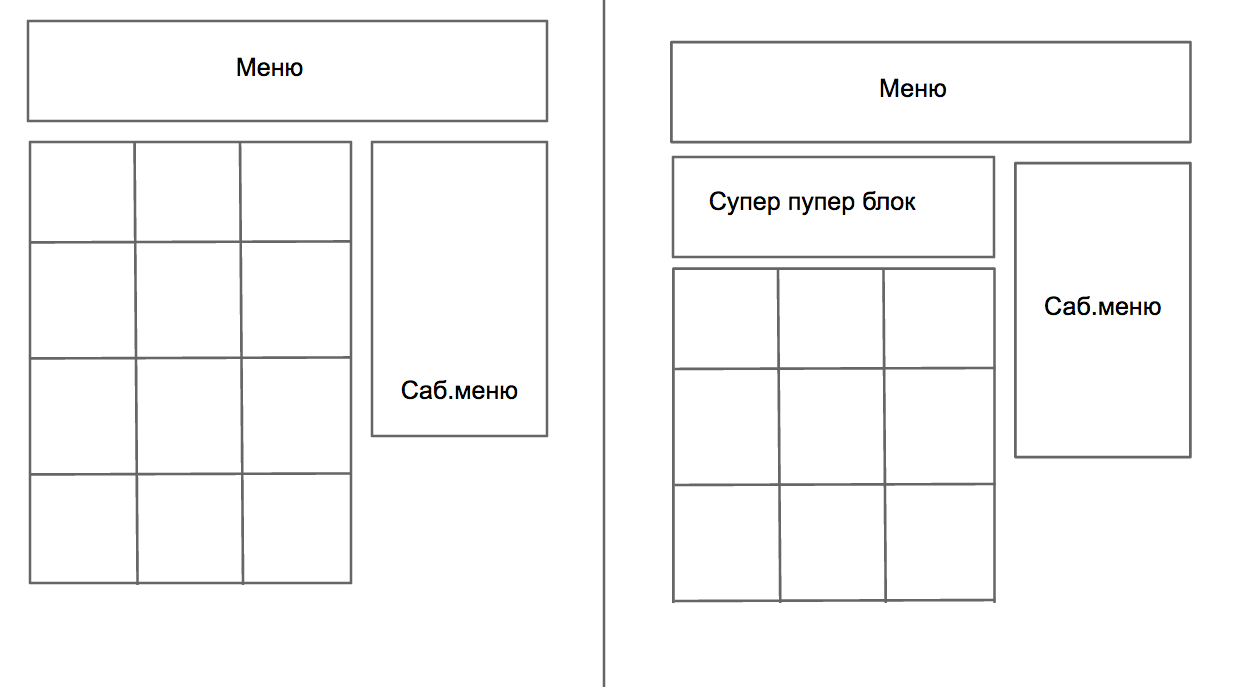
A / B test number 1 (Test for the presence of a block of recommendations for the user (I really wanted to start, give life to the project, get leads)):
I look, how to say, “according to the beacons”, the Architect writes everything.
First day + 10% of leads on the control group with a block, I rub my hands (it smells like a bonus).
Second + 9% - we light nothing
...
A week passed, on average for beacons - a good + 7%, I finish the A / B test, turn on the unit for all users. (The architect says, “the interval did not diverge.” I did not attach any importance to this).
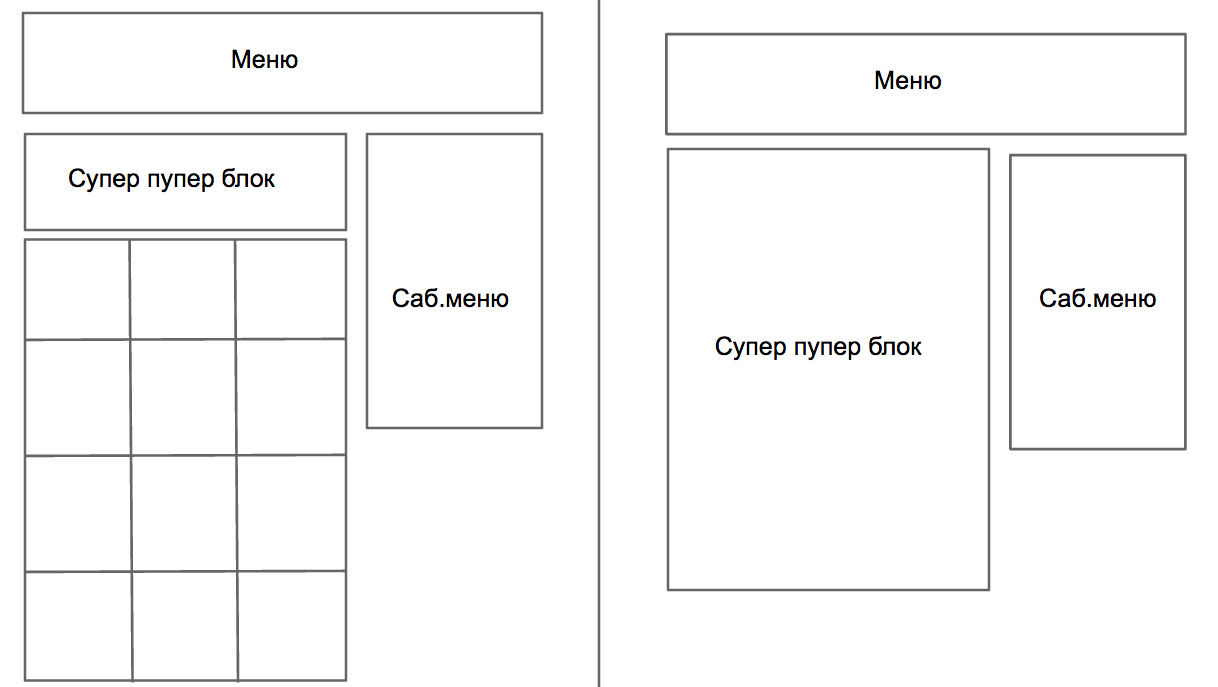
A / B test number 2 (Test block size recommendations)
They drove the test for more than a month - a significant result - no.
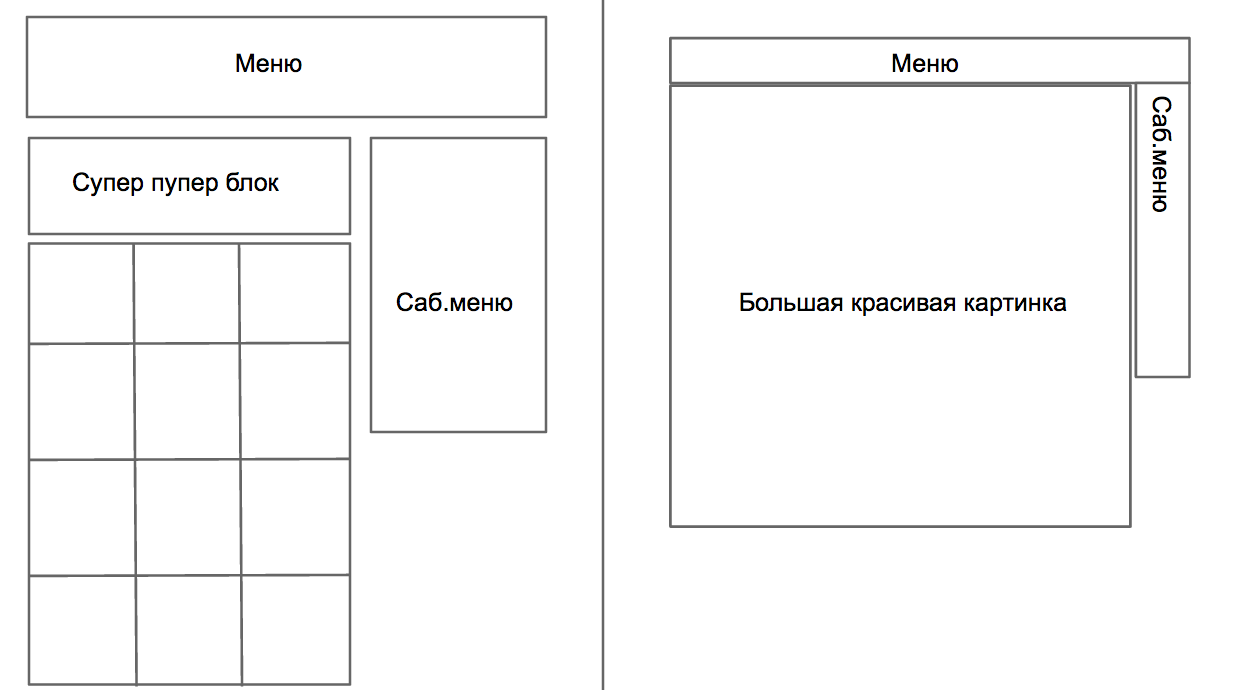
We report to the leadership of the voice - learn how to carry out A / B tests - we can count everything. What does the new task do? And let's make a site like Apple.com with one big picture and a minimalistic menu.
/ test №3 (Aggregator vs Monobrand)
“You can't do that, we worked so hard on dynamic recommendations - and then hello, like Apple.com” - there were a lot of emotions, but we had nothing to do - we did something, started the test.
The first day and the test page brings more and more - by 13%. I am terrified, but what about my expertise ... began to bot botch the materiel.
The second day - the indicators equaled, I realized that you need to wait.
10 days passed, the confidence interval was finally sold, the old page turned out to be really better, but not by several times, but a little bit. On the overall conversion rate by refrigerator + 12% with a confidence interval of 10%, i.e. just 2 percent you can be sure or to drive the test further.
When carrying out A / B tests, I ask you not to make my mistakes, check the statistical significance of the results, ask how these or other conclusions were made, on the basis of what.
P.Y. A / B tests for projects for the second thousand Russian Alexis is a myth. Traffic is not enough.
I already imagine dozens or even hundreds of webmasters and managers who check every project change with the help of A / B tests, order an audit in usability laboratories and wait for the growth of conversions to notorious 2 times. What is actually happening - let's see ...
In fact, the A / B test is a common statistical experiment and fully complies with all the rules of statistics. According to these rules, the notion of a “change in conversion of 17%” cannot exist.
For those who are interested in the rationale
It may exist: change in conversion by 17% with a confidence interval of 10% (in this case, the change is significant).
And maybe so: a change in conversion of 17% with a confidence interval of 20% (in this case, the change is insignificant).
')
What variables need to know to change the differences with a confidence interval?
1) The size of the control groups (introductory: 95% confidence interval, statistical power 80%);
 where
where
where δ is the minimum detectable effect in%;
p - basic conversion
n is the number of participants in each group.
Then for the base conversion of 2% and a change of 17% (0.34%) you need:
n = (16 * 0.02 * (1-0.0034)) / 0.0034² = 27731 participants in each group, in order to fix the change significant.
2) Confidence interval:
 where
where
p - basic conversion
n is the number of participants in each group.
z - 2 for 95% accuracy, 3 for 99.8% accuracy
An example of a confidence interval for a conversion of 2%, an accuracy of 95% and a sample size of 10,000:
 = 0.0028 (0.28%, which means that all values obtained during the experiment, but lying between 2.28 and 1.72 are not significant).
From this it can be assumed that for most sites on the Runet, conducting A / B tests cannot give a significant result, they simply have little traffic.
Although now the majority of SaaS solutions show the results of A / B tests on any and even statistically insignificant sample, a lot of wrong conclusions can be drawn from here.
And maybe so: a change in conversion of 17% with a confidence interval of 20% (in this case, the change is insignificant).
')
What variables need to know to change the differences with a confidence interval?
1) The size of the control groups (introductory: 95% confidence interval, statistical power 80%);
wherewhere δ is the minimum detectable effect in%;
p - basic conversion
n is the number of participants in each group.
Then for the base conversion of 2% and a change of 17% (0.34%) you need:
n = (16 * 0.02 * (1-0.0034)) / 0.0034² = 27731 participants in each group, in order to fix the change significant.
2) Confidence interval:
wherep - basic conversion
n is the number of participants in each group.
z - 2 for 95% accuracy, 3 for 99.8% accuracy
An example of a confidence interval for a conversion of 2%, an accuracy of 95% and a sample size of 10,000:
= 0.0028 (0.28%, which means that all values obtained during the experiment, but lying between 2.28 and 1.72 are not significant).From this it can be assumed that for most sites on the Runet, conducting A / B tests cannot give a significant result, they simply have little traffic.
Although now the majority of SaaS solutions show the results of A / B tests on any and even statistically insignificant sample, a lot of wrong conclusions can be drawn from here.
We were tasked with the top - to learn how to conduct A / B tests and use it all the time.
“What could be simpler” - I thought, we divide all traffic by user cookie into even / odd, we hang something in the URL and Ya.metrika or GA themselves will tell the whole truth about testing. I understand it now - how wrong.
We are very lucky. Our System Architect quickly got acquainted with the materiel and understood everything and made a simple interface for recalculating all the necessary parameters. We began to measure (for reference - the daily attendance of the site rarely falls below 30,000 unique users):
A / B test number 1 (Test for the presence of a block of recommendations for the user (I really wanted to start, give life to the project, get leads)):
I look, how to say, “according to the beacons”, the Architect writes everything.
First day + 10% of leads on the control group with a block, I rub my hands (it smells like a bonus).
Second + 9% - we light nothing
...
A week passed, on average for beacons - a good + 7%, I finish the A / B test, turn on the unit for all users. (The architect says, “the interval did not diverge.” I did not attach any importance to this).
A / B test number 2 (Test block size recommendations)
They drove the test for more than a month - a significant result - no.
We report to the leadership of the voice - learn how to carry out A / B tests - we can count everything. What does the new task do? And let's make a site like Apple.com with one big picture and a minimalistic menu.
/ test №3 (Aggregator vs Monobrand)
“You can't do that, we worked so hard on dynamic recommendations - and then hello, like Apple.com” - there were a lot of emotions, but we had nothing to do - we did something, started the test.
The first day and the test page brings more and more - by 13%. I am terrified, but what about my expertise ... began to bot botch the materiel.
The second day - the indicators equaled, I realized that you need to wait.
10 days passed, the confidence interval was finally sold, the old page turned out to be really better, but not by several times, but a little bit. On the overall conversion rate by refrigerator + 12% with a confidence interval of 10%, i.e. just 2 percent you can be sure or to drive the test further.
When carrying out A / B tests, I ask you not to make my mistakes, check the statistical significance of the results, ask how these or other conclusions were made, on the basis of what.
P.Y. A / B tests for projects for the second thousand Russian Alexis is a myth. Traffic is not enough.
Source: https://habr.com/ru/post/235597/
All Articles