A / B test is easy

A / B testing is a powerful marketing tool to increase the efficiency of your online resource. With the help of A / B tests, they improve the conversion of landing pages, select the optimal ad headers in advertising networks, and improve the quality of search.
I often have to deal with the tasks of organizing A / B testing in various Internet projects. In this article I want to share the necessary basic knowledge for testing and analyzing the results.
Why do we need A / B tests?
So, let's imagine the situation, our project is launched, the traffic is collected on it, users are actively using the resource. And one day we decided to change something, for example, to place a pop-up widget for the convenience of subscribing to news.
')
Our solution is an intuitive assumption that it will be easier for users of the resource to subscribe to new materials, we expect an increase in the number of subscribers.
Our assumptions and hypotheses are based on personal experience and our views, which do not necessarily coincide with the views of the audience of our resource. In other words, our assumption does not mean that after making changes we will get the desired effect. To test such hypotheses, we conduct A / B tests.
How do we conduct tests?
The idea of A / B testing is very simple. Resource users are randomly divided into segments. One of the segments remains unchanged - this is the control segment “A”, based on the data for this segment, we will evaluate the effect of the changes made. Users from the “B” segment are showing the modified version of the resource.
To obtain a statistically significant result, it is very important to exclude the influence of the segments on each other, i.e. The user must be strictly related to one segment. This can be done, for example, by writing a segment label in browser cookies.
To reduce the influence of external factors , such as advertising campaigns, day of the week, weather or seasonality, it is important to take measurements in the segments, ie in the same time period.
In addition, it is very important to exclude internal factors that can also significantly distort the test results. Such factors can be actions of call-center operators, support service, editorial work, developers or resource administrators. You can use filters in Google Analytics.
The number of users in the segments is not always possible to be made equal; therefore, the metrics, as a rule, are chosen relative, i.e. without reference to the absolute values of the audience in the segment. Rationing is carried out either on the number of visitors or on the number of page views. For example, such metrics can be the average check or CTR links.
One of the reasons to divide the audience disproportionately can be a significant change in the interface. For example, a complete update of the outdated site design, changing the navigation system, or adding a pop-up form to collect contact information. Such changes can lead to both positive and negative effects in the work of the resource.
If there is a fear that the change may have a strong negative effect, for example, lead to a sharp outflow of the audience, then, at the first stage, it makes sense to make the test segment not very large. In the absence of a negative effect, the size of the test segment can be gradually increased.
What is improving?
If you are going to conduct A / B testing on your resource, then surely your project has already formed the main indicators that need to be improved. If there are no such indicators, then it's time to think about them.
Indicators are primarily determined by the objectives of the project. Below are several popular metrics that are used in online projects.
Conversion
Conversion is calculated as the proportion of the total number of visitors who committed an action. The action may be filling out a form on the landing page, making a purchase in an online store, registering, subscribing to news, clicking on a link or a block.
Economic metrics
As a rule, these metrics are applicable for online stores: the average check amount , the revenue volume, referred to the number of visitors to the online store.
Behavioral factors
Behavioral factors include the assessment of the interest of visitors in the resource. Key metrics are: page depth - the number of pages viewed, related to the number of visitors to the site, the average session duration , the bounce rate - the proportion of users who left the site immediately after the first call, the retention rate (can be considered as 1 minus% new users).
One indicator is not always enough to assess the effect of the changes. For example, after changes on the website of the online store, the average check may decrease, but the total revenue will increase due to the increase in the conversion of the visitor into the buyer. In this regard, it is important to monitor several key indicators.
Results analysis
Well, the key indicators are determined, the test is launched and we received the first data. At this point, especially if the data meets our expectations, there is a temptation to draw hasty conclusions about the test results.
Do not rush, the values of our key indicators may change from day to day - this means that we are dealing with random variables. For comparison of random variables, average values are estimated, and to estimate the average value, it takes some time to accumulate history.
The effect of a change is defined as the difference between the average values of a key indicator in the segments. Then the next question arises: how confident are we about the reliability of the result obtained? If we test again, what is the probability that we will be able to repeat the result?
Below in the pictures are examples of the distribution of the indicator values in the segments.
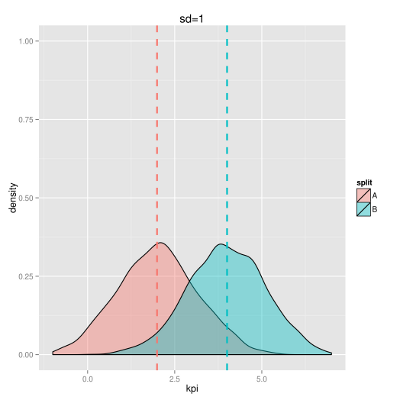

Distribution graphs characterize the frequency of occurrence of one or another value of a random variable in a sample. In this case, all values are distributed around the mean.
In both pictures, the average values of the indicator in the respective segments are the same, the pictures differ only in the spread of values .
This example illustrates well that the difference in average values is not enough to consider the result reliable , it is also necessary to estimate the area of intersection of the distributions.
The smaller the intersection, the more confidently we can say that the effect is really significant. This “confidence” in statistics is called the significance of the result .
As a rule, for making a positive decision on the effectiveness of changes, the significance level is chosen to be 90%, 95% or 99%. The intersection of the distributions is thus 10%, 5% or 1%, respectively. With a low level of significance, there is a danger of making erroneous conclusions about the effect obtained as a result of the change.
Despite the importance of this characteristic, in A / B test reports, unfortunately, it is often forgotten to indicate the level of significance at which the result was obtained.
By the way, in practice, about 8 out of 10 A / B tests are not statistically significant.
It should be noted that the greater the volume of traffic in the segments, the smaller the spread of average daily values of the indicator. With a small traffic due to the large spread of random values, it will take more time to conduct an experiment, but in any case it is better than not to conduct an experiment at all.
Assess the significance of the results
To compare random variables, mathematics came up with a whole section called testing statistical hypotheses . There are only two hypotheses: “zero” and “alternative”. The null hypothesis suggests that the difference between the average values of the indicator in the segments is insignificant. An alternative hypothesis suggests the existence of a significant difference between the average values of the indicator in the segments.
To test hypotheses, there are several statistical tests. Tests depend on the nature of the measured indicator. In general, if we consider daily average values, we can use Student’s t test . This test is well proven for small amounts of data, because takes into account the sample size when assessing significance.
As an example, I will give a comparison of the average session duration in segments on one of the resources for which I conducted the experiment: studentttest.xls .
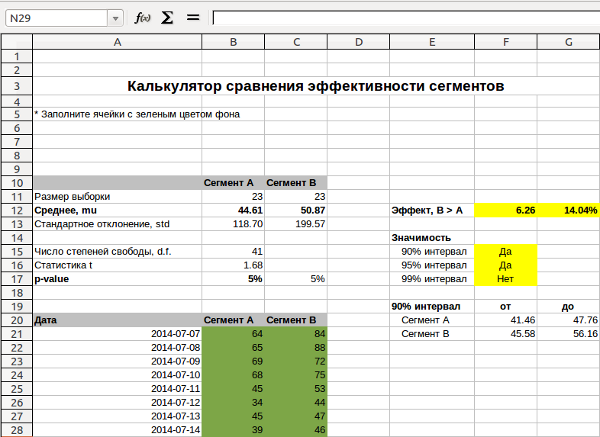
Student's test is universal, it can be used both for conversion measurements and for such quantitative indicators as an average check, average viewing depth or time spent by a user on a site.
In case you measure only conversion, then you are dealing with a binary random value that takes only two values: the visitor is “converted” and “not converted”. To assess the statistical significance in this case, you can use the online calculator .
Instruments
To organize the test, a tool is needed that allows you to mark the audience by segment and calculate the values of key indicators separately in each segment.
If your resources allow, then such a tool can be implemented independently based on the analysis of user activity logs. If resources are limited, then you should use a third-party tool. For example, Google Analytics has the ability to define custom segments .
There are a number of services that allow you to fully automate the testing process, for example, the same Google Analytics Experiements , examples of other services can be found in the review .
So what is next?
The article provides basic knowledge necessary for conducting A / B tests and analyzing results. The next step is product analytics. In conclusion, I would like to share a link to an excellent presentation on product analytics with examples of A / B testing from Evgeny Kuryshev.
Source: https://habr.com/ru/post/233911/
All Articles