Web mapping and SVG effects
Recently, SVG is increasingly used in the front-end, here and there, well-known developers write good articles in their blogs. In general, SVG, it seems, is finally starting to take a well-deserved position in the technology stack of a modern web developer. So today I propose to talk about how you can use SVG in web cartography. We will look at how you can use the features of SVG and the properties migrated from it to CSS to achieve different visual effects. We will use Leaflet and sometimes D3 , but nothing prevents us from using other libraries. Filters, patterns and other effects are waiting for you under the cut.
The article will mention all sorts of effects and techniques available to us in SVG, I will not dwell on their implementation, assuming that you are already familiar with them or want to learn after reading this article. For these purposes, I recommend the following collection of articles: A Compendium of SVG Information . The code for all the examples is available on GitHub via bl.ocks.org , and is even accompanied by a few comments. But if there are any questions, ask, I will try to answer them. So, let's begin.
We can work directly with SVG-objects of the vector layer of the map and markers (if they are specified by a vector) and use the effects available to us in SVG, any, directly.
')
Filters - the capabilities of SVG filters are truly awesome, although it is quite difficult for them to find practical application with respect to maps, but such an effect as blurring can be very useful. To deal with filters, I advise you to look here: Smarter SVG filters .
Patterns , they can be added to any polygons (by the way, for the mask, the pattern can also be used). And yes, I am aware that TileMill can do this, but there the patterns are given by a picture, with all the consequences. In our case, we will be able to set them programmatically, and again, all this can be animated. You can try out various options in this demo: web maps and animated SVG patterns . In the above demo, the pattern animation is implemented using JavaScript (D3).
Today, some effects from SVG moved to CSS, so we can use them for raster layers, but here we need to carefully look at the degree of support by the browser.
CSS filters . You can use the functions, but for now it is better to limit yourself to links to SVG filters, the degree of browser support: CSS Filter Effects . As an example, such an elementary thing as the grayscale filter will allow you to get rid of the extra raster layer or redraw using the canvas (the Grayscale plugin from Zverik ), which is not bad in itself. And this is also a simple opportunity to tweak the map style, without having to deal with cartoCSS and even more so with Mapnik .
Clipping and masking allow us to combine several raster map layers at once, which can be very convenient, given the fact that we can easily manage the edges of the crop and even animate it, as well as control the transparency. Here, some may argue that all this is self-indulgence and no one needs it, because no one does. And in general, the usual translucent polygons on top of the tiles is enough to indicate some area. Here I disagree with you. First, by imposing translucent polygons, we break the color scheme (coding) of the map and “shade” the geo-information contained on our raster layer, as a result the map becomes less readable, but if we confine ourselves only to the designation of the border, it can be quite difficult to select Some objects are compared to others, especially if there are several categories.
But in any case, it is necessary to proceed from a specific task, but for now we will just have to keep in mind that this is possible. The truth is there is a spoon of tar, not everything works as it should and not everywhere. Firefox works best, webkit-based browsers are worse: there are more modest bugs and features (masks only work with full-featured .svg files). IE, well, there's nothing to even say, more precisely, nothing.
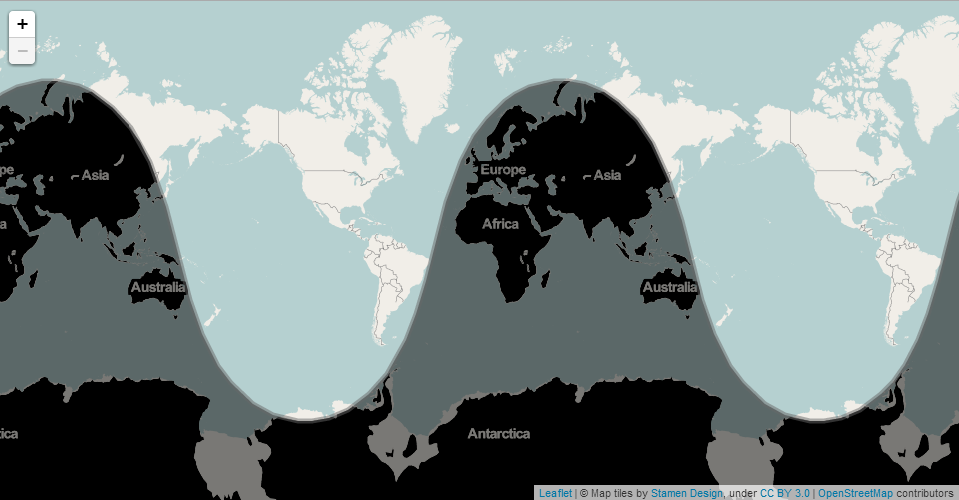
As an example, I will give the solar terminator , here clipping is used to achieve the corresponding visual effect. At the moment in the webkit-based browsers the picture does not change when the clip-path data is updated. And when updating the cropped image, it is first shown in full and only then as expected. In firefox, normal flight. Here is a demo with the ability to create polygons yourself: Dynamic tiles clipping .

Here, in order to get the
In this case, it was not necessary, because you could get the data directly, using
You can also use masks in a similar way, however, at the moment SVG masks work only in firefox. In webkit-based browsers, you should use a black and white image as a mask. Firefox demo: Dynamic tiles masking .
Lighting effects . SVG has the ability to use various lighting effects, using them, we can create overlay with hillshading based on the height data, I didn’t do this, but someone might be interested ...
And again SVG. First, we can animate the markers themselves: Simple animated marker . Secondly, you can create an animation of the movement of the marker on the map, using the movement along the
I hope after reading this article you will more actively use SVG and other features of modern browsers in your projects. And just the other day, the guys from MapBox rolled out a new tool for rendering a vector image - MapBox GL , so everything goes to the point that it will soon be possible to make a full-fledged animation.
And in the next version of Leaflet (0.8), the integration of custom layers (recalling D3) should be improved, in general, if things continue to go like this, then cartographic cartoons will soon be made =)
That's all, thank you for your attention and good luck to all.
On the Rights of Excuse
The article will mention all sorts of effects and techniques available to us in SVG, I will not dwell on their implementation, assuming that you are already familiar with them or want to learn after reading this article. For these purposes, I recommend the following collection of articles: A Compendium of SVG Information . The code for all the examples is available on GitHub via bl.ocks.org , and is even accompanied by a few comments. But if there are any questions, ask, I will try to answer them. So, let's begin.
Vector layers
We can work directly with SVG-objects of the vector layer of the map and markers (if they are specified by a vector) and use the effects available to us in SVG, any, directly.
')
Filters - the capabilities of SVG filters are truly awesome, although it is quite difficult for them to find practical application with respect to maps, but such an effect as blurring can be very useful. To deal with filters, I advise you to look here: Smarter SVG filters .
Patterns , they can be added to any polygons (by the way, for the mask, the pattern can also be used). And yes, I am aware that TileMill can do this, but there the patterns are given by a picture, with all the consequences. In our case, we will be able to set them programmatically, and again, all this can be animated. You can try out various options in this demo: web maps and animated SVG patterns . In the above demo, the pattern animation is implemented using JavaScript (D3).
Raster layers
Today, some effects from SVG moved to CSS, so we can use them for raster layers, but here we need to carefully look at the degree of support by the browser.
CSS filters . You can use the functions, but for now it is better to limit yourself to links to SVG filters, the degree of browser support: CSS Filter Effects . As an example, such an elementary thing as the grayscale filter will allow you to get rid of the extra raster layer or redraw using the canvas (the Grayscale plugin from Zverik ), which is not bad in itself. And this is also a simple opportunity to tweak the map style, without having to deal with cartoCSS and even more so with Mapnik .
Clipping and masking allow us to combine several raster map layers at once, which can be very convenient, given the fact that we can easily manage the edges of the crop and even animate it, as well as control the transparency. Here, some may argue that all this is self-indulgence and no one needs it, because no one does. And in general, the usual translucent polygons on top of the tiles is enough to indicate some area. Here I disagree with you. First, by imposing translucent polygons, we break the color scheme (coding) of the map and “shade” the geo-information contained on our raster layer, as a result the map becomes less readable, but if we confine ourselves only to the designation of the border, it can be quite difficult to select Some objects are compared to others, especially if there are several categories.
But in any case, it is necessary to proceed from a specific task, but for now we will just have to keep in mind that this is possible. The truth is there is a spoon of tar, not everything works as it should and not everywhere. Firefox works best, webkit-based browsers are worse: there are more modest bugs and features (masks only work with full-featured .svg files). IE, well, there's nothing to even say, more precisely, nothing.
As an example, I will give the solar terminator , here clipping is used to achieve the corresponding visual effect. At the moment in the webkit-based browsers the picture does not change when the clip-path data is updated. And when updating the cropped image, it is first shown in full and only then as expected. In firefox, normal flight. Here is a demo with the ability to create polygons yourself: Dynamic tiles clipping .
Here, in order to get the
clipPath data clipPath we use the reprojection function, thus linking Leaflet and D3: //Convert Leaflet geometries to D3 geometries function projectPoint(x, y) { var point = map.latLngToLayerPoint(new L.LatLng(y, x)); this.stream.point(point.x, point.y); }; //Initialize SVG layer in Leaflet (works for leaflet-0.7.3) map._initPathRoot() var transform = d3.geo.transform({point: projectPoint}), path = d3.geo.path().projection(transform); In this case, it was not necessary, because you could get the data directly, using
layer._path for each of the vector layers. But the approach used clearly demonstrates how to link geodata in Leaflet and D3.You can also use masks in a similar way, however, at the moment SVG masks work only in firefox. In webkit-based browsers, you should use a black and white image as a mask. Firefox demo: Dynamic tiles masking .
Lighting effects . SVG has the ability to use various lighting effects, using them, we can create overlay with hillshading based on the height data, I didn’t do this, but someone might be interested ...
Markers
And again SVG. First, we can animate the markers themselves: Simple animated marker . Secondly, you can create an animation of the movement of the marker on the map, using the movement along the
path element, for example, my article on this topic: Animation of the SVG-element path , since then a lot of other articles have appeared in the network. And to Leaflet there is a separate plugin for this business: Animated Marker .Future is coming
I hope after reading this article you will more actively use SVG and other features of modern browsers in your projects. And just the other day, the guys from MapBox rolled out a new tool for rendering a vector image - MapBox GL , so everything goes to the point that it will soon be possible to make a full-fledged animation.
And in the next version of Leaflet (0.8), the integration of custom layers (recalling D3) should be improved, in general, if things continue to go like this, then cartographic cartoons will soon be made =)
That's all, thank you for your attention and good luck to all.
Source: https://habr.com/ru/post/232761/
All Articles