Comparison of audio recognition algorithms for Second Screen
Introduction
To date, there are many methods of sound recognition. In the most general form, most of the methods consist of the algorithm for constructing a signature (fingerprints) of a signal (the most compact and most accurately describing a set of tracks), its search algorithm in the database and the algorithm for cutting off false positives. We were faced with the task of choosing a technology for building second screen applications.
The comparison of recognition algorithms based on known accuracy characteristics is rather arbitrary, since these characteristics are obtained on different test data and with different errors of the first kind (false positives). Also, based on the context of the task, we were interested in the efficiency of the algorithm in relation to the recognition of the TV broadcast audio signal, with distortions caused by the parameters of the microphones of modern mobile devices.
Since no comparative data was found in open sources that met our requirements, it was decided to conduct our own research of sound recognition algorithms, taking into account the specifics of the audio stream and distortions. As a potential candidate, we chose the algorithms of J. Haitsma and A. Wang. Both are widely known and based on the analysis of time-frequency features obtained using the window Fourier transform.
Description of the signature generation methods under consideration
The audio signal signature design scheme proposed by Jaap Haitsma and Ton Kalker in [1] is shown in Figure 1. Table 1 shows the images obtained at each stage of the algorithm.
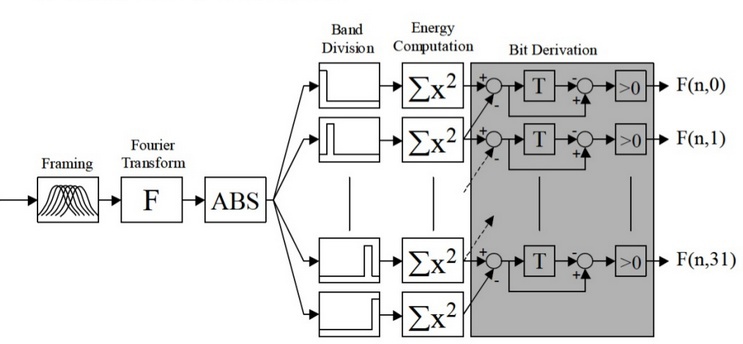 |
| Figure 1 - Jaap Haitsma and Ton Kalker signature generation scheme |
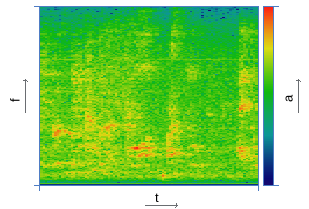
The signal's spectrogram is constructed using the Hanna window with an overlap of 31/32. For example, for a window size of 0.37 s, the spectrogram discretization step along the time axis is 11.6 ms. In the next step, the algorithm divides the frequency axis into 33 subranges on the mel scale, and for each point in time, the total energy in the subband is calculated. The resulting time distribution of energy is encoded in accordance with the expression:
')

Where
 - energy
  th frame in subrange
  .
.Table 1 - The main stages of building a signature Jaap Haitsma and Ton Kalker
| Signal fragment | |
| Original | Distorted |
| Construction of the spectrogram | |
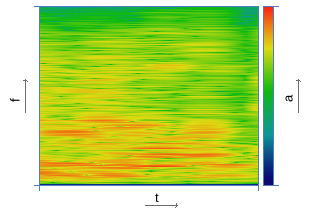 | 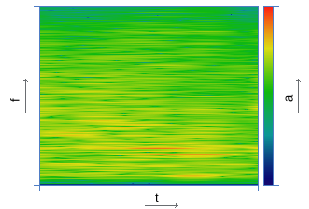 |
| Calculating the distribution of energy across subranges | |
 | 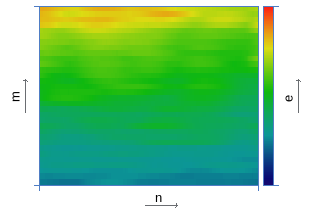 |
| Energy distribution coding | |
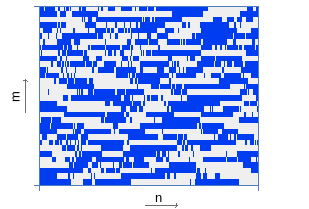 | 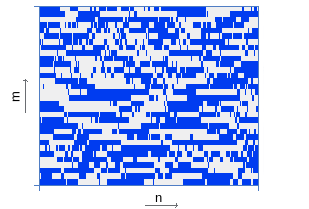 |
Thus, each signal interval of 11.6 ms is described by a 32-bit word. As shown by experimental studies [1], 256 words are sufficient for reliable and resistant to many types of recognition distortion, which corresponds to a 3-second query.
The approach to recognition proposed by Avery Li-Chun Wang [2] is based on the amplitude peaks of the spectrogram and their connections into pairs, called constellations.
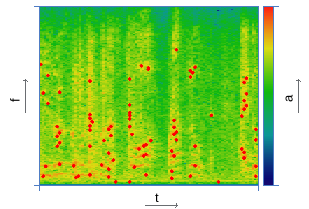
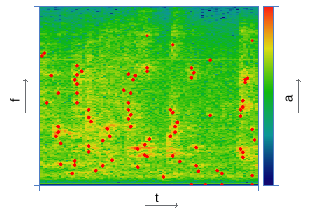
The main difficulty in the implementation of this approach lies in the algorithm for searching for peaks that are resistant to distortion. In [3, 4], examples of relevant techniques are presented. Among the set of local maxima of the spectrogram, peaks with maximum energy are selected. At the same time, in order for the track description to be stable to noise, it is necessary to ensure their diversity in frequency and in time. For this, various techniques of blurring and threshold clipping are used [3, 4]. The spectrogram of the audio track, as a rule, is divided into frames along the time axis, each of which is characterized by a certain number of peaks. By limiting their density in this way, it is possible to leave the peaks with the maximum probability of survival, while describing in detail the change in the spectrum over time. As an example, table 2 presents the images obtained at the main stages of the algorithm.
Table 2 - The main stages of building a signature proposed by A. Wang
| Signal fragment | |
| Original | Distorted |
| Construction of the spectrogram | |
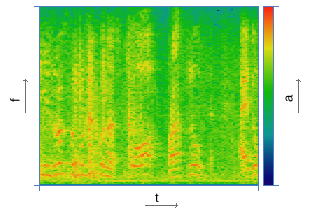 |  |
| Peak search | |
 |  |
| Pairing peaks | |
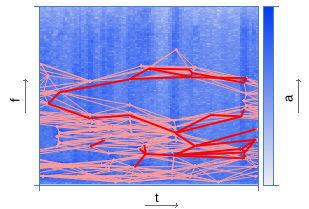 |  |
To speed up the search process, the peaks are combined in pairs - each peak is associated with a number of other peaks located to the right along the time axis within a certain target zone. The acceleration factor is estimated by the equation:
Where
 and
and  - the number of bits required to encode the peak and their pairs, respectively;
 - the number of peaks associated with the reference (branching ratio).
At the same time, increasing the uniqueness of the hash is accompanied by a decrease in the probability of its survival, which is approximately estimated as:
Where
 - the probability of survival of the peak spectrogram.
Therefore, it is necessary to find the values of peak density and branching ratio
, providing a compromise between the search speed and the probability of recognition of the signal.A signal signature consists of two components: a pair hash and its offset code along the time axis. The minimum number of bits required to encode a pair is determined by the equation:
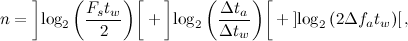
Where
 - signal sampling frequency;
  ,
,  - the size and pitch of the window used in the construction of the spectrogram;
  ,
,  - respectively, the maximum allowable distance along the time axis and frequency axis between the peaks of the pair;
  - taking the nearest largest integer.
The results of an experimental study
Based on the field of use, the comparison of the above recognition approaches was carried out on the basis of audio tracks of the on-air body for a total duration of 2000 minutes. As test signals, recordings of original tracks played on TV and recorded on mobile devices of the iPhone 4, Nexus 7, Samsung GT3100 at various distances from the signal source in the presence of extraneous noise inherent in the environment were used. The test mono signals had a sampling rate of 8 kHz when encoding the amplitude with 16 bits. Of these, 2000 test queries were generated for a duration of 4 seconds.
When using the J. Haitsma signature, the search was carried out using the brute force method — directly comparing the query with each fragment in the database based on the Hamming metric. A query was considered found if, by bit-wise comparison, its signature and the signature of the found fragment coincided by more than 65%.
The construction of signatures on the principles of Wang was carried out with a Hanna window size of 64 ms, with a shift of 32 ms. An own variant of the search of the spectrogram peaks was implemented, which was more suitable for recognizing the audio signal of the TV air as compared to the prototype [3]. A fragment of 4 s on average was characterized by 200 peaks and was described by 1000 pairs. For decision making, we used the formalization of the concept of uniqueness of a peak in the score graph (score) for each variant of answers available in the database. The request was considered recognized if the score was unique.
Table 3 shows the results of the accuracy of the recognition algorithms obtained. An audio fragment was considered correctly recognized if the original track was correctly identified and the request offset in it.
Table 3 - Comparison of the accuracy of recognition algorithms
| Algorithm | Mobile device | |||||
| iPhone 4 | Nexus 7 | Samsung GT3100 | ||||
| fp ,% | fn ,% | fp ,% | fn ,% | fp ,% | fn ,% | |
| J. Haitsma, T. Kalker | 0.6 | eight | 0.6 | ten | 0.5 | 9 |
| On the principles of A. Wang | 0.6 | 20 | 0.6 | 25 | 0.6 | 24 |
| Note: fp - errors of the first kind (false positives); fn - errors of the second kind (false negatives). | ||||||
Conclusion
The J. Haitsma algorithm uses an integral approach to describe the distribution of energy across frequency bands, a differential approach to encode its change in time, and also a comparison of signatures based on the Hamming distance. All this makes this method potentially resistant to distortion. While the share of coincident pairs of peaks of the spectrogram ranges from 1% to 3%, which does not have the best effect on noise immunity and leads to a loss in recognition probability.
However, to use the full potential of J. Haitsma signatures, a search for a query in the database must be carried out using the brute force method. Our implementation of the algorithm for the GPU on the video card Radeon R9 290X provides a parallel search for 2048 requests in 0.6 seconds. Written using the libevent library, the server can handle a load of 1900 rps, with an average response time of 0.8 s. At the same time, industrial video cards are expensive, and ordinary ones have to be installed in standard ATX packages, which are at least 3 units in size. In one such case, we managed to place two cards. At the same time, our implementation of server recognition on the principles of A. Wang, on a Xeon CPU E5-2660 v2 @ 2.20GHz / 32Gb, can withstand a load of 2500 rps with an average response time of 8 ms.
I would like to note that we do not exclude the possibility of obtaining more optimal implementations of algorithms, and the results should be regarded as evaluative, not claiming to be absolute.
Bibliography
- Jaap Haitsma, Ton Kalker "A Highly Robust Audio Fingerprinting Syste"
- Avery Li-Chun Wang "An Industrial-Strength Audio Search Algorithm"
- D. Ellis "Robust Landmark-Based Audio Fingerprinting"
- E. Krofto “How Yandex recognizes music from a microphone”
Source: https://habr.com/ru/post/232463/
All Articles