What are stock indexes and why are they needed?
Everyone has come across the concept of stock market indices at least once in his life, or at least he heard that "the RTS and MICEX indices have updated a maximum since April." But what lies behind this concept, and why do we need stock indices? Today we will take a closer look at this question.
What is an index
The stock index is an indicator of price changes for a certain group of securities. You can think of the stock index as a “basket” of stocks combined on any basis.
')
Most importantly, when studying the index, it is from what stocks or bonds it is formed. It is the set of securities included in the list on the basis of which the index is calculated, which determines what information can be obtained by observing the dynamics of this index.
Why do we need indexes
In general, the main purpose of stock index compilation is to create an indicator with the help of which investors could characterize the general direction and “speed” of movement of stock quotes of companies in a particular industry.
Studying the dynamics of indices helps traders understand the impact on the quotes of certain events - if, for example, oil prices go up, then it is logical to expect an increase in the quotes of all oil companies. However, stocks of different companies are growing at different speeds (and some may not grow at all) - the index helps to understand the general trend of the market segment without having to assess the position of many disparate companies.
Comparing the indices to each other gives an insight into how different sectors of the economy trade in the market compared to each other.
A bit of history
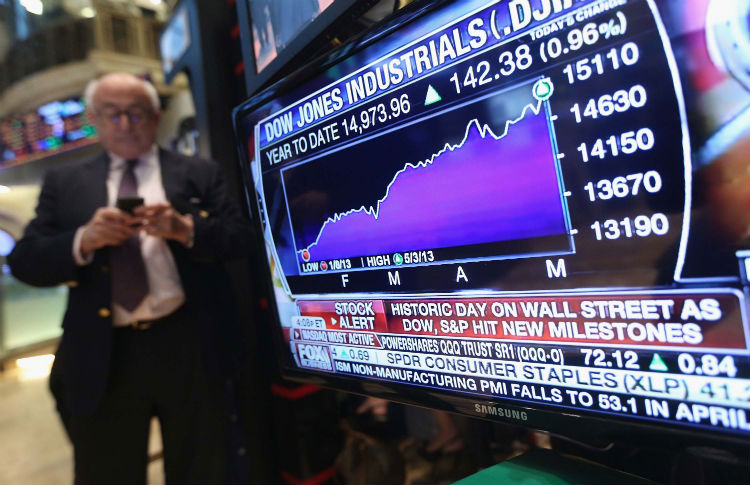
The first widespread index was the index created by Charles Dow in 1884. His calculation was based on the quotes of the 11 largest (and with the largest turnover of shares on the stock exchange) at that time the US transport companies - the index was called the Dow Jones Transportation Average. In 1896 an index appeared , which today is known as the Dow Jones Industrial Average, which united the major industrial companies of America.
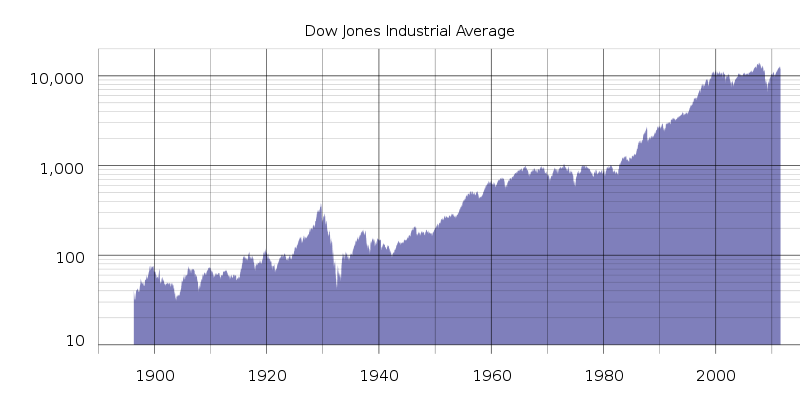
The word “Industrial” (Industrial) in today's realities is nothing more than a tribute to the tradition, since the indicator itself has long included companies that are not directly related to the industry.
Another famous index, the S & P 500, dates back to Standard & Poor’s first index, which was introduced in 1923. In its current form, the S & P 500 began life in March 1957 - by that time, technology allowed the index to be calculated in real time.
Index classification
There are many stock indexes that are created to solve specific problems. These tools are classified according to various criteria - according to the calculation method (component weighting), families, and author. Consider each type of index in order.
Index Calculation Methods
One of the oldest methods for calculating indices is the arithmetic mean method. Despite the fact that the initially famous industrial index Dow Jones Industrial Average was calculated precisely as an average weighted price of shares included in its list at a certain point in time, this method is not very effective, since the number of shares issued by companies may differ by orders of magnitude - one company may issue a million shares, and another - several tens of thousands. Naturally, this will not allow to get any representative value of the index itself.
The divisor for calculating the average aphometrical was originally 11 - the number of stocks included in the index. Now, a scalable average is used for the calculation - the sum of prices is divided by the divisor, which changes each time the stocks included in the index are crushed or combined. This allows even with changes in the structure of stocks included in the index, to preserve the possibility of their comparison.
With all this, the Dow Jones industrial index still retains the nature of the calculation of a simple arithmetic average - this follows from its name (Industrial Average - industrial average). This method has advantages, the main ones being the simplicity of calculation and the speed of reaction to strong fluctuations in stock prices, which occur, for example, during stock market crises.
The downside is the lack of weights. The most expensive stocks have the greatest impact on the index, while the cheapest price changes have almost no effect on its value. At the same time, the price of the shares themselves does not directly affect the company's capitalization - the company, one share of which is expensive, may have less capitalization than the issuer of cheaper shares (and the yield of the shares themselves may even be lower). Indices of the AMEX family of the American stock exchange, as well as the Japanese Nikkei 225 Stock Average (calculated since 1949, combines 225 shares) are calculated according to a similar scheme.
There are also indices calculated by the formula of the arithmetic average weighted by the growth rate of stock prices - for example, the composite Value Value Composite Aithmetic Index (combines 1,700 shares with the NYSE and AMEX). The price of each share included in the index is multiplied by a coefficient corresponding to its share in the share capital of the company that issued it (the so-called “weight”).
Accounting for the growth rate of stock prices is a more efficient way of calculating because it reduces to zero the effect of price dispersion per share. In addition, when changing the list of stocks on the basis of which the index is calculated, it does not need to be separately adjusted.
Another method of calculating the index is the geometric average of the growth rate of stock prices - indexes of this type include the FT 30 index created by the Financial Times publication and the Value Line Composite Geometric Index (also combines 1,700 shares).
Most foreign and Russian stock indices are based on the value index formula - these include the indices of the NASDAQ, S & P, DAX (Germany), CAC (France), RTS and MICEX indices.
Index families
Above, we have repeatedly used the phrase "family of indices." Indeed, some index compilers are not limited to a single index, but create a whole family of similar tools.
One of the most popular indicators are indexes calculated by Standard & Poor's rating agency (S & P). These include the main S & P 500 index, which unites the 500 most capitalized US companies (80% are traded on the NYSE, 20% on AMEX). NASDAQ Exchange has its own family of indices - these indicators take into account the behavior of more than 4,500 US and foreign companies. These include the NASDAQ Composite composite index (unites all the companies listed on the stock exchange), the NASDAQ National Market (US companies), and the bulk of sectoral indices.
In Europe, a prominent family of indices are the indicators of the German stock market (DAX 30, Dax Price Index, DAX 100 Sector Indexes, etc.), French CAC, differing in the number of shares included in them (40, 80, 120, etc. ).
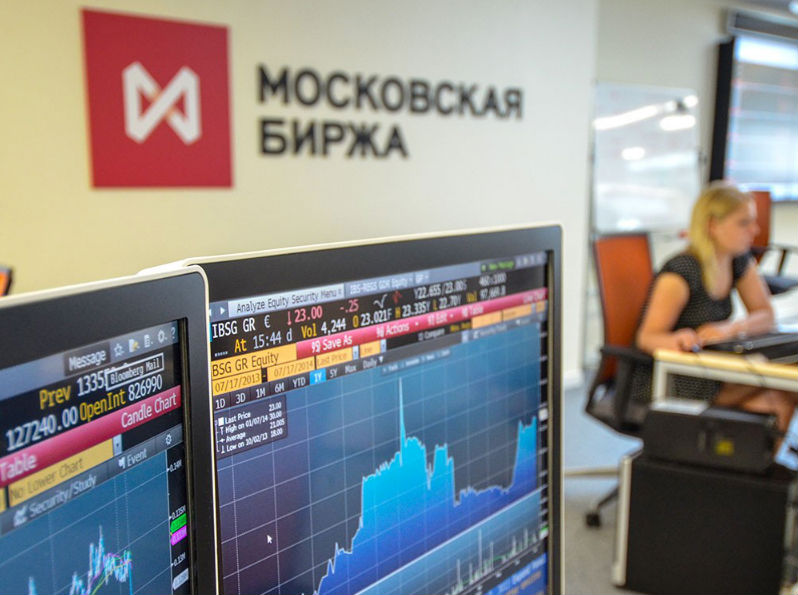
The Moscow Stock Exchange also has a family of indices — it includes the main indicators MICEX and RTS, as well as the blue chip index, second-tier and broad market indexes. In addition, the exchange calculates industry indices, as well as thematic indicators: the alternative blue chip index MICEX-10 , the MICEX innovations and the regional index.
Index Producers
Another way to classify indexes is by compiler. Indices can be “agency” when they are calculated by special agencies (for example, Standard & Poor’s S & P indices). The second option - stock indexes, created, in fact, by stock exchanges. In the US, this is the NASDAQ, and in Russia, the two main stock indices were calculated by the MICEX and RTS exchanges, which are now merged into a single Moscow Exchange.
In addition, the index compiler can be a brokerage company. For example, ITinvest calculates its own indices , among which are, for example, correlation indices (futures for the RTS index and the MICEX index, futures for the RTS index and the S & P 500 index), which are used to trade futures for the RTS index, fusion futures and other indicators.
What indexes show
The list of shares whose quotations are used to build an index is formed according to certain criteria, depending on the purpose of compiling a specific index.
The method of calculating indices implies the inclusion in them of financial instruments that have similar characteristics. In particular, the share capital of companies whose shares are counted in the index should not differ by orders of magnitude.

In general, it is believed that the movement of stock prices of well-known and large companies reflects the dynamics of trading in smaller financial instruments from the same industry (this is an important clarification). Sectoral stock market indices are needed in order to create hypotheses about the price movement dynamics of different companies of the same industry, even those not included in the index itself. Accordingly, sectoral indices help investors assess the prospects for investing in companies of a particular sector of the economy at a particular point in time.
Examples of sectoral indices can be well illustrated by the Dow Jones family, which includes:
- The DJIA Industrial Index is calculated based on the stock prices of the 30 largest companies in the leading US industries.
- DJTA Transport Index - covers the shares of the 20 largest American transport companies.
- The municipal DJUA index is the share of 15 electricity and gas supply companies. involved in gas and electricity.
There is also a composite index (DJCA - Dow Jones Composite Average) - an indicator based on the values of the three previous indices.
There are also specialized exchanges for companies united by a particular attribute. For example, the exchange of high-tech companies NASDAQ in the United States.
Often, indices are also compiled on a regional basis - for example, you can make lists of stocks of companies representing a particular country or groups of countries (for example, the European Union or blocks of type BRIC). Similar to industry indices, these indicators help investors better understand the state of affairs in the markets of specific regions and countries
An example of a regional index is the family of Morgan Stanley Capital International indexes (famous for MSCI investors). MSCI country indices are based on the stocks of companies in a particular country. There are also indices for individual markets - developed and emerging. For example, the MDCI Developed Market Index includes shares of companies from 24 countries in which stock markets are recognized as developed, and the MSCI Emerging Market Index, respectively, includes shares of companies from 27 countries that are classified as developing.
Current events
At the end of last week, many business media reported that the world's leading index providers plan to exclude Russian companies from their own indices. In particular, as reported by Vedomosti, one of the most famous compilers of the indices, MSCI, announced the launch of a number of new indices that do not include Russia. This was done in order to help investors avoid investments in a country under the sanctions of the European Union and the United States.
Another major provider, S & P Dow Jones, also announced that it was holding consultations on the possible exclusion of Russian companies.
Experts interviewed by Vedomostii generally consider such a decision to be a blow to the Russian economy, since under current conditions investors will not invest in domestic companies.
However, the chief economist of ITinvest Sergey Egishyants is convinced that not everything is so scary:
The meaning of [similar sanctions] is only one - a certain number of Western investment funds invest not in some specially chosen stocks, but in a certain index, where developers have driven companies on a certain basis (industry, geography, economic status, etc.) A “purchase” of such an index means, in essence, the acquisition of shares of all its member companies in the proportion set for them by the manufacturer of the index. Accordingly, the exclusion of corporations from it means that now these “index” funds no longer buy shares of the aforementioned corporations, or even sell off those that were already in their possession.
Those. for our stock market, this is simply another wave of escaping foreign money - and this time purely speculative (that is, not participating in the processes in the real economy): of course, this is unpleasant (the market is falling - although not much, because there is no such money and a lot) - but in principle it’s even good, because the less “hot” global money, the smaller the amplitude of market fluctuations due to various shocks.
The economy does not suffer from such somersaults at all - in the sense that it is simply not affected by these inflows-outflows: they all go past the real sector - and only a drop in the turnover of financial sector companies can somehow be considered a negative consequence for the national economy.
It’s just that in recent years we have had a very large share of this sector in the overall GDP growth - it is leading by a large margin: it’s another thing that these are mostly not brokers, but banks that distribute an insane amount of consumer loans - although this process is already being curtailed. In general, nothing terrible happened.
How to use indexes
In general, the existence of an index has several goals. They can be used for:
- Obtaining an idea of the overall dynamics of stock prices of a particular group (companies, countries, industries, etc.). Often this data is used to make speculative transactions.
- There are derivatives based on the index itself - for example, there are futures on the RTS index. Most often, such contracts are used to hedge risks (more details in our topic on futures).
- Obtaining information on changes in investor sentiment - if indices are growing, then investors are positive about prospects for investing in certain stocks.
- Monitoring indices over a long time allows us to get an idea of the investment climate in a particular country.
- Often, in addition to the actual value of the index, information is published on the total turnover of shares of its member companies. The change in these figures makes it possible to judge the total activity of traders in the market in transactions with securities of a certain type.
In the world created dozens, if not hundreds, of various indices. Any of these tools can be useful and perform a specific task. The most important thing is to use indices you need to know on the basis of which shares they are calculated. Then you can analyze the dynamics and understand the information that a particular index carries.
That's all for today! Thank you for your attention, we will be happy to answer questions in the comments.
PS If you see a typo or mistake, write a personal message and we will fix everything promptly.
Posts and related links:
Source: https://habr.com/ru/post/232441/
All Articles