Enlarge your pension-2: Rebalancing. Add risk to reduce risk!
We continue the theme of asset allocation for the pension portfolio. Usually, the Great Gurus of Financial Markets financial advisers in this place show in detail why investing in real estate — gold-bitcoin and other eternal values in their pure form — does not solve the problem of long-term investments. We will leave this for later, and now we will go straight to the dessert. Judging by the questions in the previous topic, not everyone immediately realized the power and greatness of rebalancing. So I quote :
Rebalancing returns the portfolio to the original proportions of asset allocation. Rebalancing is necessary because over time, some of your investments may break out of your chosen asset allocation. You may find that some of your investments will grow noticeably faster than others. For example, that you have decided that investment in stocks will be 60% of your portfolio. However, after the recent growth of the stock market, the proportion of shares increased to 80% of the portfolio. You will either have to sell a part of your shares, or purchase those types of assets whose weight has decreased, or do both to restore the original proportions of the distribution of assets ...
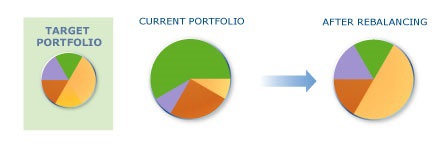
Stick to your plan: buy low, sell high - redistribute money from the category of assets that are becoming more expensive in favor of assets that are getting cheaper. This may be psychologically difficult, but wise. Cutting investment from the current "winners" and adding investment to today's "losers" is rebalancing, which helps you buy cheaper and sell higher.
At the same time, thepriests of the Golden Taurus consultants usually forget to mention that, nevertheless, in the rebalancing, one also needs to know the measure so as not to buy assets that are stumbling downwards endlessly year after year.
')
We now illustrate the magical effect of rebalancing on available asset classes. It is necessary to mention that since Markovits (since he was a theorist), it has become customary to measure risk in our business by standard deviation

Buffett and Taleb are categorically against (because of practice), but such a definition of risk is also suitable for illustration. If it cuts the eye, we will replace the word “risk” with the word “variability” and postulate that we are avoiding change….
Consider for example the American market (because there is more data and there are online calculators), but for the Russian markets the situation will be similar. Let us find out why the Federal Commission for Valuable Securities mentions a portfolio of stock-bonds. According to statistics for the period 1926-2012 the annual indicators of stocks and bonds were as follows.

Next, a graph of the situation with a portfolio with annual rebalancing. The vertical axis is the yield, the horizontal is the variability (volatility, risk) of the result. Each ball (except for the central circled in red) corresponds to a portfolio with fixed distribution:
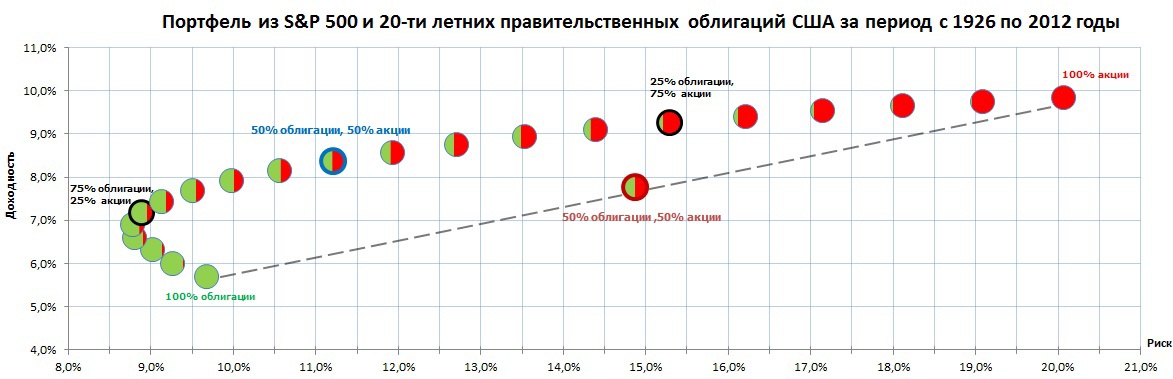
Here the lower left corner immediately catches the eye.
We start with a circle of 100% bonds. And we see that adding to the portfolio of low-risk bonds of new assets - more risky - shares - improves the portfolio performance and risk, too, the ball shifts upwards, but to the left - the risk decreases, the profitability increases. Such is the non-intuitive result.
Approximately from level 75-25, magic ends, and the risk grows with profit as the share of shares in the portfolio grows, this is natural. It turns out that there is no sense in having a portfolio of less than about 25% of the shares - it seems that less risky bonds drown the portfolio not only in terms of profitability, but also in risk.
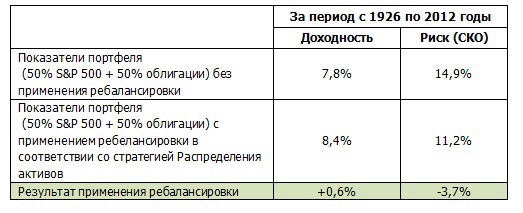
A portfolio without rebalancing, consisting of 50% of shares and 50% of bonds, will have the following indicators (in the figure - a ball on the dotted line circled in red): yield - 7.8%; risk - 14.9%.
However, the annual rebalancing leads to the fact that the real indicators of the above portfolio will be as follows (in the figure - a ball circled in blue): yield - 8.4%, risk - 11.2%.
The very form of this curvature is usually such. And for the Russian market too.
Take the 2003-2012 data for Russian deposits and the stock market,watch my hands .
Deposits showed an increase of 8.1% per annum, with SKO of 1.7%
Shares showed an increase of 16.5% per year on average with a variability of 51%.
The portfolio of 50% deposits of 50% of the stock showed a yield of 15.8% per year with a volatility of 26.4% - i.e. we almost repeated the yield of the stock, cutting down the drawdown almost doubled .
The portfolio of 25% deposits of 75% of the share showed an average annual yield of 17.3% with a variability of 39%, i.e. we surpassed shares in terms of profitability and did not increase risks.
So for long-term stability, a portfolio is much more interesting than buying a favorite asset, or even a favorite asset class.
Continued here
Update. We will reach the Russian market.
Rebalancing returns the portfolio to the original proportions of asset allocation. Rebalancing is necessary because over time, some of your investments may break out of your chosen asset allocation. You may find that some of your investments will grow noticeably faster than others. For example, that you have decided that investment in stocks will be 60% of your portfolio. However, after the recent growth of the stock market, the proportion of shares increased to 80% of the portfolio. You will either have to sell a part of your shares, or purchase those types of assets whose weight has decreased, or do both to restore the original proportions of the distribution of assets ...
Stick to your plan: buy low, sell high - redistribute money from the category of assets that are becoming more expensive in favor of assets that are getting cheaper. This may be psychologically difficult, but wise. Cutting investment from the current "winners" and adding investment to today's "losers" is rebalancing, which helps you buy cheaper and sell higher.
At the same time, the
')
We now illustrate the magical effect of rebalancing on available asset classes. It is necessary to mention that since Markovits (since he was a theorist), it has become customary to measure risk in our business by standard deviation
Buffett and Taleb are categorically against (because of practice), but such a definition of risk is also suitable for illustration. If it cuts the eye, we will replace the word “risk” with the word “variability” and postulate that we are avoiding change….
Consider for example the American market (because there is more data and there are online calculators), but for the Russian markets the situation will be similar. Let us find out why the Federal Commission for Valuable Securities mentions a portfolio of stock-bonds. According to statistics for the period 1926-2012 the annual indicators of stocks and bonds were as follows.
Next, a graph of the situation with a portfolio with annual rebalancing. The vertical axis is the yield, the horizontal is the variability (volatility, risk) of the result. Each ball (except for the central circled in red) corresponds to a portfolio with fixed distribution:
Here the lower left corner immediately catches the eye.
We start with a circle of 100% bonds. And we see that adding to the portfolio of low-risk bonds of new assets - more risky - shares - improves the portfolio performance and risk, too, the ball shifts upwards, but to the left - the risk decreases, the profitability increases. Such is the non-intuitive result.
Approximately from level 75-25, magic ends, and the risk grows with profit as the share of shares in the portfolio grows, this is natural. It turns out that there is no sense in having a portfolio of less than about 25% of the shares - it seems that less risky bonds drown the portfolio not only in terms of profitability, but also in risk.
A portfolio without rebalancing, consisting of 50% of shares and 50% of bonds, will have the following indicators (in the figure - a ball on the dotted line circled in red): yield - 7.8%; risk - 14.9%.
However, the annual rebalancing leads to the fact that the real indicators of the above portfolio will be as follows (in the figure - a ball circled in blue): yield - 8.4%, risk - 11.2%.
The very form of this curvature is usually such. And for the Russian market too.
Take the 2003-2012 data for Russian deposits and the stock market,
Deposits showed an increase of 8.1% per annum, with SKO of 1.7%
Shares showed an increase of 16.5% per year on average with a variability of 51%.
The portfolio of 50% deposits of 50% of the stock showed a yield of 15.8% per year with a volatility of 26.4% - i.e. we almost repeated the yield of the stock, cutting down the drawdown almost doubled .
The portfolio of 25% deposits of 75% of the share showed an average annual yield of 17.3% with a variability of 39%, i.e. we surpassed shares in terms of profitability and did not increase risks.
So for long-term stability, a portfolio is much more interesting than buying a favorite asset, or even a favorite asset class.
Continued here
Update. We will reach the Russian market.
Source: https://habr.com/ru/post/232195/
All Articles