Alternative Application Tracing Methods

Tracing is used in many types of software: in emulators, dynamic unpackers, fuzzers. Traditional tracers work on one of four principles: emulation of a set of instructions (Bochs), binary translation (QEMU), patching of binary files to change the control flow (Pin), or work through a debugger (PaiMei based on IDA). But now we will talk about more interesting approaches.
Why track?
Tasks that are solved using tracing can be divided into three groups, depending on what is being monitored: program execution (control flow), data flow, or interaction with the OS. Let's talk about each more ...
')
Control flow
Monitoring the flow of control helps to understand what the binary is doing during execution. This is a good way to work with obfuscated code. Also, if you work with a fuzzer, it will help with code coverage analysis. Or take, for example, antivirus software, where the tracer will track the execution of a binary file, formulate a pattern of its behavior, and also help with the dynamic decompression of the executable file.
Tracing can occur at different levels: tracking of each instruction, basic blocks or only certain functions. As a rule, it is carried out by pre / post-instrumentation, that is, by patching the control flow in the most “interesting” places. Another method is to simply attach the debugger to the program in question and handle traps and breakpoints. However, there is another not very common way - to use the functions of the CPU. One of the interesting features of Intel processors is the MSR-BTF flag, which allows you to track program execution at the base unit level — on branches (branches). Here is what is said about this flag in the documentation:
“When the software sets the BTF flag in the MSR register MSR_DEBUGCTLA and sets the TF flag in the EFLAGS register, the processor will generate a debug interrupt only after encountering a branch or an exception.”
Data stream
In this scenario, tracing is used to unpack the code, as well as to monitor the processing of valuable information - during it you can detect the incorrect use of objects, overflows and other errors. In addition, it can also be used to save and restore context in the tracing process. This is usually done as follows: the library under study is completely disassembled, after that all the read / write instructions are localized in it, and then during the execution of the code they are parsed and the destination address is determined. There is another option - with the help of the corresponding API function, protection of virtual memory is established, after which all access violations are monitored. The less commonly used method is when the page table changes in memory.
OS interaction
Monitoring the interaction with the OS allows you to filter out attempts to access the registry, monitor file changes, track the interaction of the process with various system resources, as well as calls to certain API functions. As a rule, this is implemented through intercepting API functions, by inserting “springboards”, inline hooks, modifying the import table, setting breakpoints. Another option is to use the SYSCALL system call. After all, if you recall, then each API function that makes some changes to the OS, in fact, is nothing more than a simple wrapper for a particular system call.

The SYSCALL mechanism is a quick way to switch the CPL (Current Privilege Level) from user mode to supervisor mode, so the user mode application can make changes to the OS (Figure 4).
Plunge into the core
To perform the above functions, it is necessary to go down to the core level (ring 0). However, in the supervisor mode, access to some functions provided by the operating system itself already appears:
LoadNotify , ThreadNotify , ProcessNotify . Their use helps to collect information on loading and unloading for a target process, such as: a list of modules, address ranges of a stack of a thread, a list of child processes, and so on.The second group of functions includes memory dumper using MDL (memory descriptor list), process memory monitor based on VAD (Virtual Address Descriptor), system interaction monitor that uses
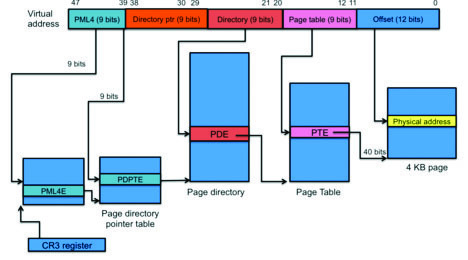
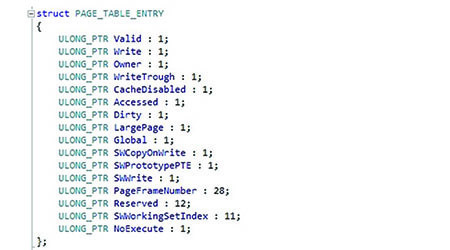
nt!KiSystemCall64 , memory access interception and traps via IDT (Interrupt Descriptor Table).The memory monitor uses a VAD tree for its work, which is an AVL tree used to store information about the process address space. It is also used when it is necessary to initialize PTE (Page Table Entry) for a specific memory page.

As I suggested above, tracking access to memory can be done through a memory protection mechanism (such is a tautology), but its implementation in user mode using API functions may affect the performance too much. However, if we take into account that memory protection is based on the MMU-paging mechanism, then there is an easier way: to change the page table in kernel mode, after which the violation of the memory access mode will be processed through the processor generation of the PageFault exception, and control will be transferred to the processor IDT [PageFault]. Installing an interceptor on the PageFault handler allows you to quickly receive a signal about a request to access selected pages.
This is because the process can use only memory pages that are marked as Valid (that is, unloaded into memory), otherwise a PageFault exception will be raised, which will be intercepted. This means that if we intentionally set the Valid flag of the selected memory page to invalid (0), then each attempt to access this page will call the PageFault handler, which makes it easy to filter and process the corresponding request (by calling the callback to the tracer and setting the Valid- flag for a specific PTE).
Digging deeper - go to VMM!
In the previous section, I proposed some “dirty” methods for kernel mode. In general, installing hooks is the wrong way, and I don’t like it, just as the guys from Microsoft don’t like it either. To combat such methods, small-scale and developed PatchGuard. Fortunately, there is another way to catch PageFaults, traps or SYSCALLs - this is a hypervisor. True, this option has both its advantages and its disadvantages.
Minuses:
- Virtualized is not a separate application, but the entire system - at the CPU core level.
- The
switch( VMMExit )operator selects a bit of performance, as does the hypervisor code that runs for each of the switch variants.
Pros:
- A higher level of rights than the level of the supervisor, as well as a whole set of callbacks provided by virtualization technology.
At the same time, VMM (Virtual Machine Monitor) itself can be minimalistic (microVMM) and implement only the necessary processing, while occupying the minimum amount of code ( example ).

In addition, in this case, instead of putting the hooks on the IDT, you can process everything directly using debag-exceptions in VMM. The same applies to the interception of page faults using the PageFault exception in VMM or through the EPT (Extended Page Table) implementation.

Pitfalls VMM
Some basic features of the described approach can be noted:
- target file remains almost unchanged
- for tracking (both step-by-step and branch level) the TRAP flag is implemented;
- address breakpoints through 0xCC or using DRx;
- memory monitoring by changing the process page table;
- no need to patch binary file;
- can be used as a trace module from another application;
- You can track multiple applications at the same time;
- You can track multiple threads of the same application;
- implemented quick calls to switch CPL.
Selecting a tracer from the target process space to another process offers several advantages: you can use it as a separate module, you can make binders for Python, Ruby and other languages. However, this solution also has a drawback - a very big impact on performance (interaction between processes: reading from the memory of another process, event-based wait mechanism). To speed up tracing, you need to transfer the logic to the address space of the target process so that you can quickly access its resources (memory, stack, contents of registers), as well as optionally abandon VMM due to the negative impact of VMMExit processing on performance and return to the installation hooks for traps and PageFault handlers. But on the other hand, in future processors, virtualization technologies will probably become more efficient and will not have such a big impact on performance. In addition, the virtualization capabilities for tracing can be used much more widely than we consider in the framework of the article, so the advantages can compensate for the performance decrease.
Core Tracer
As for the kernel tracer, the same principles apply here:
- trap tracking (TRAP);
- memory monitoring by changing the page table;
- callback'and tracer transferred to the user-level applications;
- No need to patch binary files of the target application.
The main feature of such tracers is that you do not need to patch a binary file, and also trace (including unpacking and fuzzing) can be done from the user level (for example, from a tracer written in Python), although from a performance point of view it is much more efficient to do directly from kernel mode.
On the other hand, all these opportunities also have to be paid for:
- driver address space does not belong to him;
- fuzzing in memory is not a simple matter;
- incorrect RIP, registers, memory ... manipulation of them can end very badly;
- you must be clear about what you are tracking or checking;
- it is necessary to remember numerous IRQLs during the whole tracing process;
- Exception Handling.
Separation from the target process, as well as encapsulation in the module, give us high scalability and the ability to work with other modules to create a more complex tool. Thus, in the case of a tracer implementation, for example, in Python, you can use IDA Python, LLVM bindings, Dbghelp for debugging symbols, disassemblers (capstone and bea engines) and much more. To show how easily and quickly you can implement a trace on Python, I will give a couple of examples.
In the first example, more than three variants of access (RWE) to the specified memory area are controlled:
target = tracer.GetModule("codecoverme") dis = CDisasm(tracer) for i in range(0, 3): print("next access") tracer.SetMemoryBreakpoint(0x2340000, 0x400) tracer.Go(tracer.GetIp()) inst = dis.Disasm(tracer.GetIp()) print(hex(inst.VirtualAddr), " : ", inst.CompleteInstr) tracer.SingleStep(tracer.GetIp()) And the following code segment demonstrates application tracing at the branch level, while skipping processing outside the main module:
for i in range(0, 0xffffffff): if (target.Begin > tracer.GetIp() or target.Begin + target.Size < tracer.GetIp()): ret = tracer.ReadPrt(tracer.GetRsp()) tracer.SetAddressBreadkpoint(ret) tracer.Go(tracer.GetIp()) print("out-of-module-hook") isnt = dis.Disasm(tracer.GetPrevIp()) print(hex(inst.VirtualAddr), " : ", inst.CompleteInstr) tracer.BranchStep(tracer.GetIp()) As you can see, the code is very concise and clear.
DbiFuzz framework
I have embodied all the approaches to tracing discussed above in the DbiFuzz framework , which demonstrates how you can track the performance of an executable file using alternative methods. As we have already noted, some of the known methods use instrumentation, which gives a quick solution, but at the same time involves serious interference with the target process and does not preserve the integrity of the binary file. In contrast, DbiFuzz leaves the binary file virtually intact, changing only PTE, BTF and inserting the TRAP flag. The other side of this approach is that an interrupt is enabled for the event of interest: the transition ring 3 —ring 0 - ring 3. Since DbiFuzz implies a straightforward intervention in the context and control flow of the target processor, it can be used to write your own tools (even on Python) to access the target binary file and its resources.
Www
You can learn more about the DbiFuzz framework on my website , on SlideShare and on the ZeroNights portal
A very interesting article by Brendan Dolan-Gavitt “The VAD tree: A process-eye view of physical memory5” is devoted to the VAD tree.
Show time
For many problems solved by tracing, dynamic binary instrumentation can be useful. As for the DbiFuzz framework, it can be used in the following cases:
- when you need to track the code on the fly;
- when unpacking a binary file, tracing the malware packager;
- to monitor the processing of sensitive data;
- for fuzzing in memory (easy to track and change the stream);
- when used in different tools, not necessarily written in C.
There are no problems running DbiFuzz on the fly, just set a trap or INT3 interceptor. Since we do not touch the binary code of the target file, there will be no problems with integrity checking, and the TRAP flag can be replaced with MTF. Tracking valuable data is also not a problem, you just need to install the appropriate PTE - and your monitor is ready! Python / Ruby / ... tools? Just create the necessary bindings and go ahead!
Of course, this framework also has its drawbacks, but in general it has many useful features. And you can always play with DbiFuzz, use the tools included in it for your needs and keep track of everything you want.
To be continued
As you can see, dynamic binary instrumentation is not the only tracing method. There are many alternatives to it, and most of them are represented in the DbiFuzz framework. Already, some features of this project can help with working in code at the kernel level, and in the future I plan to transfer the whole tracer into this space. By the way, now you can use the source code of the framework, improve the concept and experiment with new ideas ...
useful links
Blogs:
Intel:
Regarding VAD:
Virtualization:
- Intel Virtualization Technology
- HDBG - hypervisor-based debugger
- Hyperdbg
- Report by Joanna Rutkovskaya on BH US 06
Python modules (disassemblers):

First published in the magazine "Hacker" from 02/2014.
Subscribe to "Hacker"


Source: https://habr.com/ru/post/231813/
All Articles