Creating a project management system for Yandex Tolstoy Camp. Part 2
According to statistics, about 50% of IT-projects go beyond the budget, the time or not fully meet the expectations of customers. Among other reasons, there are flaws in the management process, a blurring of project boundaries (in particular, due to a lack of control over these boundaries) and the lack of consideration of project risks. These problems we raised in our previous article .
If you want to know how we in e-Legion deal with these problems and make projects successful, welcome under cat.
')
Note: to experienced managers, this section may seem like captaincy. If you have this feeling, just skip to the next section =)
Let's start with an understanding of what constitutes the price of a project that the studio puts to the customer. The following is true for all custom development companies.
It is clear that the price has a restriction from above - the price of competitors, how much the customer is ready to spend. How can you influence the price?
From the above, it is clear that reducing uncertainty appears to be the easiest factor to change. Let's do it.
How to reduce uncertainty? Clarify customer requirements, understand what components the system will consist of and what functions it will perform. The more we think about the project in advance, the less likely it is that during the project there will be new tasks that will have to be performed at our own expense.
During the evaluation, we should not forget that the evaluation itself is also not free. On average, the assessment of a project received from a customer takes from 2 hours to 1 week and requires the involvement of developers, analysts and testers. Thus, the assessment of one project for a company costs from about 10 to 100 man-hours! Taking into account the fact that not every estimated project is sold, the company's costs reach rather big values.
We decided to try to use the Mind map (diagram of relationships) for drawing up the structure of the project and their evaluation:
The central element of the Mind map is the name of the project. Its child elements are components of the future system (for a mobile application, screens; you can use custom scripts or other components that the customer understands). Next, for each screen, its main functions are recorded. Common components (for example, dialog boxes) are sooner or later moved to a separate first-level parent element. Without spending more time and not using any secret skills, the appraisal team gets a much more detailed map of the future application. The level of detail is such that the most recent elements of the Mind map rarely have a rating of more than 4-8 hours.
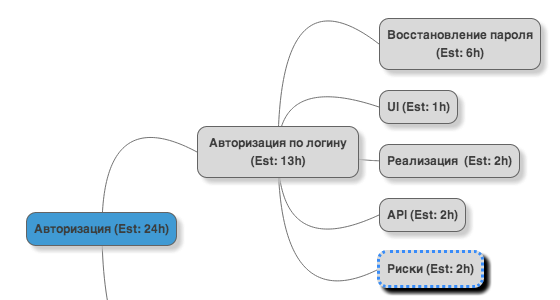
If an exact assessment on any element cannot be given, we can add some element that reflects the risk:
The customer is given a detail of the assessment at the level of the very first children. These elements reflect some business components (use case, application screen) and therefore are understandable to customers.
What is most interesting, during the project it turned out that this map is also much more accurate - the number of unexpected tasks has greatly decreased (the exact figures are at the end of the article).
Suppose the project is sold and it's time to implement it. At this point, many make a mistake and lose the connection between the elements of the application that were identified during the assessment and sold to the customer, and the tasks that are added to the task tracker. And many don't make such mistakes =) and, all the same, they spend a lot of time on checking that the amount of work in the task tracker corresponds to the estimate sold at the end of the project. Many task trackers either do not allow organizing multi-level hierarchies at all, or allow you to do this non-intuitively. What problems did this have?
And here came the Mind map. The same Mind map, which turned out during the assessment, is also used in the development - the tasks of the lowest level get into the tracker and are given for execution. Knowing the structure, PM (and other project participants) can easily determine which tasks are under the node corresponding to one or another screen. The node itself contains information about the initial assessment, so PM immediately notices its excess (when a new task appears) and can take action.
The status is noted on “low-level” tasks - those that the developers in the tracker work with - and is “translated” to higher levels of the diagram. This allows project managers and CTOs to easily see the status of the entire project:
gray - the task has not yet begun, green - the task is ready, yellow - the task is in work, red - there are some problems.
If necessary, you can quickly understand what caused this or that problem:
You can apply a filter for tasks that require the attention of the manager:

An additional bonus, which we certainly did not expect - a significant reduction in the cost of testing. It is explained by the fact that the developers saw the status of a screen and tried to finish the tasks associated with it before starting work on a new screen (we pass the application for testing on-screen, or according to the client’s business features). And if earlier it happened that the developers sent screens for testing, on which there were unfinished tasks, then now completely tested screens began to come to testing.
The promised results.
In projects that used the new approach, the following improvements were noted:
How can this affect the profitability of the project? Let's assume that the price of a project is 100 conventional units. In accordance with the price structure explained above, the margin and risk in such a project is approximately 30; development costs - 60; for testing - 10. Suppose that the shot risks “ate” 20 units, i.e. the real margin was only 10. If risks were reduced by 50% ($ 10), and testing costs by 20% ($ 2), the margin could increase from 10 to 22 — that is, more than 100%!
After testing a new approach on several projects, we decided to bring light to the masses to share our experience and automate our tools and processes. To this end, several volunteers went to Tolstoy Startup Camp and are currently developing a SNAP project management system that implements the described processes.
Automation is still seen in the following places:
The SNAP team will be happy to answer questions about the method used, and can help you learn how to use Mind maps to evaluate and manage your projects.
How do you rate your projects?
If you want to know how we in e-Legion deal with these problems and make projects successful, welcome under cat.
')
Project price
Note: to experienced managers, this section may seem like captaincy. If you have this feeling, just skip to the next section =)
Let's start with an understanding of what constitutes the price of a project that the studio puts to the customer. The following is true for all custom development companies.
- Cost of work - an estimate of the work required in the project in hours, multiplied by the cost of an hour. Usually the cost of analytics and design, development and testing is considered separately. On average, the project is 60-70%.
- Margin - in fact, the earnings of our company. On average, margins on the market are planned at the level of 20-40% (without taking risks into account), but it often turns out to be less as a result of underestimation of risks.
- Often part of the margin is reserved for risks. If we know that on average in projects we are mistaken with estimates by 10%, it is logical to take this error into account in advance and raise the price for the client a little so as not to lose our profit. On average, project risks are set at the level of 10-20% (in addition to the 20-40% margin).
It is clear that the price has a restriction from above - the price of competitors, how much the customer is ready to spend. How can you influence the price?
- The cost of work directly depends on their scope (what the customer asked to do is an objectively undiminished parameter) and the price per hour (which depends on many factors, the description of which is beyond the scope of this article and which, in fact, cannot be changed within one project, but only throughout the organization).
- Margin - in principle, for a prospective customer, the first project can be with zero or even negative margin (that is, unprofitable for the company). But in general, any company wants to earn money and does not want to share the margin.
- Risks can be divided into two parts: fixed (depending on the organization, client, project, developers who will work on the project, possible diseases of employees, etc.) and “risks of ignorance” (which reflect what is usually there is great uncertainty - there are no exact requirements, the details of implementation are not clear, etc.).
From the above, it is clear that reducing uncertainty appears to be the easiest factor to change. Let's do it.
Project Evaluation
How to reduce uncertainty? Clarify customer requirements, understand what components the system will consist of and what functions it will perform. The more we think about the project in advance, the less likely it is that during the project there will be new tasks that will have to be performed at our own expense.
During the evaluation, we should not forget that the evaluation itself is also not free. On average, the assessment of a project received from a customer takes from 2 hours to 1 week and requires the involvement of developers, analysts and testers. Thus, the assessment of one project for a company costs from about 10 to 100 man-hours! Taking into account the fact that not every estimated project is sold, the company's costs reach rather big values.
Our solution
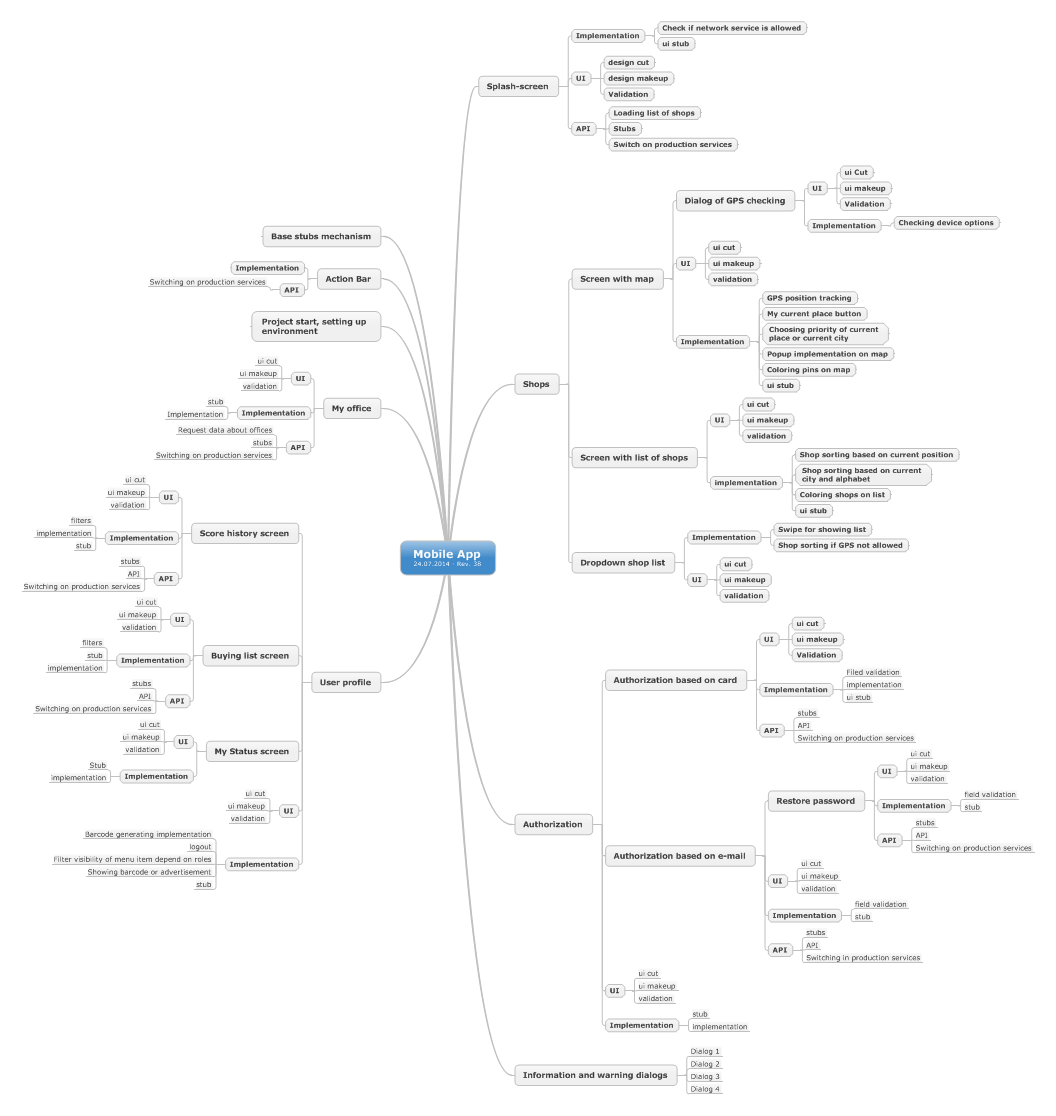
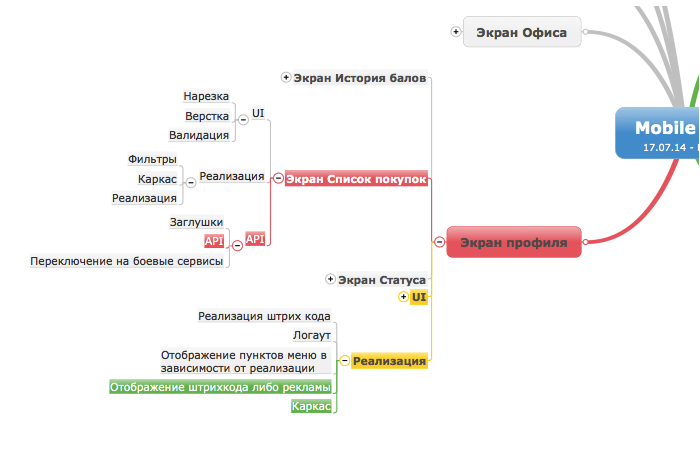
We decided to try to use the Mind map (diagram of relationships) for drawing up the structure of the project and their evaluation:
The central element of the Mind map is the name of the project. Its child elements are components of the future system (for a mobile application, screens; you can use custom scripts or other components that the customer understands). Next, for each screen, its main functions are recorded. Common components (for example, dialog boxes) are sooner or later moved to a separate first-level parent element. Without spending more time and not using any secret skills, the appraisal team gets a much more detailed map of the future application. The level of detail is such that the most recent elements of the Mind map rarely have a rating of more than 4-8 hours.
If an exact assessment on any element cannot be given, we can add some element that reflects the risk:
The customer is given a detail of the assessment at the level of the very first children. These elements reflect some business components (use case, application screen) and therefore are understandable to customers.
What is most interesting, during the project it turned out that this map is also much more accurate - the number of unexpected tasks has greatly decreased (the exact figures are at the end of the article).
Project progress
Suppose the project is sold and it's time to implement it. At this point, many make a mistake and lose the connection between the elements of the application that were identified during the assessment and sold to the customer, and the tasks that are added to the task tracker. And many don't make such mistakes =) and, all the same, they spend a lot of time on checking that the amount of work in the task tracker corresponds to the estimate sold at the end of the project. Many task trackers either do not allow organizing multi-level hierarchies at all, or allow you to do this non-intuitively. What problems did this have?
- Due to the loss of communication, it is very difficult to understand that any additional task that emerged during the project leads to an excess of the “sold” assessment and we begin to implement it at our own expense.
- Due to the lack of a good representation of the hierarchy of tasks in the tracker, it is difficult to understand the readiness status of a particular function (in our case, the mobile application screen). When the need arises, PM must manually review the entire task list in the tracker and see if there are any unfinished tasks related to the screen of interest.
Decision
And here came the Mind map. The same Mind map, which turned out during the assessment, is also used in the development - the tasks of the lowest level get into the tracker and are given for execution. Knowing the structure, PM (and other project participants) can easily determine which tasks are under the node corresponding to one or another screen. The node itself contains information about the initial assessment, so PM immediately notices its excess (when a new task appears) and can take action.
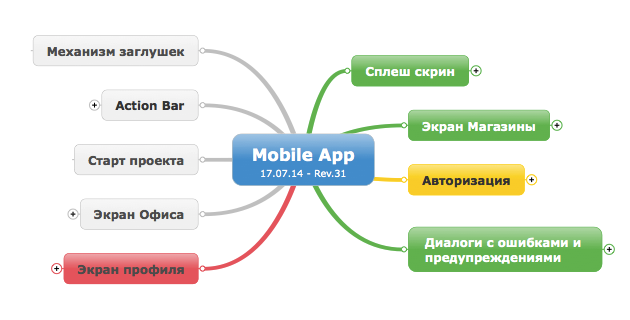
The status is noted on “low-level” tasks - those that the developers in the tracker work with - and is “translated” to higher levels of the diagram. This allows project managers and CTOs to easily see the status of the entire project:
gray - the task has not yet begun, green - the task is ready, yellow - the task is in work, red - there are some problems.
If necessary, you can quickly understand what caused this or that problem:
You can apply a filter for tasks that require the attention of the manager:
An additional bonus, which we certainly did not expect - a significant reduction in the cost of testing. It is explained by the fact that the developers saw the status of a screen and tried to finish the tasks associated with it before starting work on a new screen (we pass the application for testing on-screen, or according to the client’s business features). And if earlier it happened that the developers sent screens for testing, on which there were unfinished tasks, then now completely tested screens began to come to testing.
Complex economy of prime numbers
The promised results.
In projects that used the new approach, the following improvements were noted:
- 20% reduction in testing costs.
- 50% reduction in the excess of the initial estimates (due to a more accurate assessment and control of the excess of estimates).
- Project managers began to spend 5-10% (subjective assessment) less time to control the team and due to this they were able to communicate more with the customer.
How can this affect the profitability of the project? Let's assume that the price of a project is 100 conventional units. In accordance with the price structure explained above, the margin and risk in such a project is approximately 30; development costs - 60; for testing - 10. Suppose that the shot risks “ate” 20 units, i.e. the real margin was only 10. If risks were reduced by 50% ($ 10), and testing costs by 20% ($ 2), the margin could increase from 10 to 22 — that is, more than 100%!
What's next?
After testing a new approach on several projects, we decided to bring light to the masses to share our experience and automate our tools and processes. To this end, several volunteers went to Tolstoy Startup Camp and are currently developing a SNAP project management system that implements the described processes.
Automation is still seen in the following places:
- Mind map integration with the task tracker - now a lot of time is spent on keeping the Mind map up to date
- Automation of control of initial assessments - now managers control it manually, in the future, when approaching the initial assessment, yellow and red lights will light up =)
- Project Templates
- Possibly - a knowledge base about project risks for keeping statistics and more accurate risk accounting
- And for the management of the company - a high-level “map” of the entire portfolio of projects with its budget and buns, such as resource planning between projects.
The SNAP team will be happy to answer questions about the method used, and can help you learn how to use Mind maps to evaluate and manage your projects.
How do you rate your projects?
Source: https://habr.com/ru/post/231305/
All Articles