What is my hard drive

Today I want to pay tribute to the long- standing program SequoiaView , an application created at the beginning of the 2000th by the Technical University of Eindhoven (The Netherlands). The application turned out so practical, concise and convenient that for more than 10 years it has been helping everyone who suddenly ran out of disk space, and now just need to clear a couple of tens of gigabytes to put a new game, download a movie or just score this place in once again small garbage.
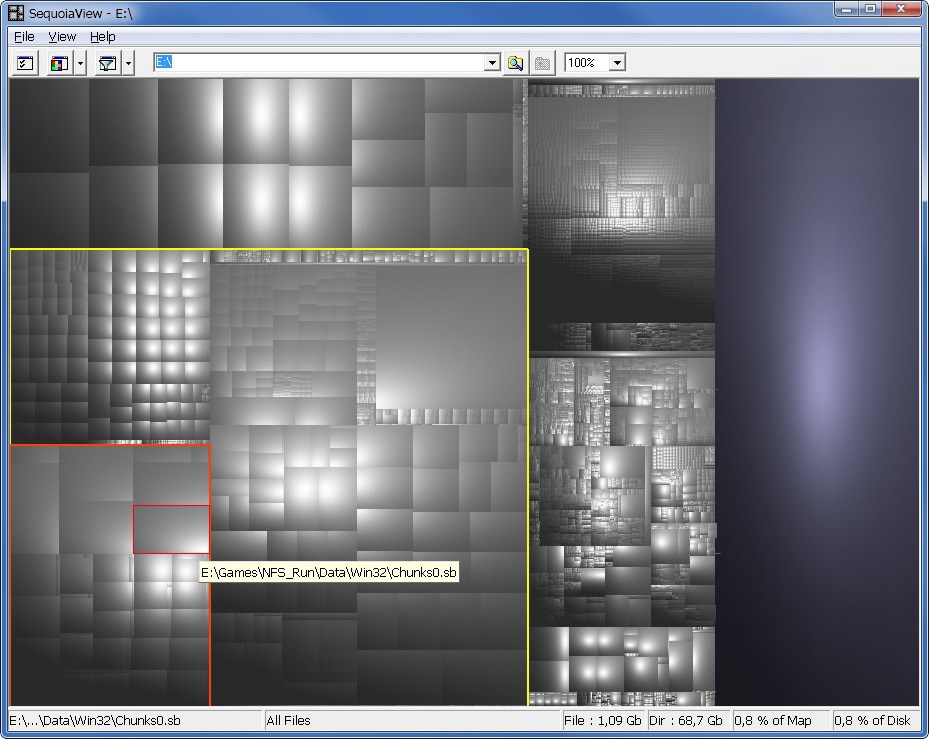
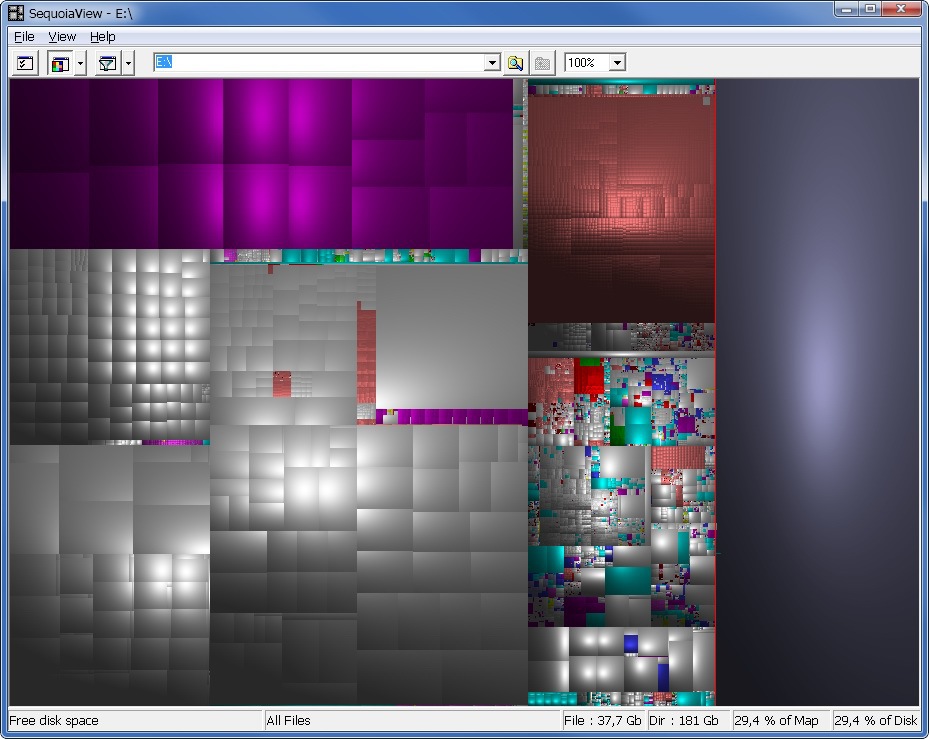
This miniature (1.3 MB) application has one main function. It draws a cushion treemap of the selected hard disk partition. Looks like a map like this:
What is a tree map?
A tree map is a way of representing a hierarchical structure in which the source area is divided into rectangles, whose area is proportional to the value of a certain property of this structure (in our example, the folder size in bytes) relative to the value of this property in the entire structure.
Thus, the area of each rectangular area on a tree map is proportional to the volume of the element (folder or file) on the disk corresponding to this area. A map can be constructed by recursively dividing an arbitrary rectangle in accordance with each level of the hierarchical structure.
For clarity, I will give an example of constructing a tree map for a directory tree:
Step-by-step example of building a tree map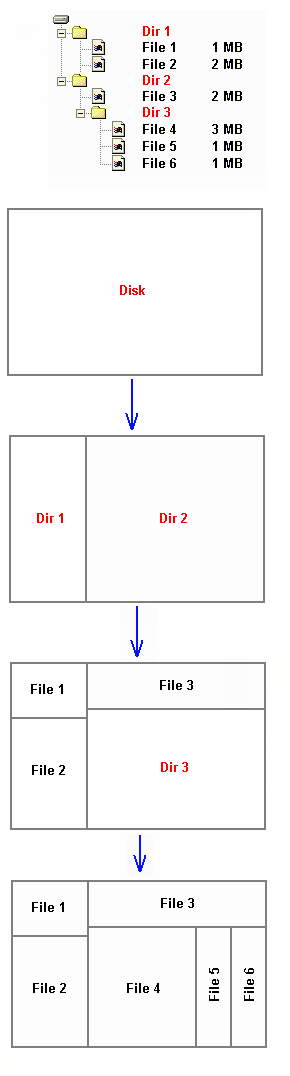
As you can see from the example, the resulting picture was not the most obvious from the point of view of analysis, it could look better.
')
Professor Eindhoven University of Technology Jack van Wijk , an expert in data visualization, in 1999 offered an interesting solution: apply a “pseudo-volume” coloring to rectangles that provides a simple visual perception of the sizes of areas in a hierarchical tree map, so-called shading (or tiling). They called this method of coloring a "cushion" tree map (cushion treemap). Their work is available for public download.
Accounting decided that the closest person to the way of perception of volume is the gradation of shades on the illuminated surface. Thus, the task is reduced to the construction of a volume surface, which reflects the structure of the tree map. As a solution, they used a subdivision of intervals.
At each level of the hierarchy, each interval “added” the height of the resulting surface:

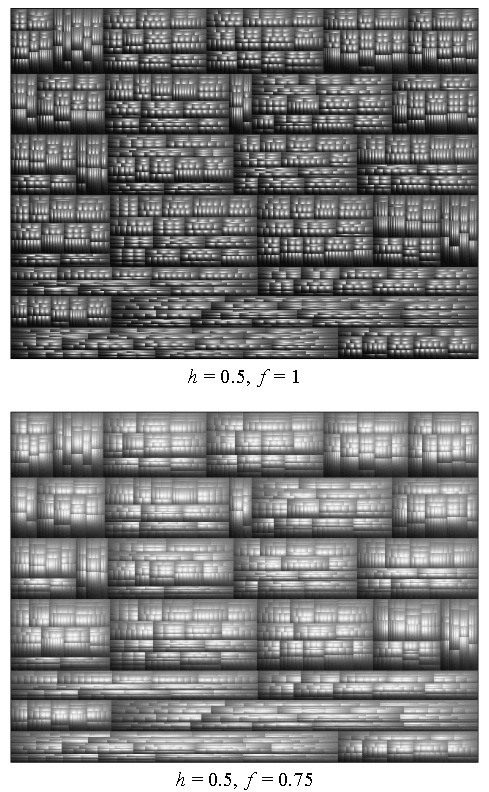
The resulting height curve (the curve shown in gray in the example) was used to plot the entire map in the light, as if the observer was looking at it from above. With this approach, on the one hand, there are separate segments clearly separated by shadows, and on the other hand, the overall hierarchy of the map can be traced and individual levels of hierarchy can be distinguished. This approach can be generalized for the two-dimensional case. To calculate the degree of illumination added by each level of the hierarchy, the scientist suggested using parabolic curves, choosing the degree of curvature of which you can get both more and less contrasting image:
As practice has shown, this method of visualization is much better than the classic (monochrome) tree-like maps, as well as better than the three-dimensional isometric representation.
The described approach was successfully implemented by scientists in the program SequioaView. In addition to the described approach, it added options that allow you to control the view of the tree map and display the selection:
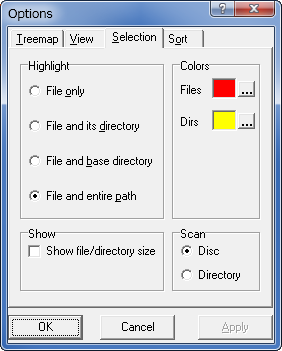
A convenient option here is to highlight the full path in the tree map to the directory under the mouse pointer (Highlight file and entire path). By default, this mode is not enabled.
On the View tab, you can enable the display of free space at the top level of the card (Show free diskspace on toplevel). By default it is turned off and the map shows only the space occupied by the files.
An interesting feature is the ability to set the color for different file extensions, which allows you to more clearly understand where the photo archive is and where the music folders are:
Great weekend to everyone! I hope you will experiment with this wonderful program and find something new on your disk ;-) You can write about the most interesting findings in the comments :-)
Source: https://habr.com/ru/post/230383/
All Articles