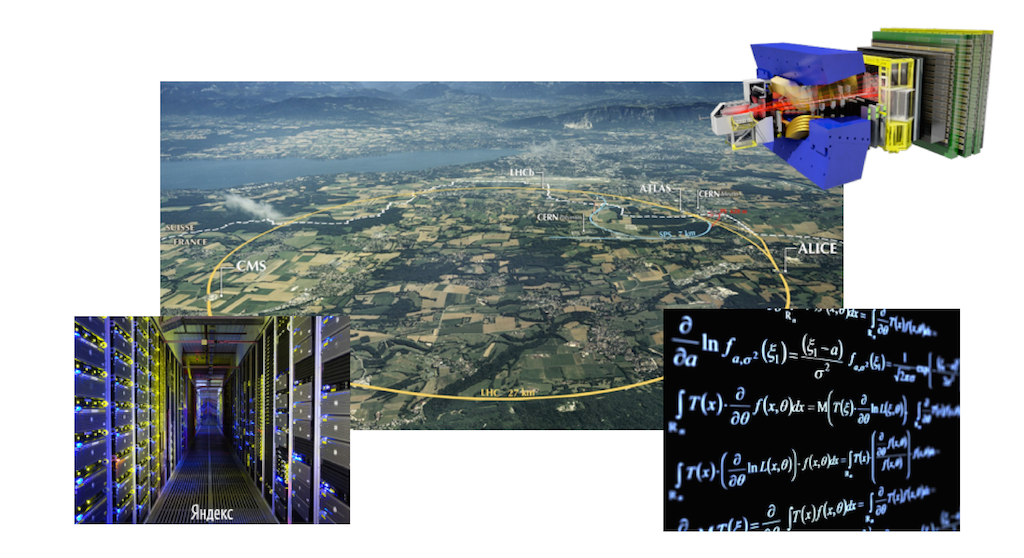
Machine learning is a microscope of a modern scientist. Why CERN Yandex Technologies
In early July, our office hosted a seminar on the interaction of Yandex and CERN. On Monday, we published the first part of it - a report by Andrey Golutvin on the new SHiP (Search for Hidden Particles) experiment. The second part of this seminar was devoted to Andrei Ustyuzhanin about joint projects of Yandex and CERN.
Andrey spoke about the use of Yandex technologies in high-energy physics. These days, experiments often work with a great number of people from different countries. A combined ecosystem for automating experiments can make the work of researchers more coordinated and help solve many other problems. A single interface, online access to the results of other participants, a versioning system and the ability to share libraries - all this can greatly simplify the lives of researchers.
')
In addition, machine learning is actively used in modern high-energy physics. On the basis of test samples, classifiers are trained, which further determine the presence of certain events already in real data. At the same time, the number of formulas that may need to be trained for one analysis reaches several hundreds or even thousands. It is necessary, however, to keep in mind that our developments are applicable not only in this area, but also in other branches of science. This report is more about research in general, about the process of experimental confirmation of various theories, hypotheses and models. Such tasks are usually faced by people from research organizations, but now they are increasingly emerging in commercial companies.
At first, people searched for answers to questions in speculative constructions, and then tested their hypotheses using various tools and practical technologies: stopwatches, scales, rulers. In the experimenter’s instrumentation, such instruments had significant weight until recently.

The picture above shows a photograph from a bubble chamber that detects the movement of charged particles through a medium saturated with hydrogen vapor. It is seen that the charged particles leave trajectories behind them - bubbles. One of the particles knocked out an electron from a hydrogen atom — it makes noticeable spiral motions in an electric field. Crosses mark which paths to consider and which not. Mark made a man.
Now everything is more complicated. To test the hypothesis, conduct experiments worth hundreds of millions and even billions of Swiss francs. The cost of the experiment is not only hardware (dig a tunnel, install accelerators, install detectors that will accurately record flying particles that are charged or unloaded). It is also algorithms that allow you to analyze the accumulated data and make reliable conclusions, as well as technologies for storing data and their effective processing. Thus, the task is complicated by many orders of magnitude compared to what was until recently.
We sketch out what happens in the hadron collider from the registration of a collision of charged particles to the publication of an article. When analyzing and processing events, the following steps occur.
Here it is still important to note that physicists are more interested in not specific events inside the detector and how they proceed (for example, what happens during transformation and interaction of particles), but statistical characteristics of the origin of a certain type of event. If a physicist tries to estimate a population of a certain country, he is interested in the number of women, men, people of a certain age group, that is, the total characteristics. They can confirm or refute certain hypotheses.
For example, the standard model predicts that the decay of the b-meson into a muon-anti-muon pair occurs 3 * 10 -9 times. If you analyze the available volume of events and prove that this is so, then the standard model is valid. If it turns out, for example, that events occur an order of magnitude more often, then the standard model does not take into account something. This is the reason to apply for a new physics. At CERN, people are trying to find at least some deviations from the standard model.
Let's go back to the steps. First, the detector generates a data stream. With a frequency of 40 million times per second, proton beams collide. As a result of collisions particles are born, which, in turn, break up into something else.
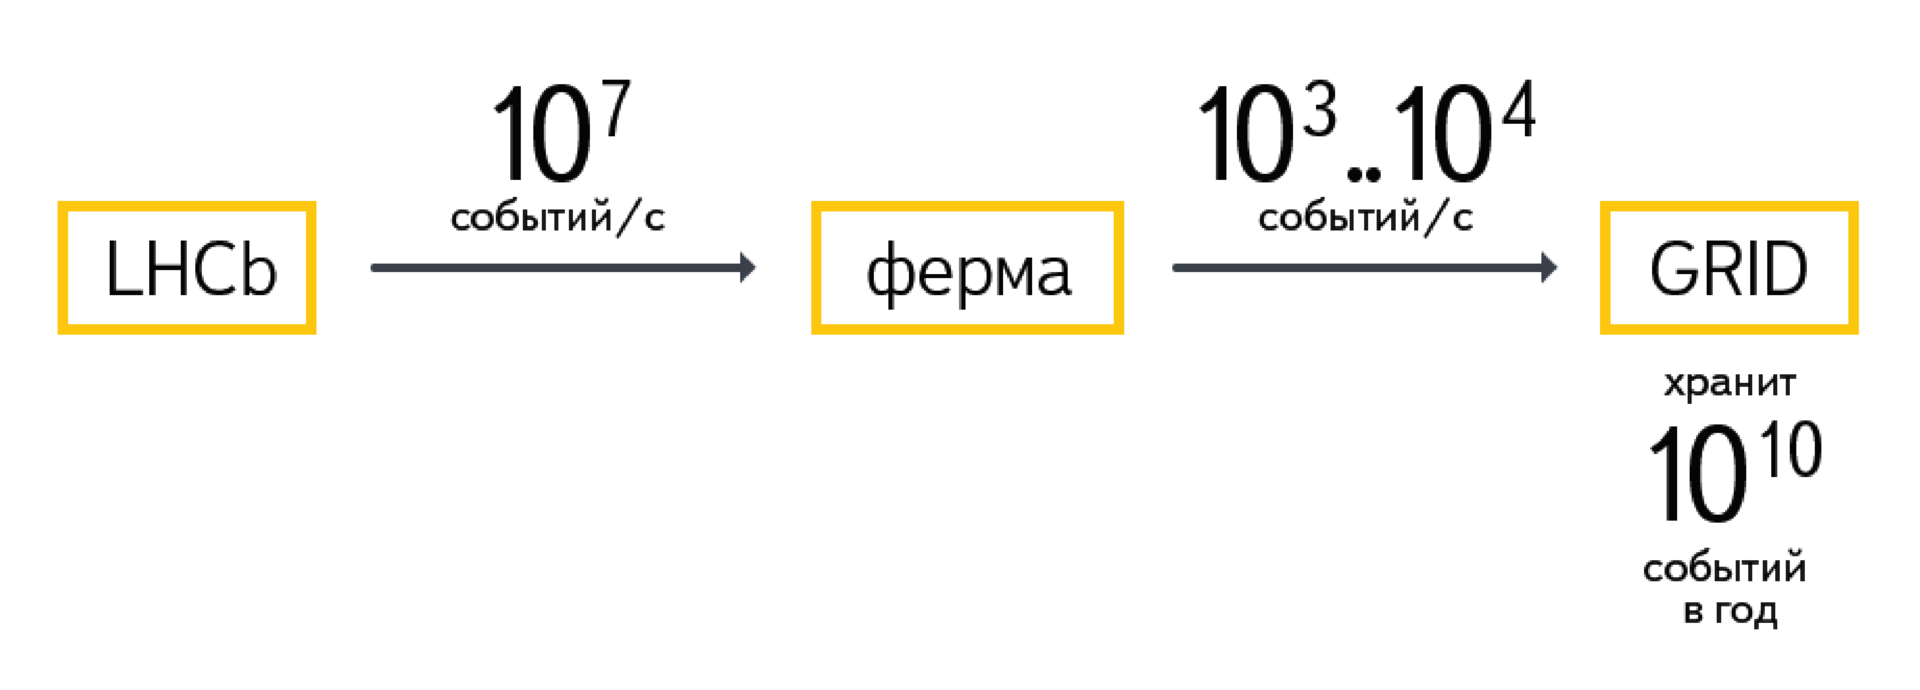
This data enters the processing farm, which operates in real time. She needs to have time to process the flow of incoming data, while the portion from the next collision does not take up computing power. The task of the farm is to select a small part from the entire flow of events (10 7 events per second): 10 -4 , 10 -3 or even less. These are the most interesting events in which something happens.
The results are in the storage system - GRID. So, the LHCb experiment gives 10 10 events per year. Each of the events weighs about 100 kilobytes. It happens differently, of course, depending on whether the raw data is considered as events or only processed.
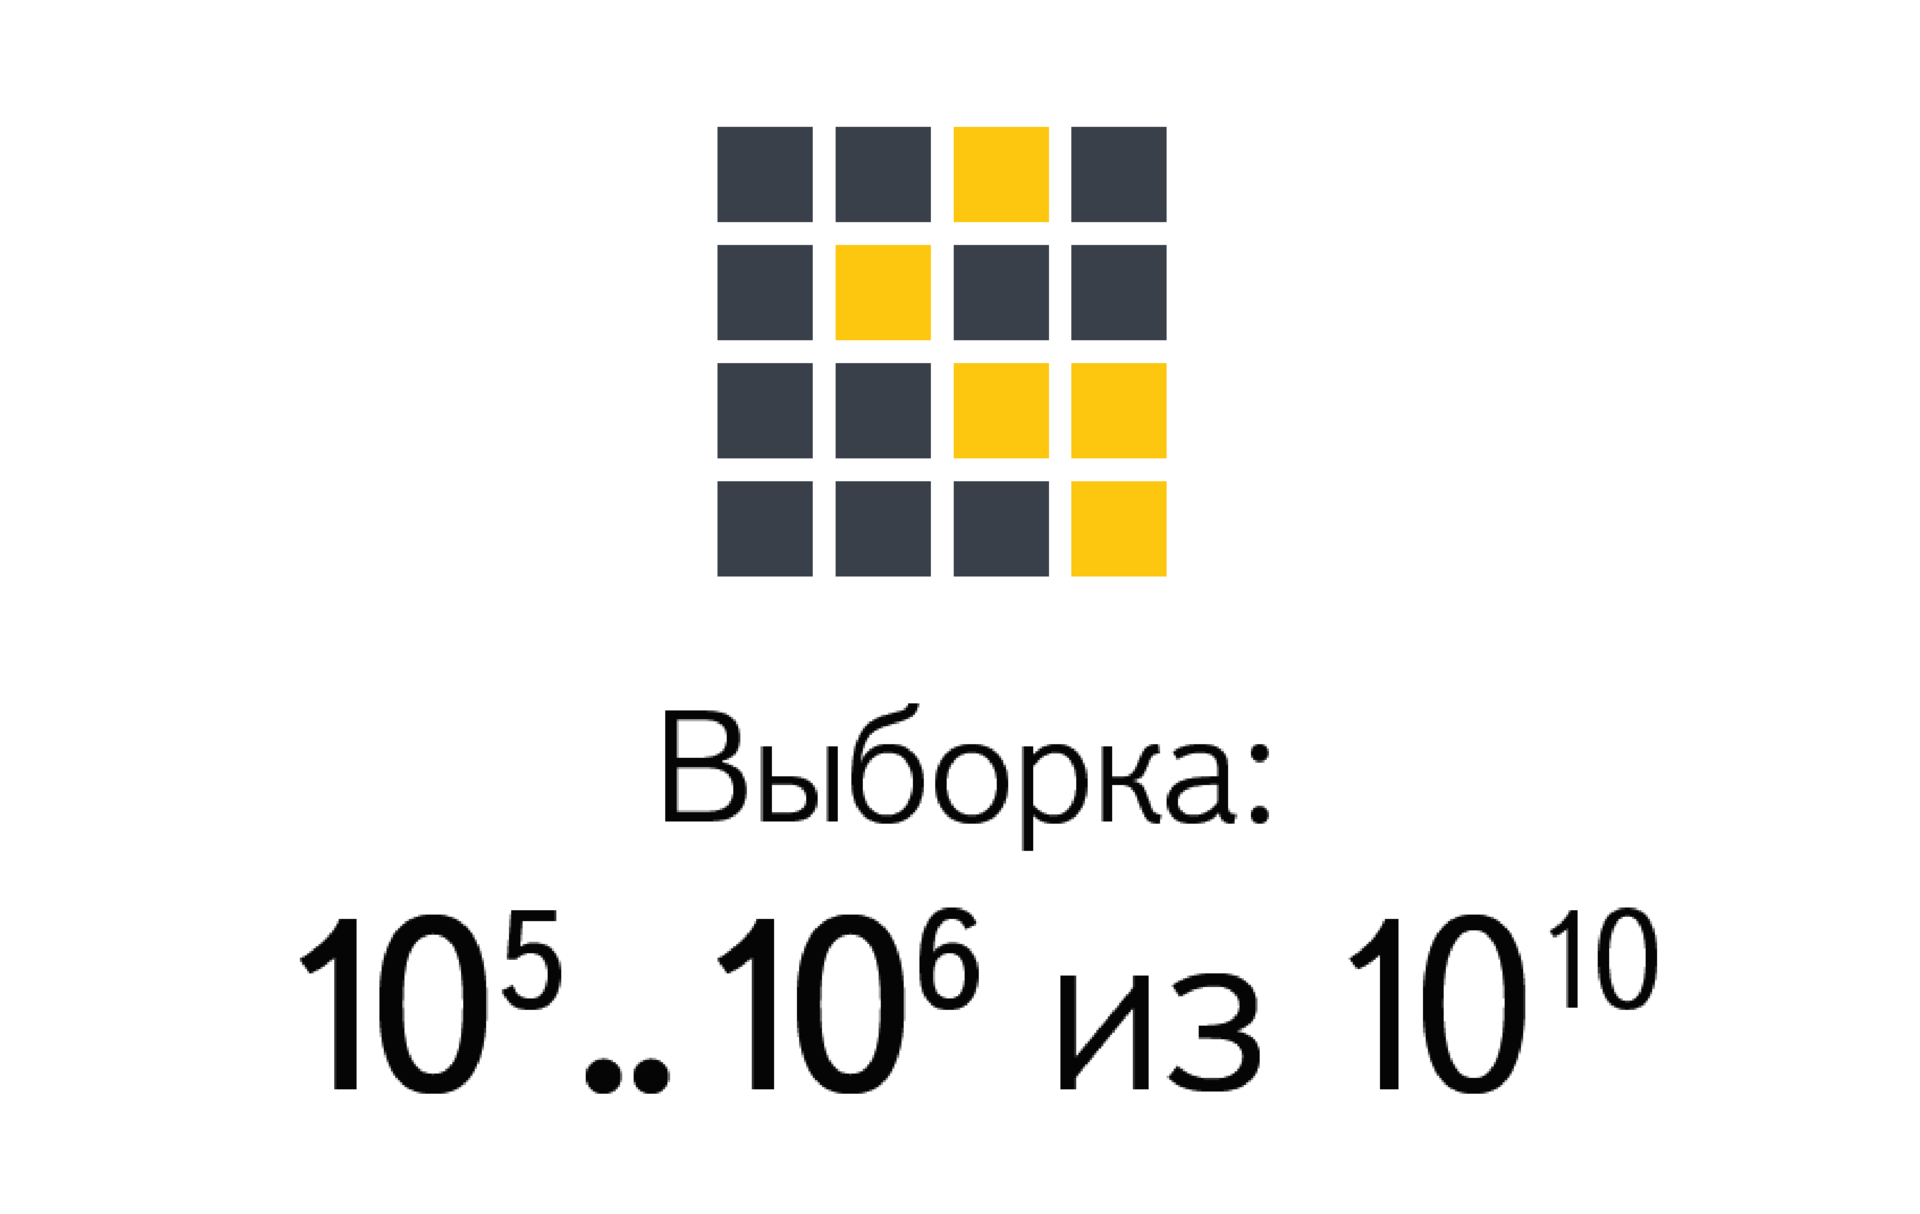
Suppose a group of physicists decides to test a model or a hypothesis. First, they prefetch the data. From the entire array (10 10 events), according to certain parameters, some part is selected, for example, 10 5 or 10 6 events. This is a sample.
The question is how to estimate the number of signaling events in our sample? Well, and then you can answer the question, how many signal events were there in volume? As a result, our task is to estimate the probability of the origin of this signaling event.
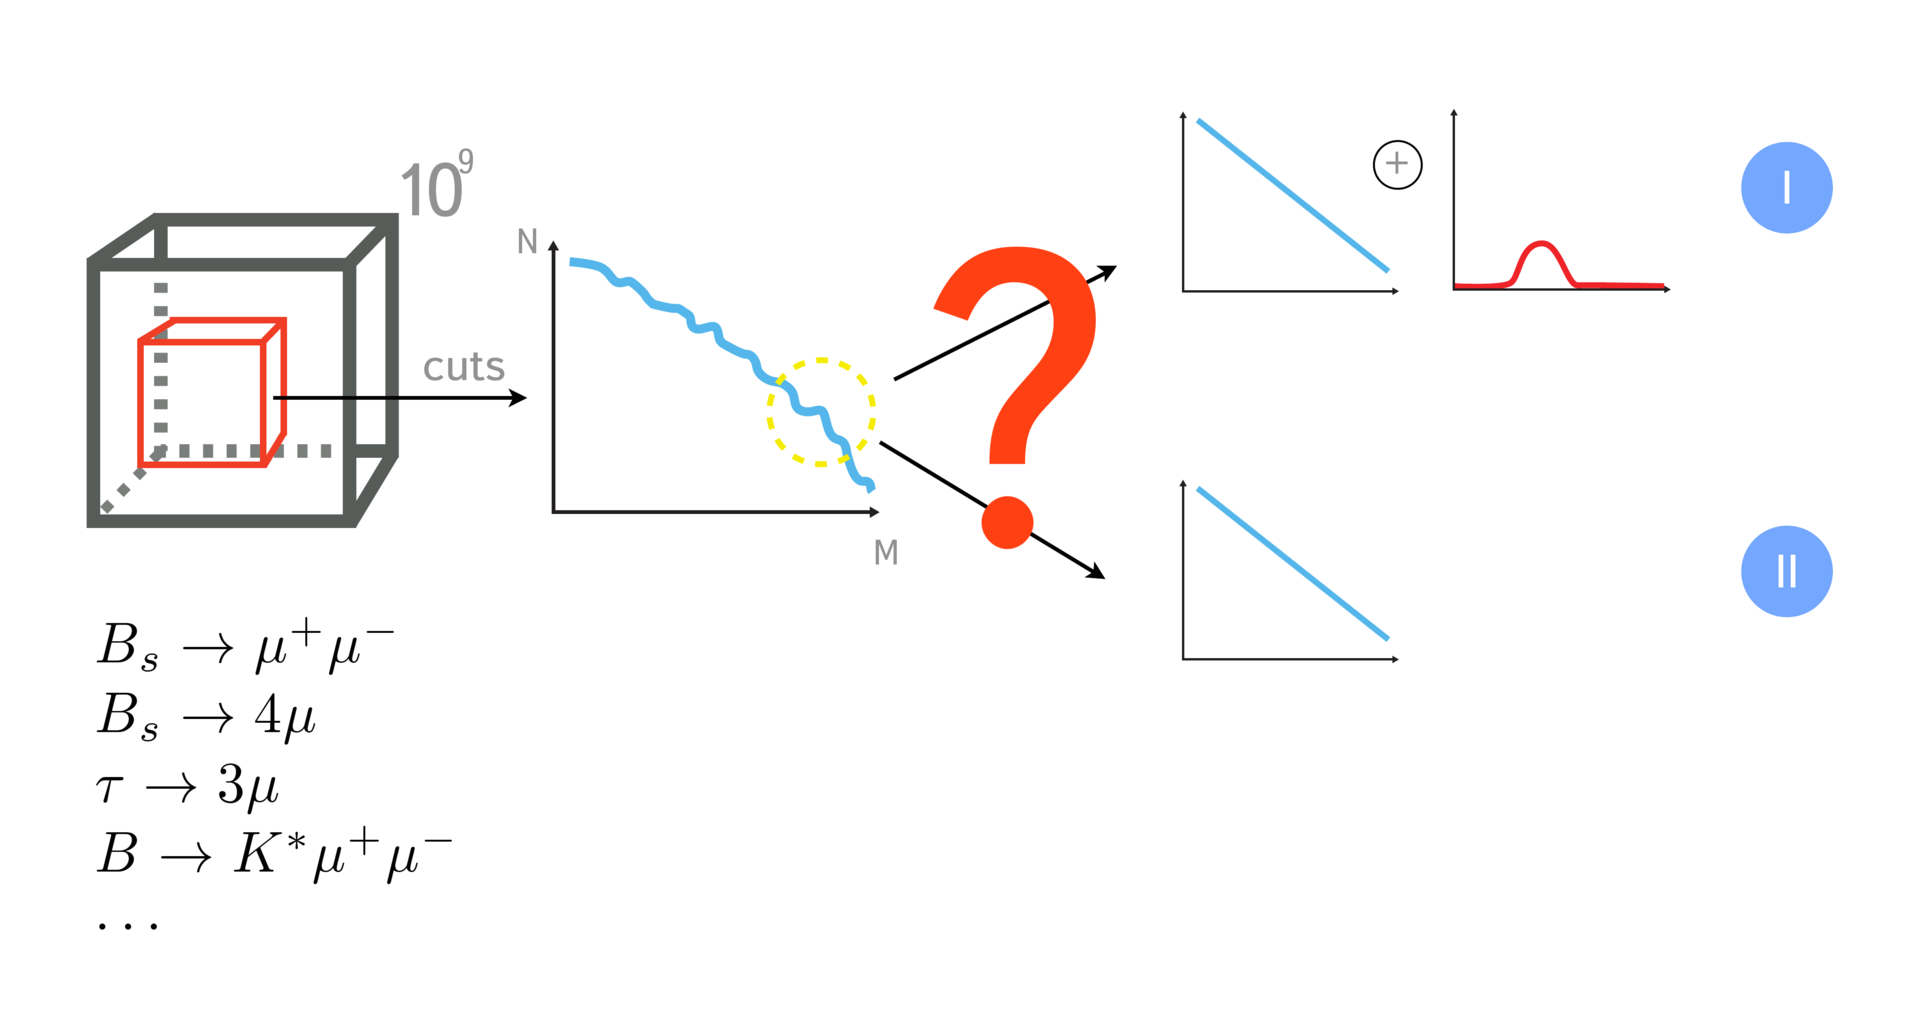
The sample can be disposed of differently, that is, there are different methods of analysis. The first is cut-based analysis. It lies in the fact that we impose restrictions on certain characteristics of events: momentum, transverse momentum, different angles of interacting particles, etc. Thus, we narrow down the criteria to see signaling events in the selected region. Based on how many events hit the selected region, we are trying to estimate how many events there are in all.
When relatively rare events are looked for (for example, events occurring with a probability of 3 * 10 -9 ), cut-based approaches do not work very well. Too large areas of space are caught in which background events may fall that have nothing to do with what we want to find.
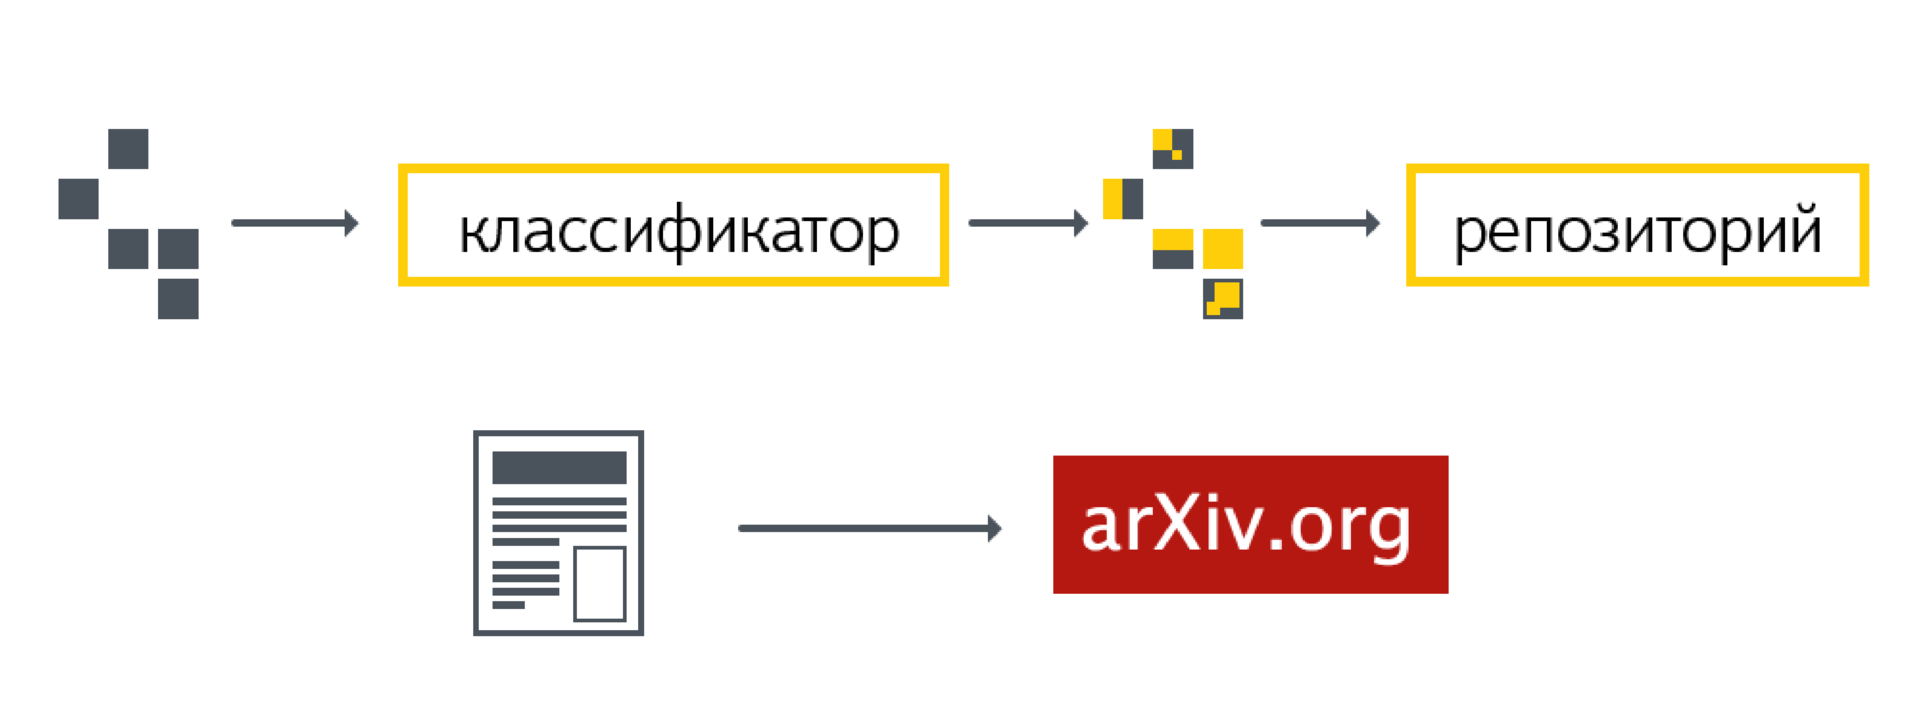
To improve the accuracy of the method, it was proposed to use machine learning technologies. With their help, it is possible, having learned from a sample (where we can definitely say what is a signal and what is not), to find a set of signs. These signs in the best way - or with the greatest reliability - describe the occurrence of signaling events.
To obtain data for the classifier and build a model of machine learning, various simulators are used. They are written, constructed and tuned by a special group of physicists. Simulators allow to generate events in an amount sufficient to learn how to distinguish a signal from a background.
We are building a classifier that allows you to select a certain part of the data volume (area of space). We can determine how many events fell into this area from real data. Further, a rather complicated process of analyzing assessments of the classifier’s work occurs. The result is a number or a pair of numbers: the probability of the origin of our event and the reliability of the origin of this event in our sample.

After approval of the analysis on the working groups and on internal audits, a document is published at CERN. It describes all the analysis steps that have been carried out. Also published an article in the journal.
There is an important point, which is not always, unfortunately, performed. The data and analysis code — the entire computational part — is stored in a special repository. This is done so that they can be returned. It is important to be able to conduct research in such a way that the results can be returned later, for example, ten years. During this time new, more advanced methods of analysis may appear. They will provide more accurate results on the same data.
We will try to schematically identify the main stages. There is an online data processing area (this is real-time work with high performance). There is a storage and post-processing area (infrastructure part).
There is an area associated with the generation of various model events. There is a post-analysis of the data accumulated in the GRID. Blue color on the diagram means offline analysis. It occurs up to obtaining the necessary estimates, specific numbers that go to the publication. The last area is a repository, data storage and analysis for later reproduction. For this area of physics do not get any buns, so they concentrate on other areas.
Asterisks mark the parts in which the systems and services of Yandex are involved. These are search and filtering of events (processing and construction of the classifier and its use), as well as data storage. We just started working on the latter. We joined the Data Preservation working group. So far it comes down to modifications of those services that we have done before: searching for events and saving the results of building a classifier. Otherwise, this is a history of comparing the performance of different classifiers.
In the case of SHIP, new opportunities open up before us. In this experiment, you can see how the technologies used in Yandex to build distributed systems correspond to the expectations of physicists.
I will conduct a short excursion devoted to computational models and ways of organizing the work of a distributed computing system.
On the left side is the BESM-6 supercomputer, probably the most serious computing tool in the history of mankind after the bills. On the other hand, we see personal computers united in a network. By organizing collaboration, they can get results that exceed the performance of supercomputers at that point in time.
The second stage is the emergence of the opportunity to build processors that are connected to each other with a fast bus inside one computer. This increases productivity. On the other hand, there are systems that integrate many productive computers into a computing cluster. Computers are connected to each other by a relatively stable connection with low latency and high throughput. Using some techniques of writing distributed programs, you can also improve performance.
This is some kind of spiral. On the left - the stages associated with centralized development (capacity building), on the right - with decentralization (an increase in such entities). A breakthrough in one area (the creation of some serious computational resource) gives scaling this resource to a certain number of computational units.
On the one hand, a supercomputer (CRAY, Lomonosov, Beowulf), on the other hand, the GRID distributed computing model, which is now being used very actively at CERN. GRID appeared in the mid-1990s and has grown significantly since then, but in many respects it retains its principles. For the needs of commercial companies, systems such as GRID were not very much in demand. This has given another direction to the development of technology - virtualization.
Virtualization is the ability to use resources and computing systems as services, in other words, cloud technologies. Now there are systems that allow you to combine different clouds with each other, coordinating actions and data transfer, thereby allowing you to increase productivity. Of course, such a scheme can not do without Skynet as the final stage of resource centralization.
If we talk about GRID, then it is worth considering the schedule of the workload of that section, which concerns CERN. There are moments when the load on resources is very high, and there are moments when, by and large, nothing happens. These are cycles; Specifically, on this graph, the day-night cycles are probably not very visible, but there are various fluctuations.
If you need to perform a large amount of calculations in a short time, then on GRID it is not easy to do. For this, you will need to specifically configure certain machines that any university or large company such as Yandex will provide. If the need to count a lot has disappeared, it is also not very easy to abandon the use of the cluster. This inertia is a property of a large system, partly due to political or administrative reasons. GRID is a kind of federation of various research organizations. Each of them invests resources into the overall system as much as possible. It turns out that you pay for the work of computers, regardless of what is now the degree of load on the GRID.
All machines included in GRID have a common interface, a set of programs and libraries. But there is a difficulty. If you want to use machines for solving problems that require special libraries that are not on GRID, you cannot do this. To configure the environment on all computers, certain administrative actions are required.
Cloud technologies can be considered as the next step in the development of computing systems. The advantages of virtualization include the ability to pay for actual calculations, as well as the ability to use the configuration you need.
You can combine these two directions. If we talk about specific solutions that are used in Yandex (and not only - they are distributed throughout the world) - these are Cocaine, Elliptics, Docker, OpenStack, etc. There are a lot of technologies, and the task is to find out which of them are best suited for the needs of physicists and researchers.
The picture above shows the scheme of work YARN - Yet Another Resource Negotiator. “Yet Another” has nothing to do with Yandex. The resource utilization model here is quite flexible and at the same time powerful.
For each client, you can create a unique environment to perform his tasks. As a client, you request the necessary set of resources from the resource manager. Having received it, you work with it as with a separate cluster (or a separate set of machines).
The second technology applicable in the context of distributed computing is Docker. It allows you to package your applications, libraries, and dependencies in a detachable container. The container can be run on any computer. On Linux, this all works quite well, only the kernel and core libraries are required of it. From the point of view of administration, Docker is a simple and straightforward thing: it does not require special installation of dependencies and the environment. The only thing that is required is a kernel with support for certain functionality. In all Linux distributions, this is not a problem.
Experiments on the "crossing" of GRID and the clouds continue to go. A recent example is Helix Nebula, a project supported by the European Commission. On the one hand, it includes several research institutions, including CERN and EASA, and on the other, commercial companies - providers of cloud technologies.
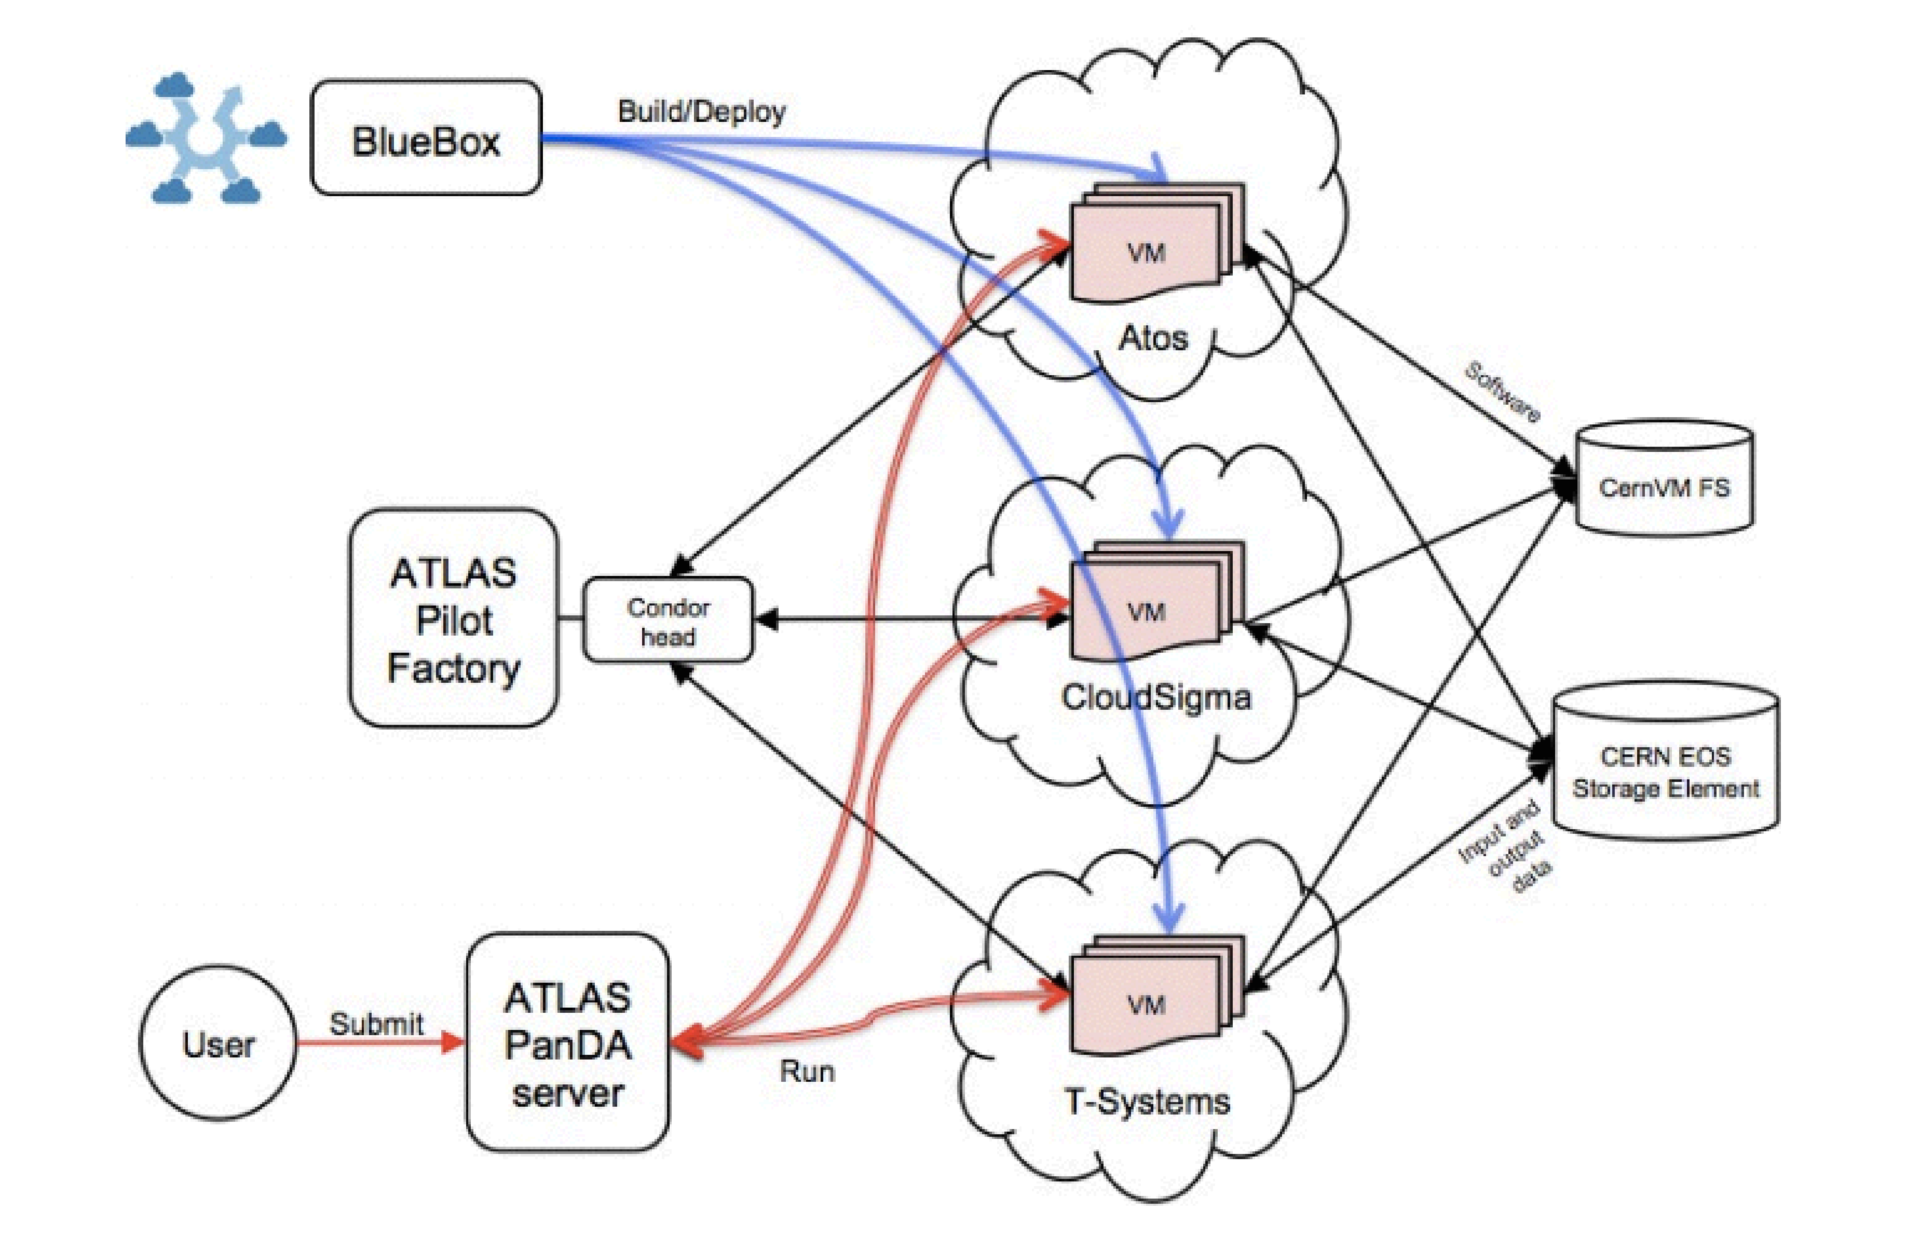
This is an example of one of the flagship projects for CERN, in which Monte-Carlo simulation was done using cloud technologies. There is a task distribution server, for this purpose the Panda framework was used. Virtual machines with Panda images accessed the server, and they placed the results and input data in the CERN GRID storage. Deployment and management of virtual machines was carried out from the project Helix Nebula. Bluebox is the old name for this project.
To summarize the tasks that confront those who build a model of calculations for experiments, this is event simulation (MC), search for real and simulated (MC) events, online and offline analysis, data storage (access interface), and code storage and analysis structures.
I didn’t talk about online analysis, as I don’t know as much about him as I would like. I will only note that the infrastructure must support data processing in real time (data come from the experiment). If you focus on a specific task - data analysis - then it should be noted that this is a difficult process. Many entities intersect in it. The indicators of complexity are the problems that researchers face, the questions they ask themselves. Perhaps some of you will find them familiar.
Sources of difficulty: physics, work with data, analysis strategy, analysis steps, team interaction. If everything was simple, then one person could analyze the data and write an article.
When you work with complex physical phenomena, you need to take into account many nuances - for example, there are several different models that explain the origin of certain phenomena. In physics, there are a huge number of such models, and to understand them is a great art. The data volume is large, and if you change something in this data, many versions of the same file appear.
An analysis strategy is a sequence of steps that must be performed in order to obtain some meaningful result. Pull out the data, order the Monte Carlo generation, pull out the data, pull out the normalization channel to compare it with the Monte Carlo, train one classifier, train the second classifier, apply the classifier to real data, check its effectiveness on the side regions, open the central part with interesting, to estimate the approximate number of events in the signal part, to calculate how many were there in reality. Whole story.
The analysis steps are different and quite complex. For example, to build a classifier, you need to do a lot of checks before making sure that you can use it, at a minimum, assess the quality, check whether the classifier is not retrained. A lot of people working in different countries work on the analysis. It is necessary that they find a common language and can understand each other.
We believe that an ecosystem supported by a hardware-software infrastructure is necessary to confront difficulties. It should allow for joint research in this subject area. You have a standard set of tools, and these tools are familiar to people (ROOT, PyROOT).
It is important to provide online access to what each team member is doing in order to change the parameters if necessary. There must be quality criteria and tools for their application.
We began to move in that direction. In Yandex, we faced similar tasks requiring the participation of a large number of researchers. For example, when learning search ranking formulas (several hundred people participated in it). Until we learned to automate a significant part of the process, people interfered with each other, stepped on each other's feet, compared oranges with cucumbers, did the same work. As a result, we created a system that automates the conduct of experiments, which seemed to us a good idea.
The system is tied to our internal infrastructure, and to transfer it to other areas is problematic. We are trying to make a system for physics from scratch, using the tools available to us.
For example, one of the services we provided by CERN, the Event Filter, is built around Matrixnet, a classifier construction system. Initially, it was just a web interface that allows you to upload your data, train the formula and unload the formula back. It turned out that this is not very convenient, since the formulas must be trained, optimized on the parameter space. For a single analysis, you may need to train several thousand different formulas. It is impossible to shout all this by hand. Therefore, we made a system that wraps access to the Event Filter via Python, the second most popular language in high energy physics.
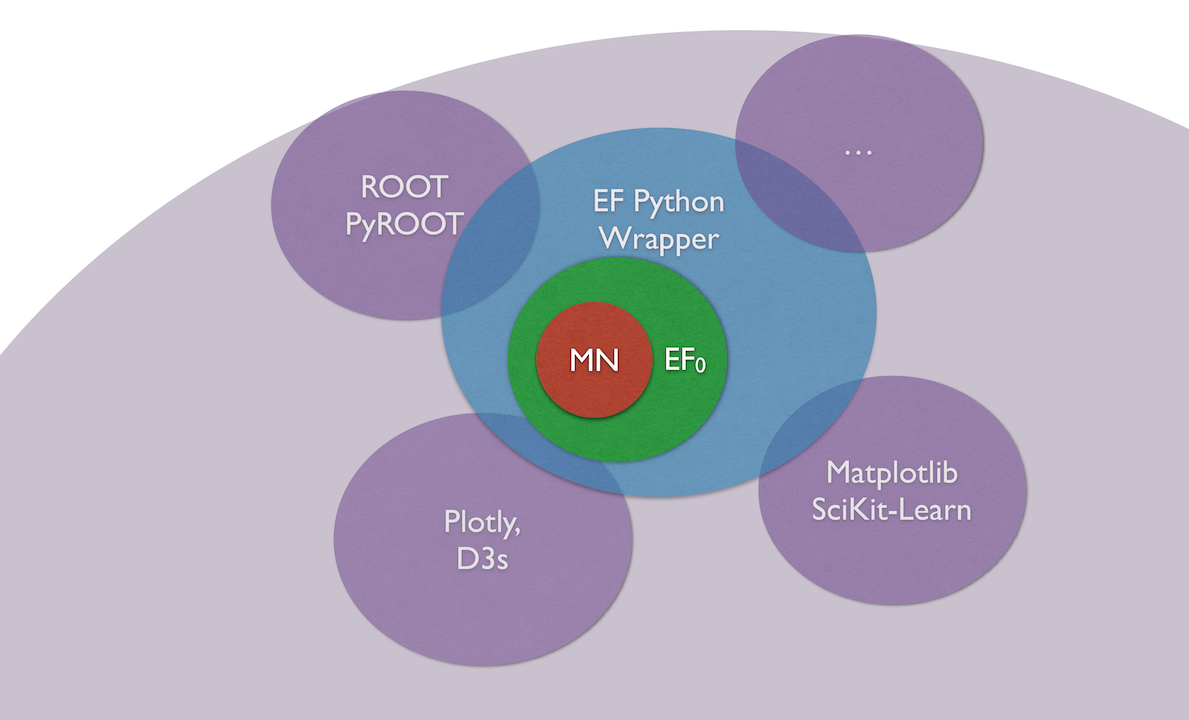
By integrating the system with Python, it became possible to use different libraries in the same space (ROOT, Matplotlib SciKit-Learn, interactive graph display).
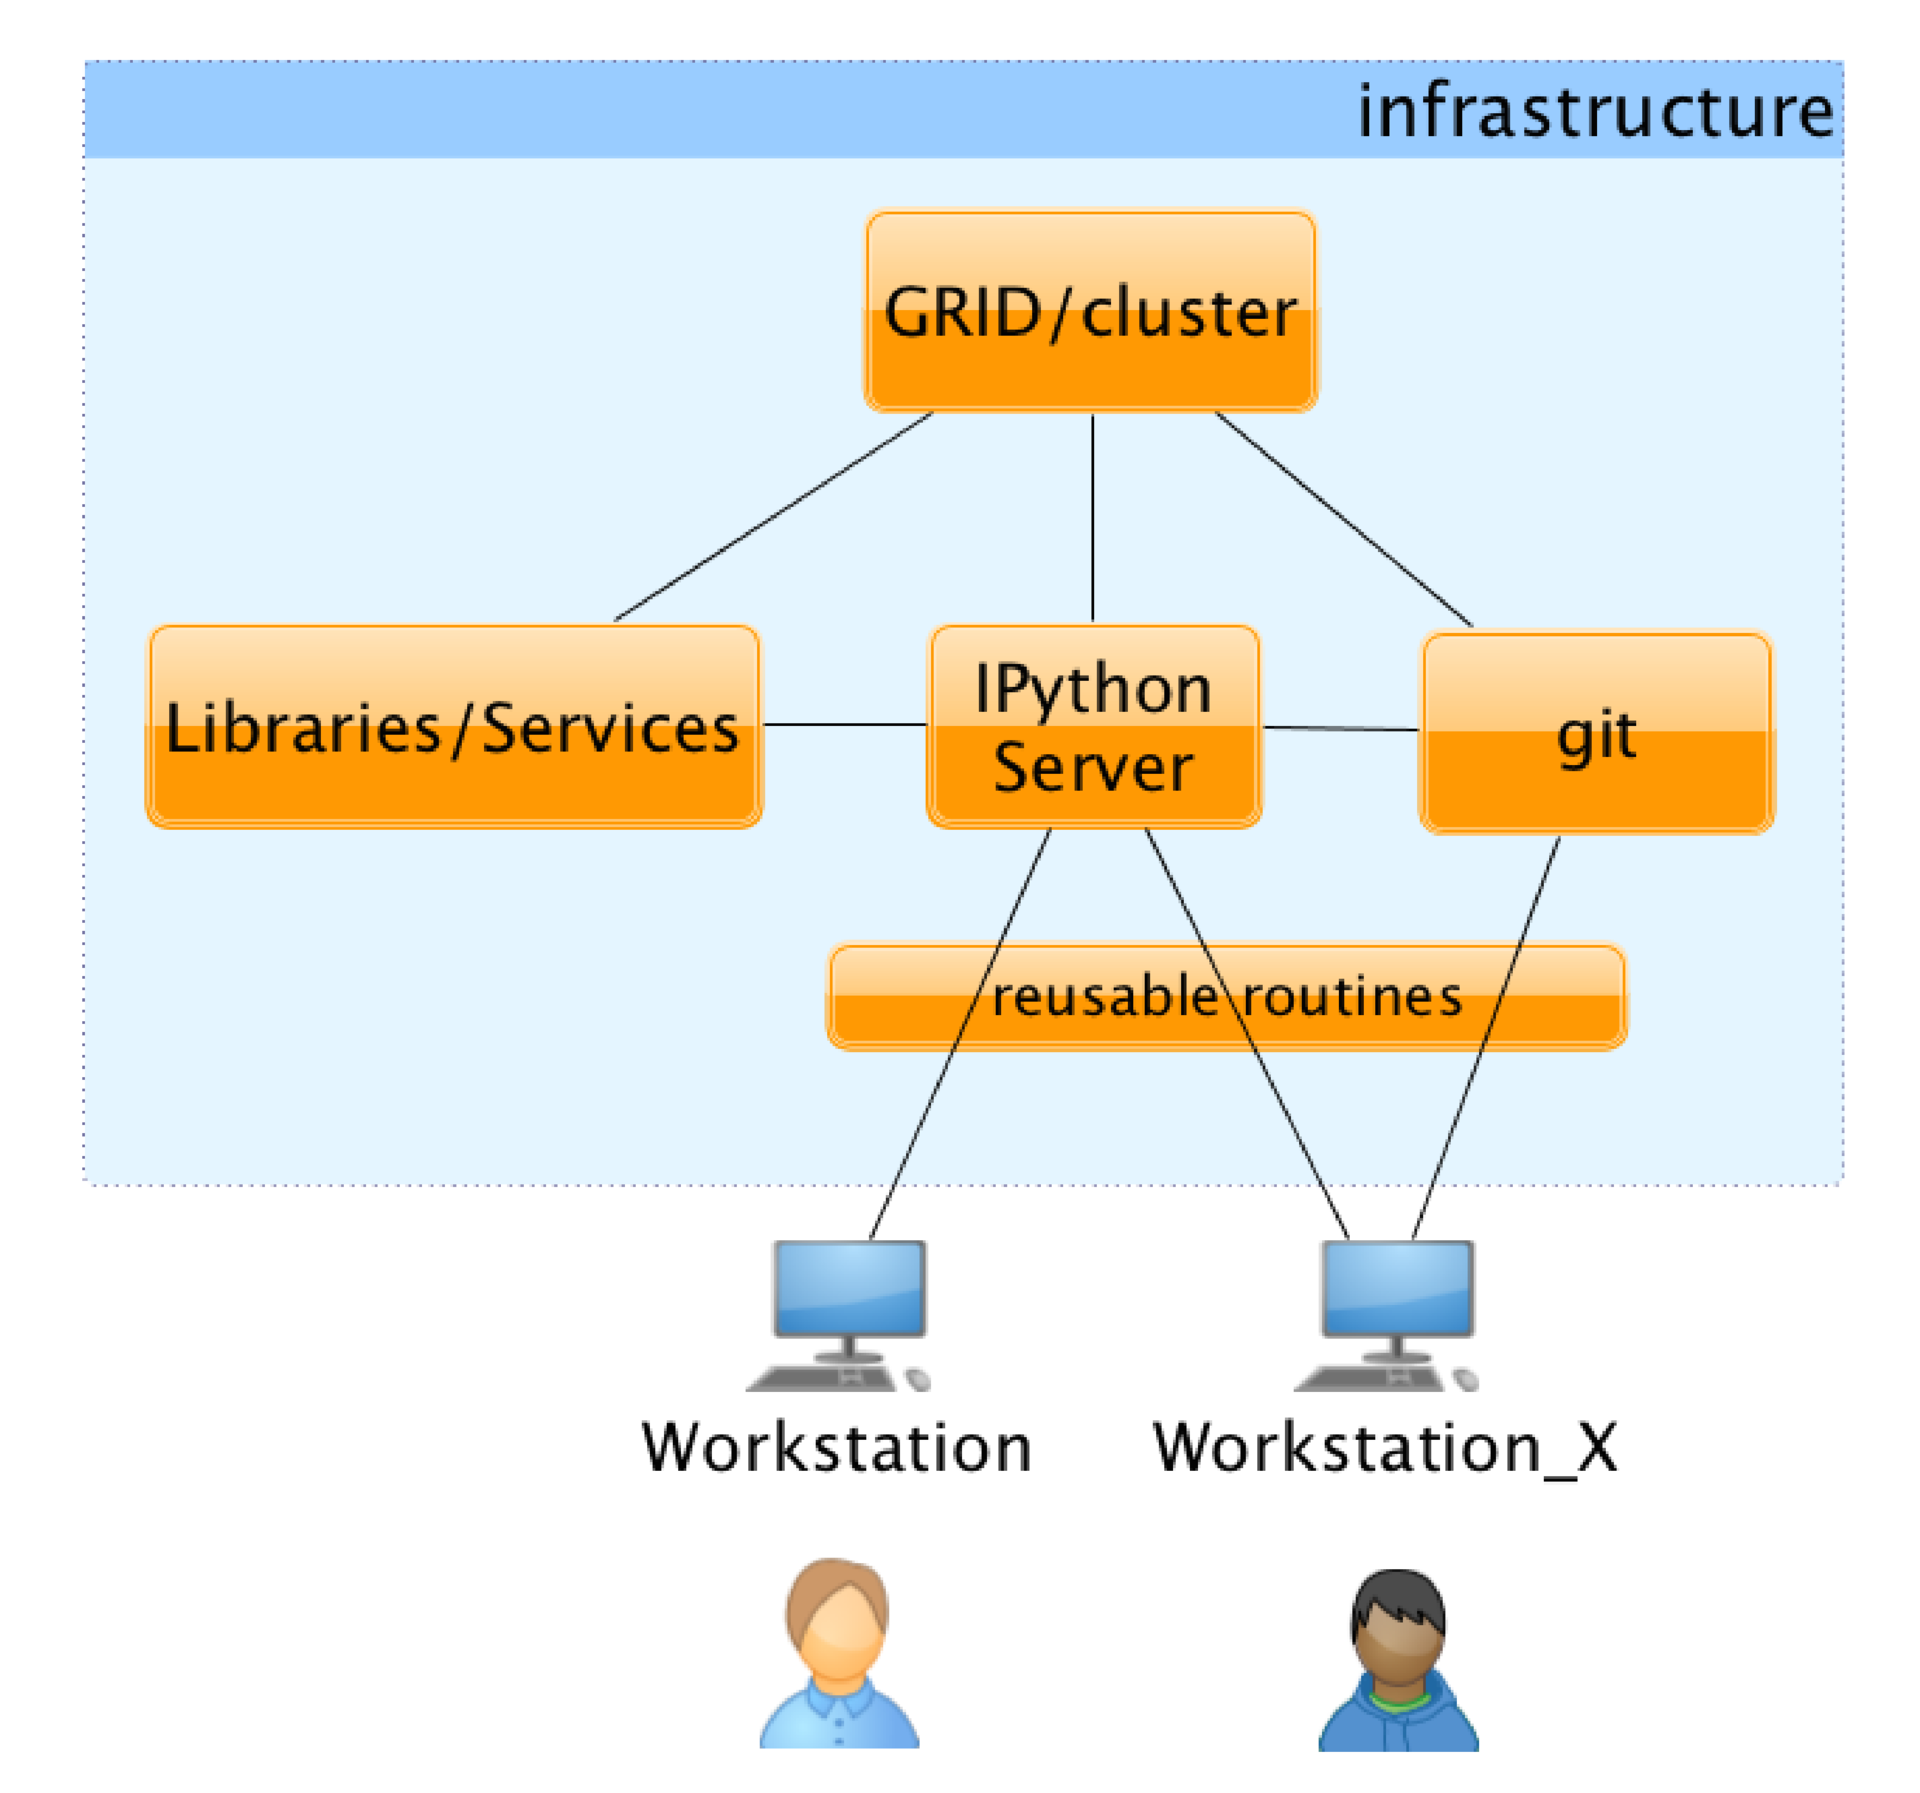
Since we used IPython to work, all the libraries and capabilities merged for the user in one interface. The interface, however, hides several important components. For the user, this looks like a web page on which certain modules are available. He himself writes these modules and can publish them so that other researchers can use them: libraries, a distributed environment for performing calculations, and a versioning system for storing intermediate results. For the user, it all looks something like this: the page on which the code and the results of his work are interspersed can be seen in what these or other changes result.
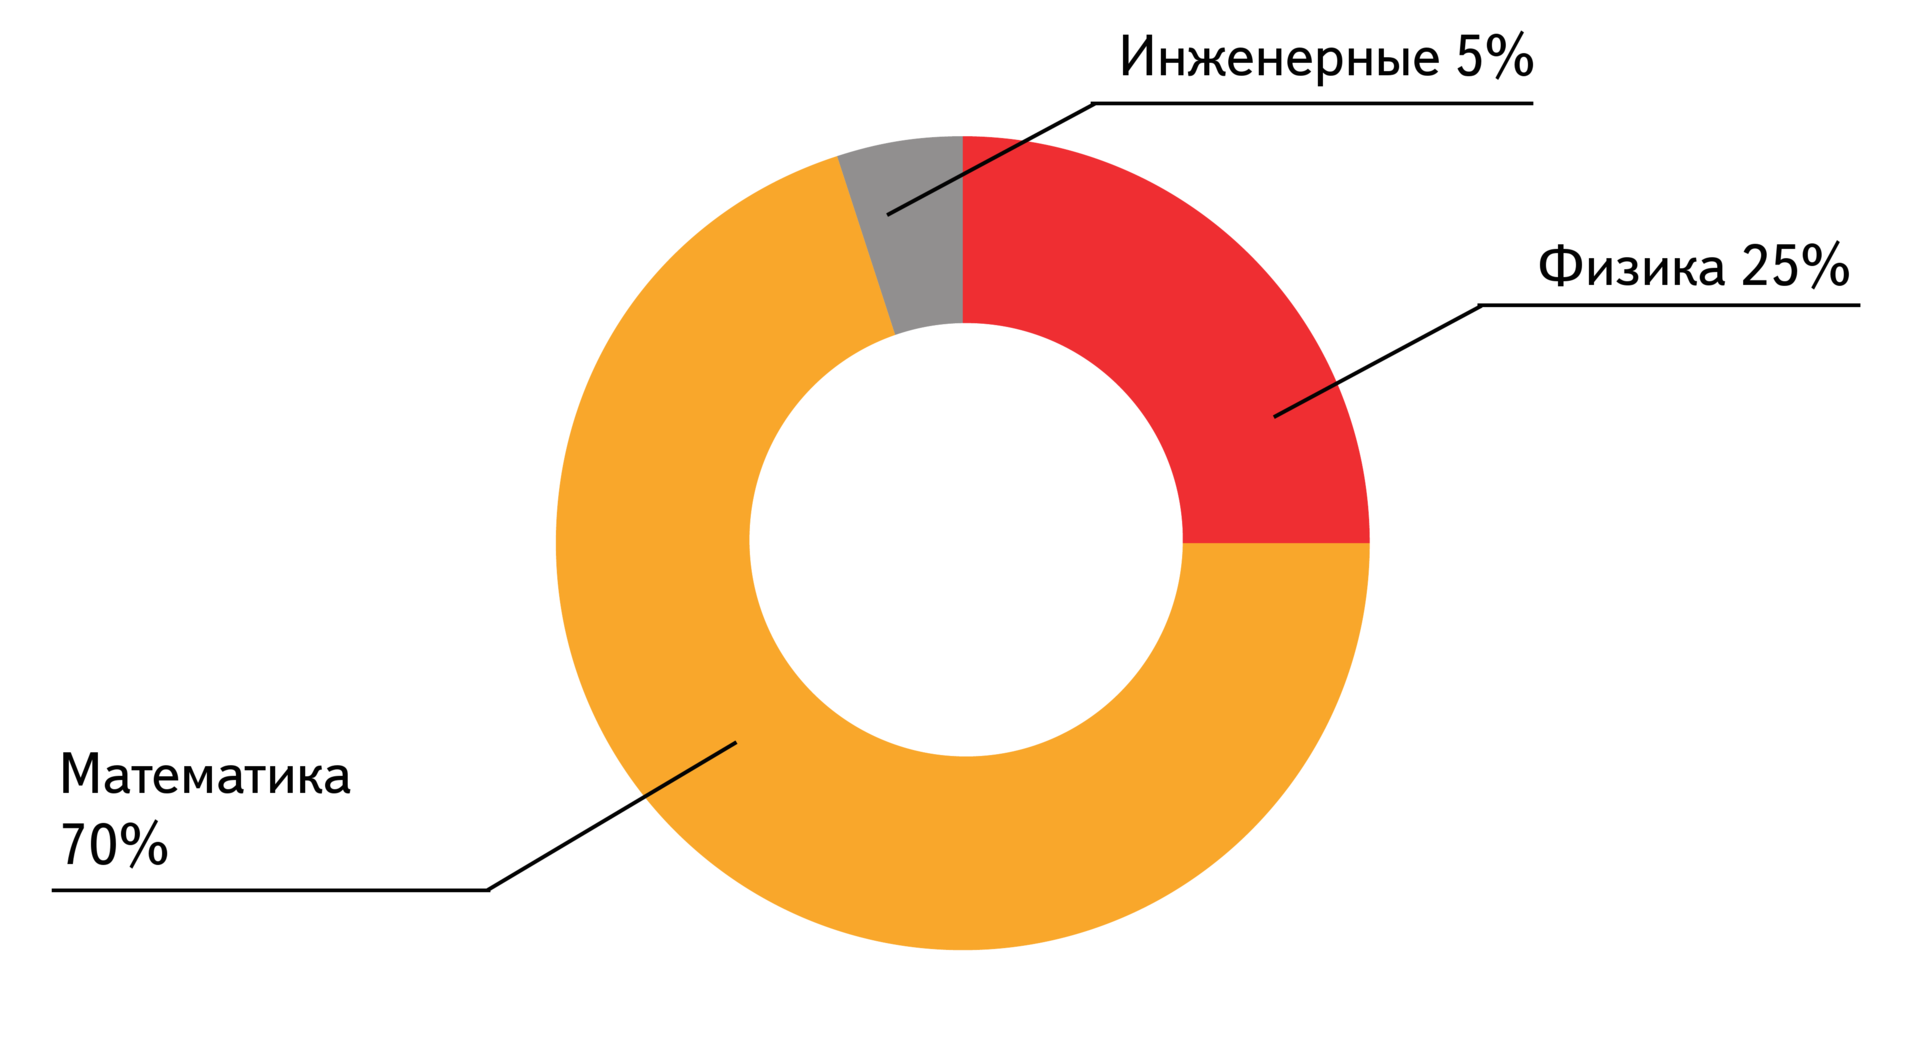
Mathematics prevail among SAD students - 70% of them. Next come the physicists - 25% and engineers - 5%. The courses taught at the School of Academic Affairs are not very closely related to physics, but people still have an attachment to the main specialty and they apply their knowledge in it. The main courses of the SAD are algorithms and data structures, machine learning, discrete mathematics, probability theory, statistics, natural language processing, graph theory.
At this moment, the department of SHAD is MFTI, MSU, HSE and other leading universities. This year, the Faculty of Theoretical Informatics at the Higher School of Economics was opened; An internship program is now open for students from European universities.
Here is a small example of a study at the interface of physics and machine learning:
Here there is an Analysis of events, a small subsample (10 5 ), from which we want to understand: only noise or noise + signal is present there. If there is a signal, then you need to figure out how much of this signal. When we try to train a classifier on working on simulated data, it is important that the distribution schedule of selected (over any threshold) signals in the case when the classifier is given only a background, has approximately the same shape as the background.
If it turns out that the distributions of the background before and after applying the classifier for some variable differ, then the classifier cannot be used for real analysis, since it is difficult to assess the systematic error introduced by it.
The services we currently provide to CERN are the Event Index and Event Filter. They can also be claimed in new experiments - in particular, in SHIP, which gives us a new direction of work. We have technologies that can provide a good platform for the development of research.
Now we can apply these technologies to solve our own problems, but we are interested in learning how to apply them somewhere else. This is one of the directions of the company. For students of the SAD on their profile, this trend may also seem interesting.
Andrey spoke about the use of Yandex technologies in high-energy physics. These days, experiments often work with a great number of people from different countries. A combined ecosystem for automating experiments can make the work of researchers more coordinated and help solve many other problems. A single interface, online access to the results of other participants, a versioning system and the ability to share libraries - all this can greatly simplify the lives of researchers.
')
In addition, machine learning is actively used in modern high-energy physics. On the basis of test samples, classifiers are trained, which further determine the presence of certain events already in real data. At the same time, the number of formulas that may need to be trained for one analysis reaches several hundreds or even thousands. It is necessary, however, to keep in mind that our developments are applicable not only in this area, but also in other branches of science. This report is more about research in general, about the process of experimental confirmation of various theories, hypotheses and models. Such tasks are usually faced by people from research organizations, but now they are increasingly emerging in commercial companies.
At first, people searched for answers to questions in speculative constructions, and then tested their hypotheses using various tools and practical technologies: stopwatches, scales, rulers. In the experimenter’s instrumentation, such instruments had significant weight until recently.
The picture above shows a photograph from a bubble chamber that detects the movement of charged particles through a medium saturated with hydrogen vapor. It is seen that the charged particles leave trajectories behind them - bubbles. One of the particles knocked out an electron from a hydrogen atom — it makes noticeable spiral motions in an electric field. Crosses mark which paths to consider and which not. Mark made a man.
Now everything is more complicated. To test the hypothesis, conduct experiments worth hundreds of millions and even billions of Swiss francs. The cost of the experiment is not only hardware (dig a tunnel, install accelerators, install detectors that will accurately record flying particles that are charged or unloaded). It is also algorithms that allow you to analyze the accumulated data and make reliable conclusions, as well as technologies for storing data and their effective processing. Thus, the task is complicated by many orders of magnitude compared to what was until recently.
We sketch out what happens in the hadron collider from the registration of a collision of charged particles to the publication of an article. When analyzing and processing events, the following steps occur.
Here it is still important to note that physicists are more interested in not specific events inside the detector and how they proceed (for example, what happens during transformation and interaction of particles), but statistical characteristics of the origin of a certain type of event. If a physicist tries to estimate a population of a certain country, he is interested in the number of women, men, people of a certain age group, that is, the total characteristics. They can confirm or refute certain hypotheses.
For example, the standard model predicts that the decay of the b-meson into a muon-anti-muon pair occurs 3 * 10 -9 times. If you analyze the available volume of events and prove that this is so, then the standard model is valid. If it turns out, for example, that events occur an order of magnitude more often, then the standard model does not take into account something. This is the reason to apply for a new physics. At CERN, people are trying to find at least some deviations from the standard model.
Let's go back to the steps. First, the detector generates a data stream. With a frequency of 40 million times per second, proton beams collide. As a result of collisions particles are born, which, in turn, break up into something else.
This data enters the processing farm, which operates in real time. She needs to have time to process the flow of incoming data, while the portion from the next collision does not take up computing power. The task of the farm is to select a small part from the entire flow of events (10 7 events per second): 10 -4 , 10 -3 or even less. These are the most interesting events in which something happens.
The results are in the storage system - GRID. So, the LHCb experiment gives 10 10 events per year. Each of the events weighs about 100 kilobytes. It happens differently, of course, depending on whether the raw data is considered as events or only processed.
Suppose a group of physicists decides to test a model or a hypothesis. First, they prefetch the data. From the entire array (10 10 events), according to certain parameters, some part is selected, for example, 10 5 or 10 6 events. This is a sample.
The question is how to estimate the number of signaling events in our sample? Well, and then you can answer the question, how many signal events were there in volume? As a result, our task is to estimate the probability of the origin of this signaling event.
The sample can be disposed of differently, that is, there are different methods of analysis. The first is cut-based analysis. It lies in the fact that we impose restrictions on certain characteristics of events: momentum, transverse momentum, different angles of interacting particles, etc. Thus, we narrow down the criteria to see signaling events in the selected region. Based on how many events hit the selected region, we are trying to estimate how many events there are in all.
When relatively rare events are looked for (for example, events occurring with a probability of 3 * 10 -9 ), cut-based approaches do not work very well. Too large areas of space are caught in which background events may fall that have nothing to do with what we want to find.
To improve the accuracy of the method, it was proposed to use machine learning technologies. With their help, it is possible, having learned from a sample (where we can definitely say what is a signal and what is not), to find a set of signs. These signs in the best way - or with the greatest reliability - describe the occurrence of signaling events.
To obtain data for the classifier and build a model of machine learning, various simulators are used. They are written, constructed and tuned by a special group of physicists. Simulators allow to generate events in an amount sufficient to learn how to distinguish a signal from a background.
We are building a classifier that allows you to select a certain part of the data volume (area of space). We can determine how many events fell into this area from real data. Further, a rather complicated process of analyzing assessments of the classifier’s work occurs. The result is a number or a pair of numbers: the probability of the origin of our event and the reliability of the origin of this event in our sample.
After approval of the analysis on the working groups and on internal audits, a document is published at CERN. It describes all the analysis steps that have been carried out. Also published an article in the journal.
There is an important point, which is not always, unfortunately, performed. The data and analysis code — the entire computational part — is stored in a special repository. This is done so that they can be returned. It is important to be able to conduct research in such a way that the results can be returned later, for example, ten years. During this time new, more advanced methods of analysis may appear. They will provide more accurate results on the same data.
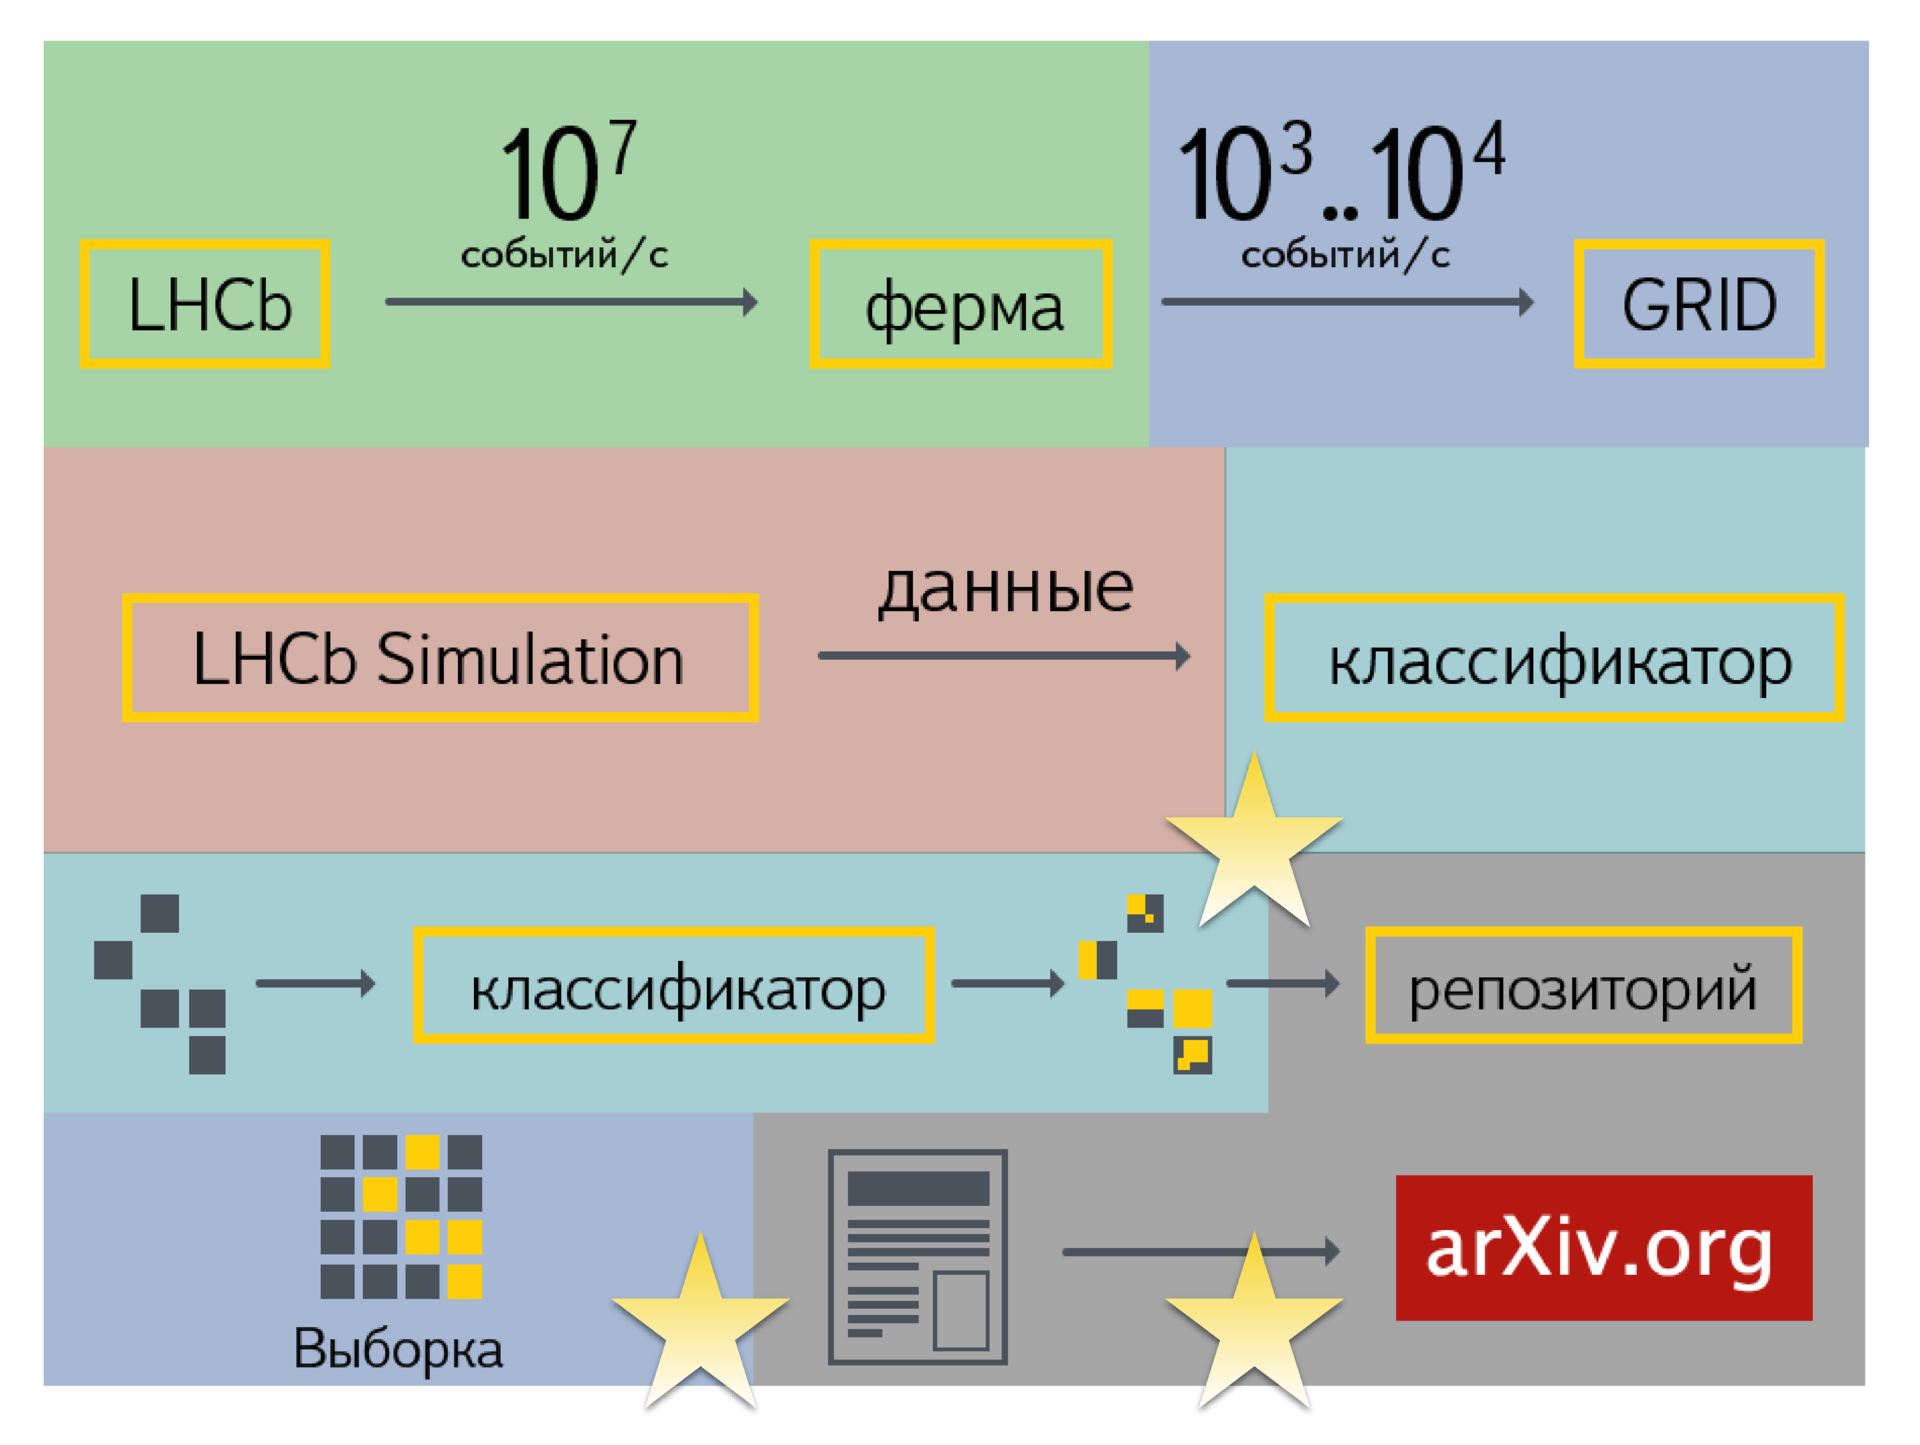
We will try to schematically identify the main stages. There is an online data processing area (this is real-time work with high performance). There is a storage and post-processing area (infrastructure part).
There is an area associated with the generation of various model events. There is a post-analysis of the data accumulated in the GRID. Blue color on the diagram means offline analysis. It occurs up to obtaining the necessary estimates, specific numbers that go to the publication. The last area is a repository, data storage and analysis for later reproduction. For this area of physics do not get any buns, so they concentrate on other areas.
Asterisks mark the parts in which the systems and services of Yandex are involved. These are search and filtering of events (processing and construction of the classifier and its use), as well as data storage. We just started working on the latter. We joined the Data Preservation working group. So far it comes down to modifications of those services that we have done before: searching for events and saving the results of building a classifier. Otherwise, this is a history of comparing the performance of different classifiers.
In the case of SHIP, new opportunities open up before us. In this experiment, you can see how the technologies used in Yandex to build distributed systems correspond to the expectations of physicists.
Calculation Models
I will conduct a short excursion devoted to computational models and ways of organizing the work of a distributed computing system.
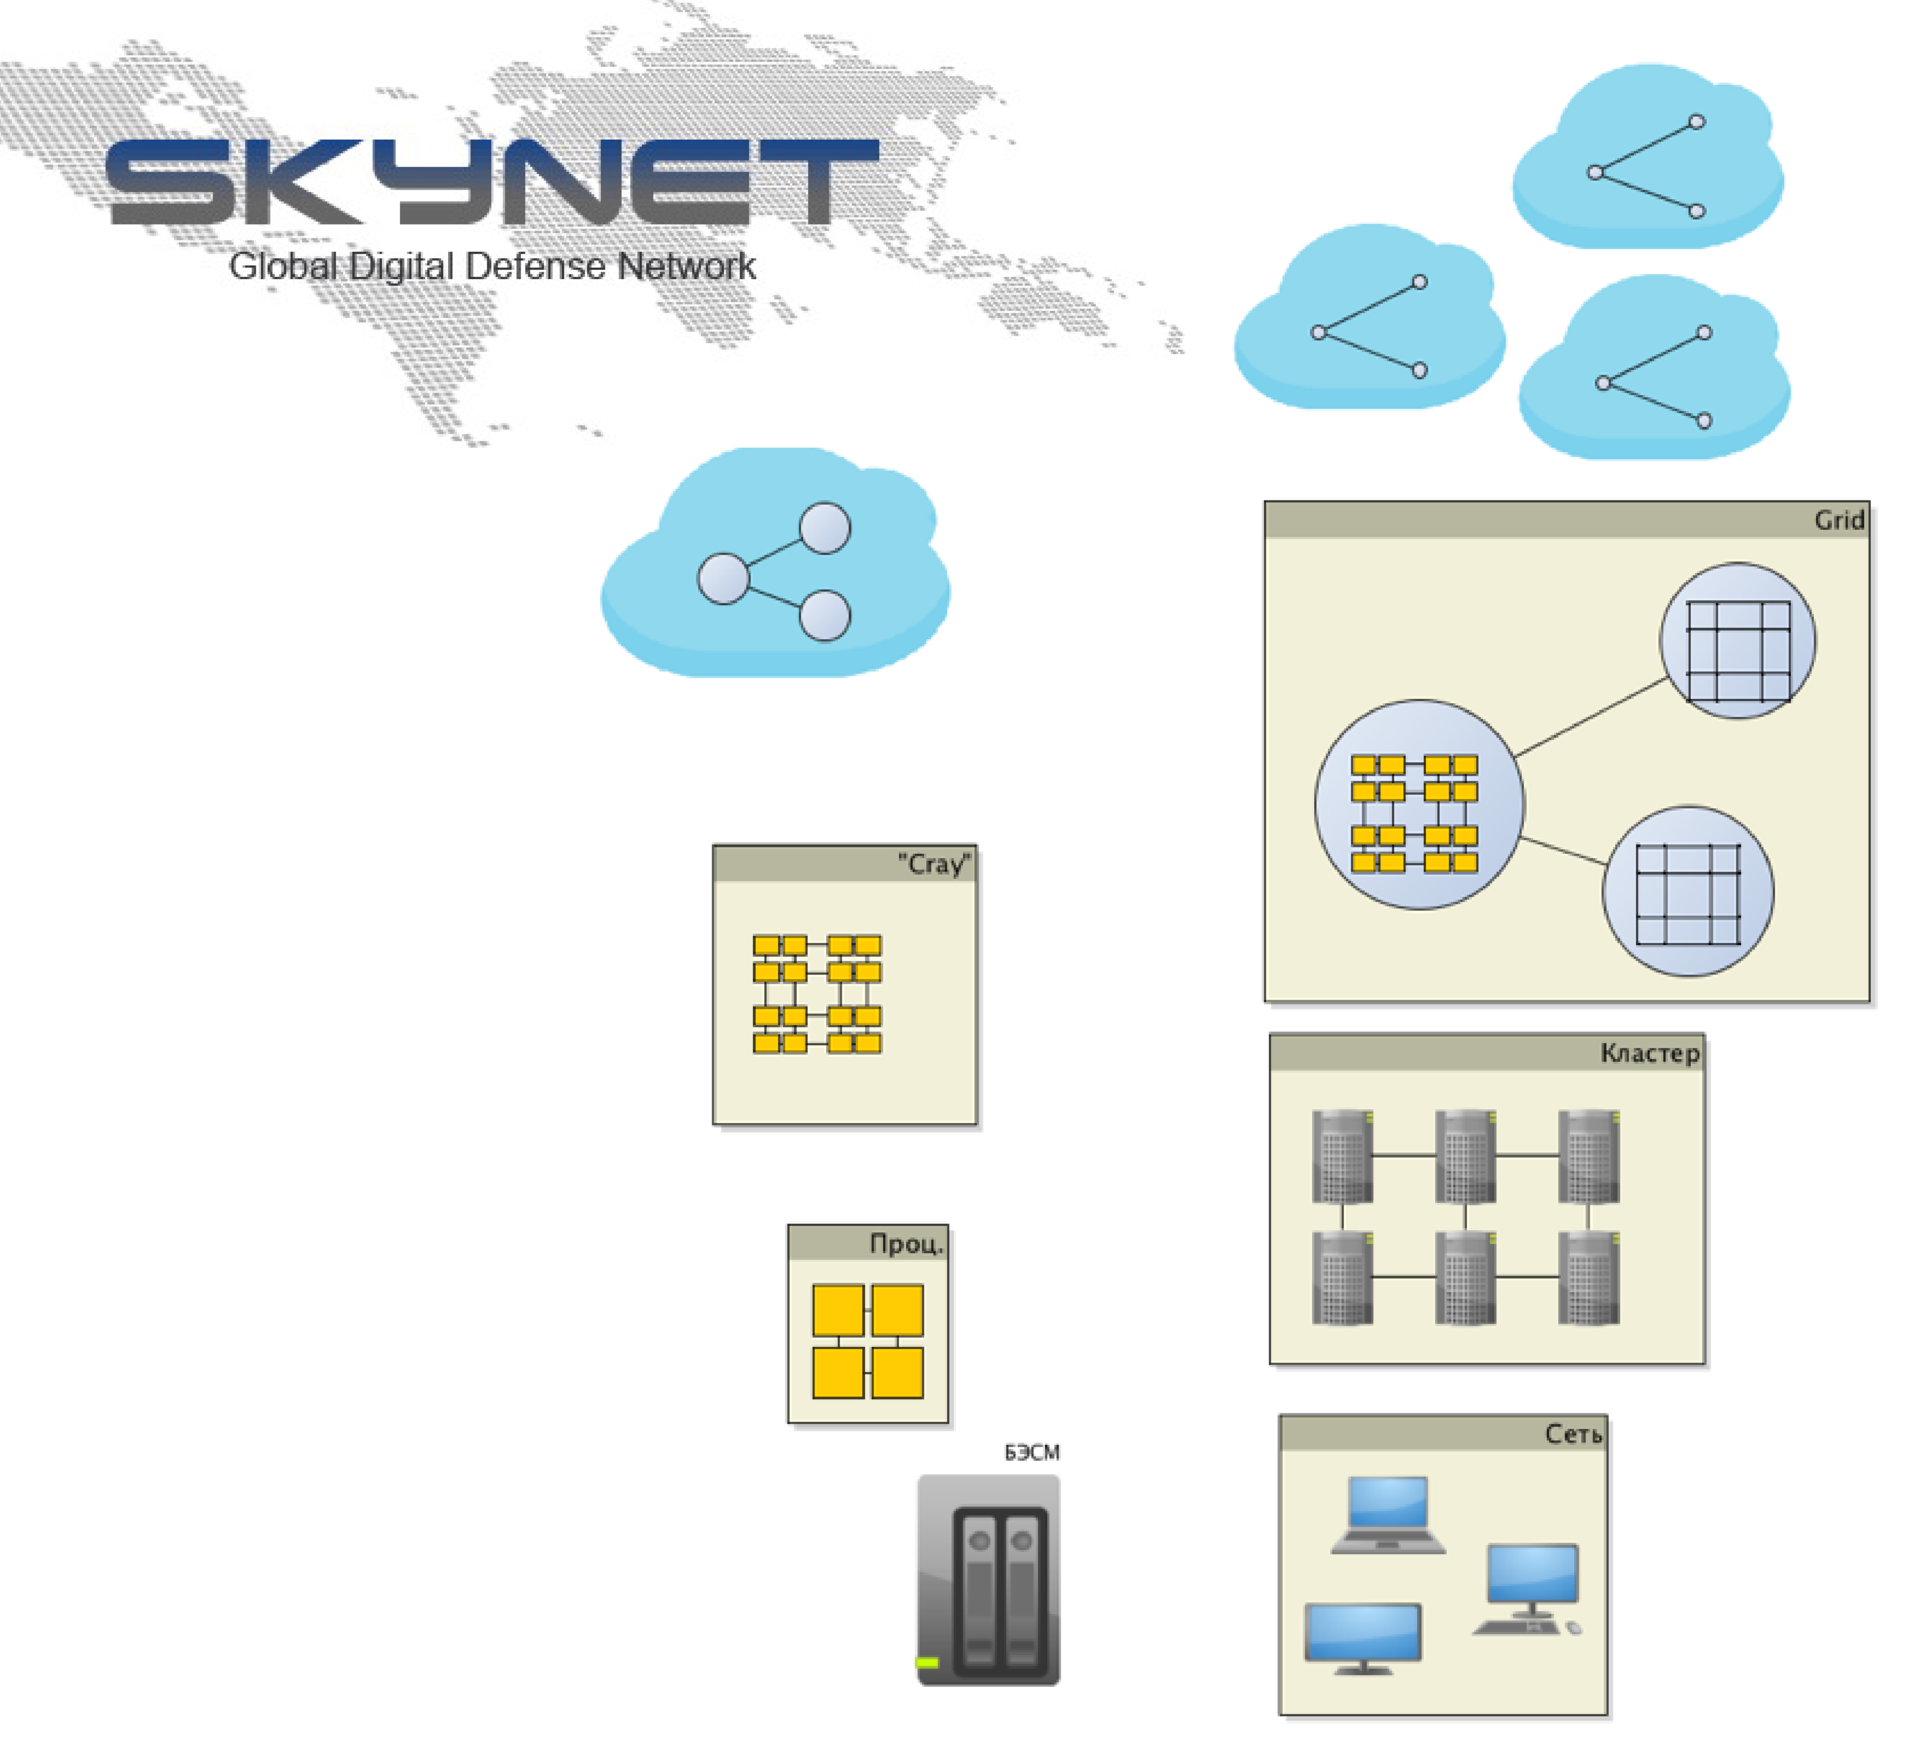
On the left side is the BESM-6 supercomputer, probably the most serious computing tool in the history of mankind after the bills. On the other hand, we see personal computers united in a network. By organizing collaboration, they can get results that exceed the performance of supercomputers at that point in time.
The second stage is the emergence of the opportunity to build processors that are connected to each other with a fast bus inside one computer. This increases productivity. On the other hand, there are systems that integrate many productive computers into a computing cluster. Computers are connected to each other by a relatively stable connection with low latency and high throughput. Using some techniques of writing distributed programs, you can also improve performance.
This is some kind of spiral. On the left - the stages associated with centralized development (capacity building), on the right - with decentralization (an increase in such entities). A breakthrough in one area (the creation of some serious computational resource) gives scaling this resource to a certain number of computational units.
On the one hand, a supercomputer (CRAY, Lomonosov, Beowulf), on the other hand, the GRID distributed computing model, which is now being used very actively at CERN. GRID appeared in the mid-1990s and has grown significantly since then, but in many respects it retains its principles. For the needs of commercial companies, systems such as GRID were not very much in demand. This has given another direction to the development of technology - virtualization.
Virtualization is the ability to use resources and computing systems as services, in other words, cloud technologies. Now there are systems that allow you to combine different clouds with each other, coordinating actions and data transfer, thereby allowing you to increase productivity. Of course, such a scheme can not do without Skynet as the final stage of resource centralization.
Using GRID resources
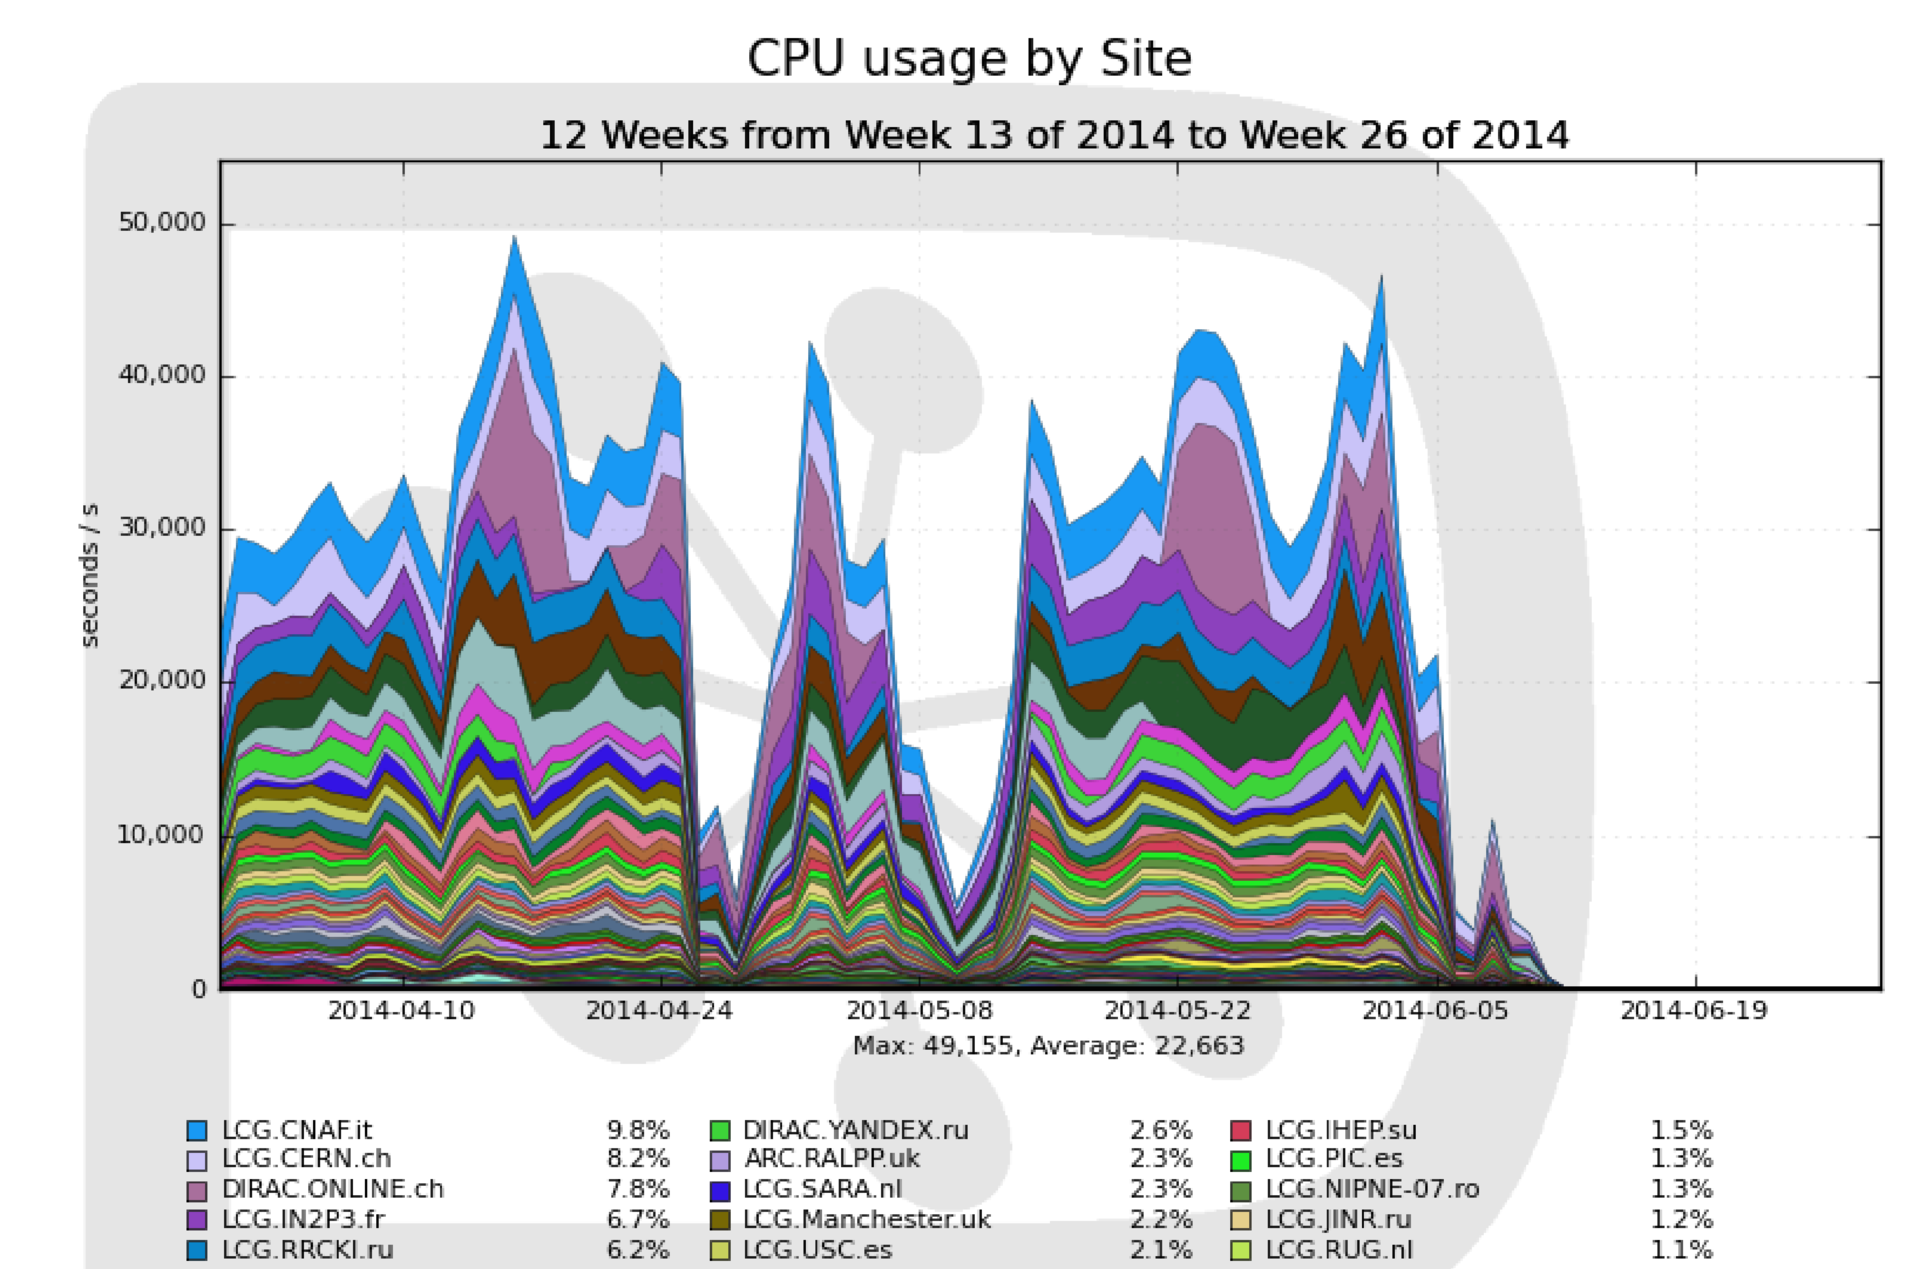
If we talk about GRID, then it is worth considering the schedule of the workload of that section, which concerns CERN. There are moments when the load on resources is very high, and there are moments when, by and large, nothing happens. These are cycles; Specifically, on this graph, the day-night cycles are probably not very visible, but there are various fluctuations.
If you need to perform a large amount of calculations in a short time, then on GRID it is not easy to do. For this, you will need to specifically configure certain machines that any university or large company such as Yandex will provide. If the need to count a lot has disappeared, it is also not very easy to abandon the use of the cluster. This inertia is a property of a large system, partly due to political or administrative reasons. GRID is a kind of federation of various research organizations. Each of them invests resources into the overall system as much as possible. It turns out that you pay for the work of computers, regardless of what is now the degree of load on the GRID.
All machines included in GRID have a common interface, a set of programs and libraries. But there is a difficulty. If you want to use machines for solving problems that require special libraries that are not on GRID, you cannot do this. To configure the environment on all computers, certain administrative actions are required.
Cloud technologies
Cloud technologies can be considered as the next step in the development of computing systems. The advantages of virtualization include the ability to pay for actual calculations, as well as the ability to use the configuration you need.
You can combine these two directions. If we talk about specific solutions that are used in Yandex (and not only - they are distributed throughout the world) - these are Cocaine, Elliptics, Docker, OpenStack, etc. There are a lot of technologies, and the task is to find out which of them are best suited for the needs of physicists and researchers.
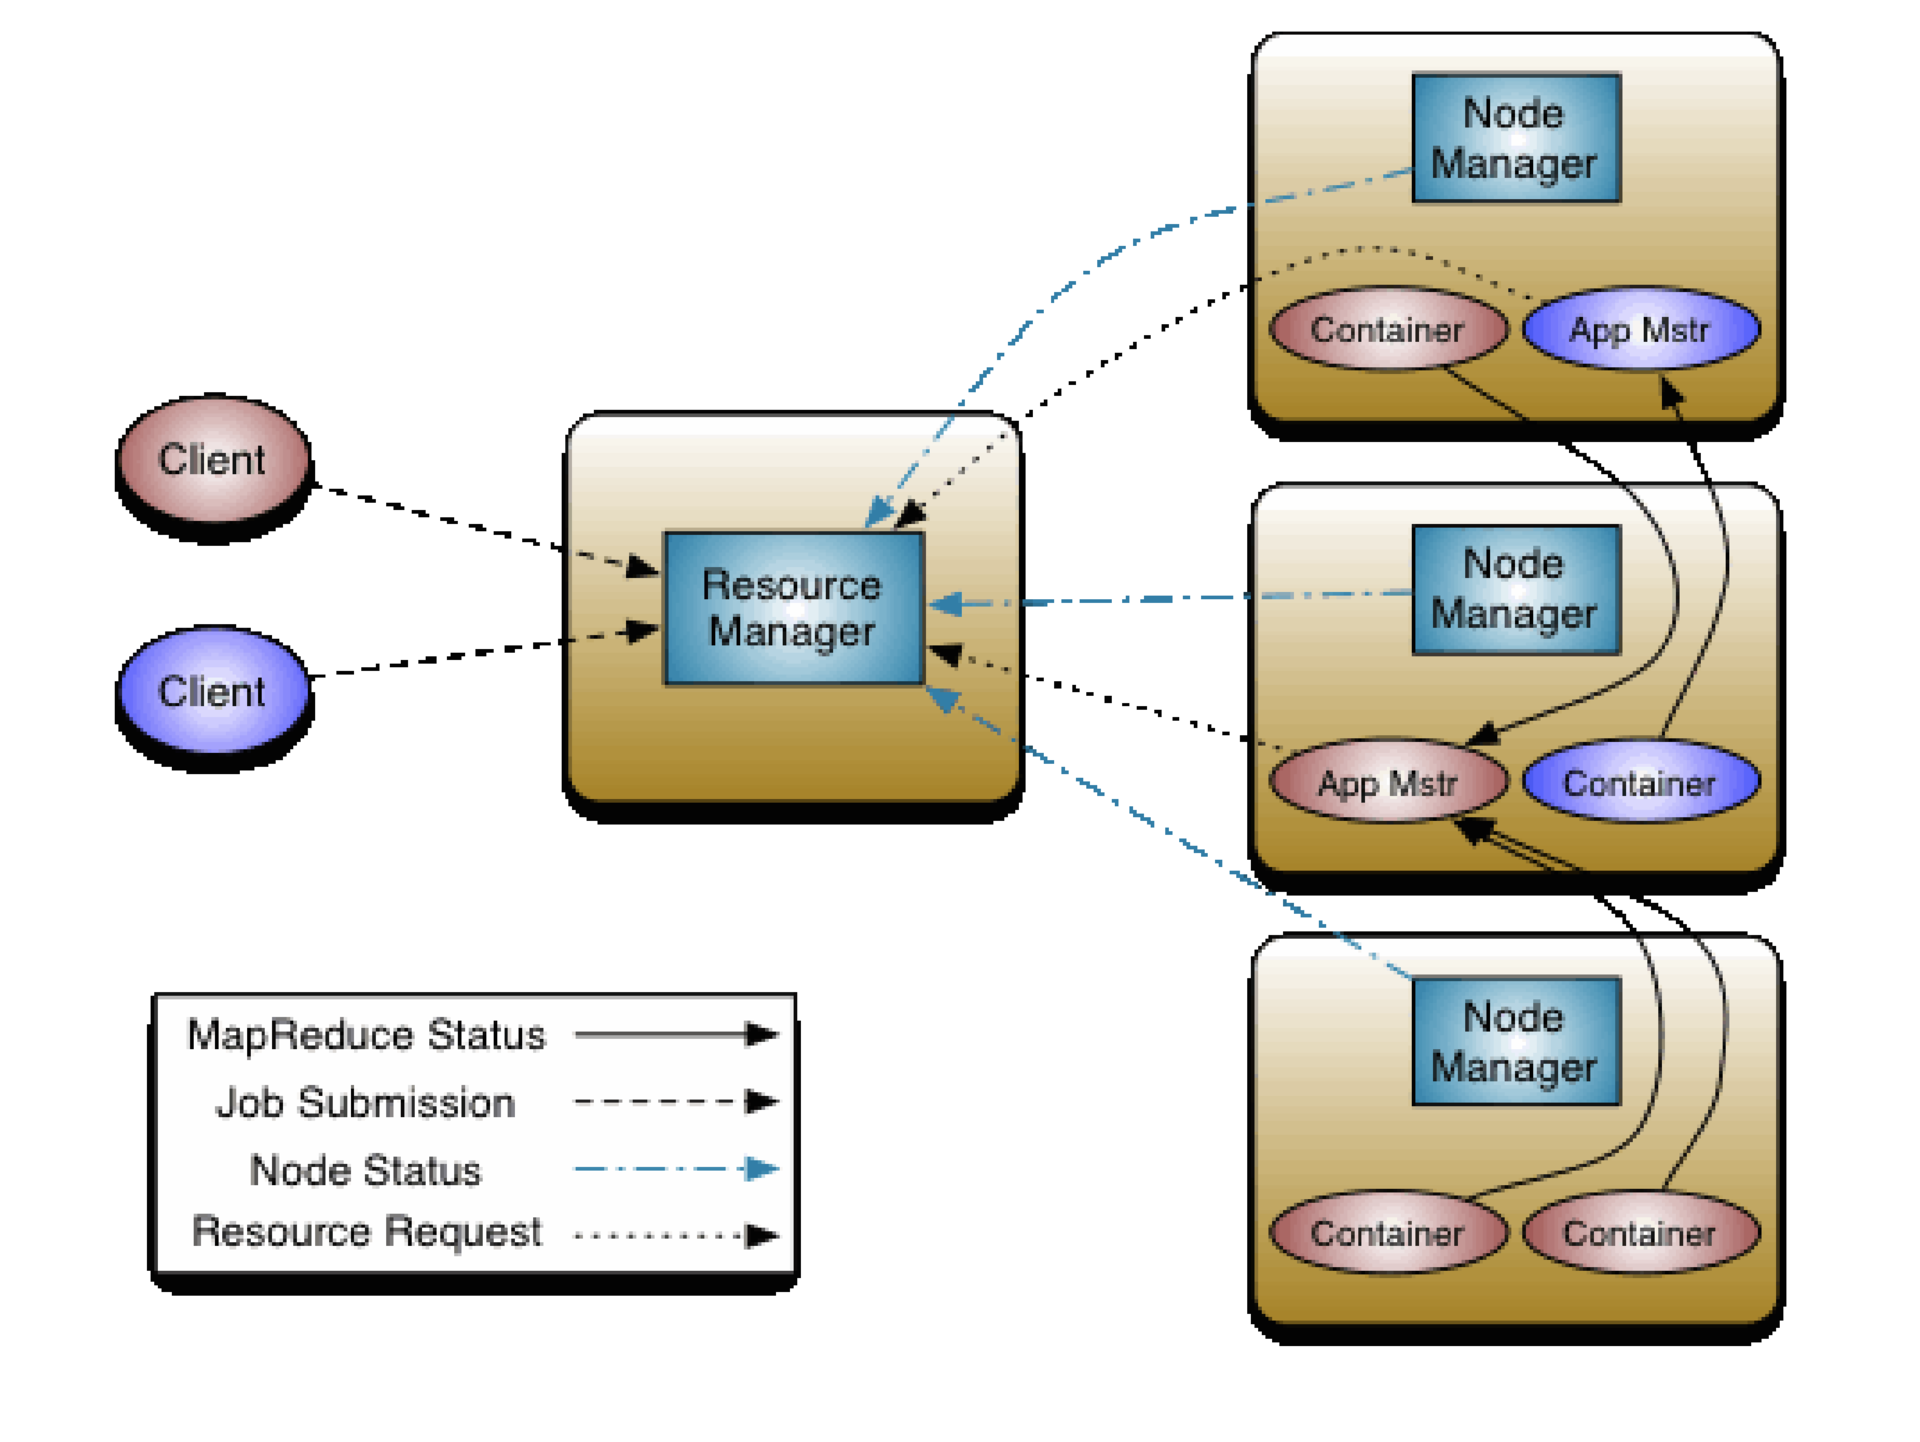
The picture above shows the scheme of work YARN - Yet Another Resource Negotiator. “Yet Another” has nothing to do with Yandex. The resource utilization model here is quite flexible and at the same time powerful.
For each client, you can create a unique environment to perform his tasks. As a client, you request the necessary set of resources from the resource manager. Having received it, you work with it as with a separate cluster (or a separate set of machines).
The second technology applicable in the context of distributed computing is Docker. It allows you to package your applications, libraries, and dependencies in a detachable container. The container can be run on any computer. On Linux, this all works quite well, only the kernel and core libraries are required of it. From the point of view of administration, Docker is a simple and straightforward thing: it does not require special installation of dependencies and the environment. The only thing that is required is a kernel with support for certain functionality. In all Linux distributions, this is not a problem.
Experiments on the "crossing" of GRID and the clouds continue to go. A recent example is Helix Nebula, a project supported by the European Commission. On the one hand, it includes several research institutions, including CERN and EASA, and on the other, commercial companies - providers of cloud technologies.
This is an example of one of the flagship projects for CERN, in which Monte-Carlo simulation was done using cloud technologies. There is a task distribution server, for this purpose the Panda framework was used. Virtual machines with Panda images accessed the server, and they placed the results and input data in the CERN GRID storage. Deployment and management of virtual machines was carried out from the project Helix Nebula. Bluebox is the old name for this project.
Tasks
To summarize the tasks that confront those who build a model of calculations for experiments, this is event simulation (MC), search for real and simulated (MC) events, online and offline analysis, data storage (access interface), and code storage and analysis structures.
I didn’t talk about online analysis, as I don’t know as much about him as I would like. I will only note that the infrastructure must support data processing in real time (data come from the experiment). If you focus on a specific task - data analysis - then it should be noted that this is a difficult process. Many entities intersect in it. The indicators of complexity are the problems that researchers face, the questions they ask themselves. Perhaps some of you will find them familiar.
- How did I generate the chart "13"?
- A new student wants to use a model published by me 3 years ago, but I cannot reproduce a single graphic.
- I thought that I use the same parameters, but I get different results!?!?
- Where can I get the events selected by the previous version of my scripts?
- It worked yesterday!
- Why did I do this?
Sources of difficulty: physics, work with data, analysis strategy, analysis steps, team interaction. If everything was simple, then one person could analyze the data and write an article.
When you work with complex physical phenomena, you need to take into account many nuances - for example, there are several different models that explain the origin of certain phenomena. In physics, there are a huge number of such models, and to understand them is a great art. The data volume is large, and if you change something in this data, many versions of the same file appear.
An analysis strategy is a sequence of steps that must be performed in order to obtain some meaningful result. Pull out the data, order the Monte Carlo generation, pull out the data, pull out the normalization channel to compare it with the Monte Carlo, train one classifier, train the second classifier, apply the classifier to real data, check its effectiveness on the side regions, open the central part with interesting, to estimate the approximate number of events in the signal part, to calculate how many were there in reality. Whole story.
The analysis steps are different and quite complex. For example, to build a classifier, you need to do a lot of checks before making sure that you can use it, at a minimum, assess the quality, check whether the classifier is not retrained. A lot of people working in different countries work on the analysis. It is necessary that they find a common language and can understand each other.
Experiment Ecosystem
We believe that an ecosystem supported by a hardware-software infrastructure is necessary to confront difficulties. It should allow for joint research in this subject area. You have a standard set of tools, and these tools are familiar to people (ROOT, PyROOT).
It is important to provide online access to what each team member is doing in order to change the parameters if necessary. There must be quality criteria and tools for their application.
We began to move in that direction. In Yandex, we faced similar tasks requiring the participation of a large number of researchers. For example, when learning search ranking formulas (several hundred people participated in it). Until we learned to automate a significant part of the process, people interfered with each other, stepped on each other's feet, compared oranges with cucumbers, did the same work. As a result, we created a system that automates the conduct of experiments, which seemed to us a good idea.
The system is tied to our internal infrastructure, and to transfer it to other areas is problematic. We are trying to make a system for physics from scratch, using the tools available to us.
For example, one of the services we provided by CERN, the Event Filter, is built around Matrixnet, a classifier construction system. Initially, it was just a web interface that allows you to upload your data, train the formula and unload the formula back. It turned out that this is not very convenient, since the formulas must be trained, optimized on the parameter space. For a single analysis, you may need to train several thousand different formulas. It is impossible to shout all this by hand. Therefore, we made a system that wraps access to the Event Filter via Python, the second most popular language in high energy physics.
By integrating the system with Python, it became possible to use different libraries in the same space (ROOT, Matplotlib SciKit-Learn, interactive graph display).
Since we used IPython to work, all the libraries and capabilities merged for the user in one interface. The interface, however, hides several important components. For the user, this looks like a web page on which certain modules are available. He himself writes these modules and can publish them so that other researchers can use them: libraries, a distributed environment for performing calculations, and a versioning system for storing intermediate results. For the user, it all looks something like this: the page on which the code and the results of his work are interspersed can be seen in what these or other changes result.
School of data analysis
Mathematics prevail among SAD students - 70% of them. Next come the physicists - 25% and engineers - 5%. The courses taught at the School of Academic Affairs are not very closely related to physics, but people still have an attachment to the main specialty and they apply their knowledge in it. The main courses of the SAD are algorithms and data structures, machine learning, discrete mathematics, probability theory, statistics, natural language processing, graph theory.
At this moment, the department of SHAD is MFTI, MSU, HSE and other leading universities. This year, the Faculty of Theoretical Informatics at the Higher School of Economics was opened; An internship program is now open for students from European universities.
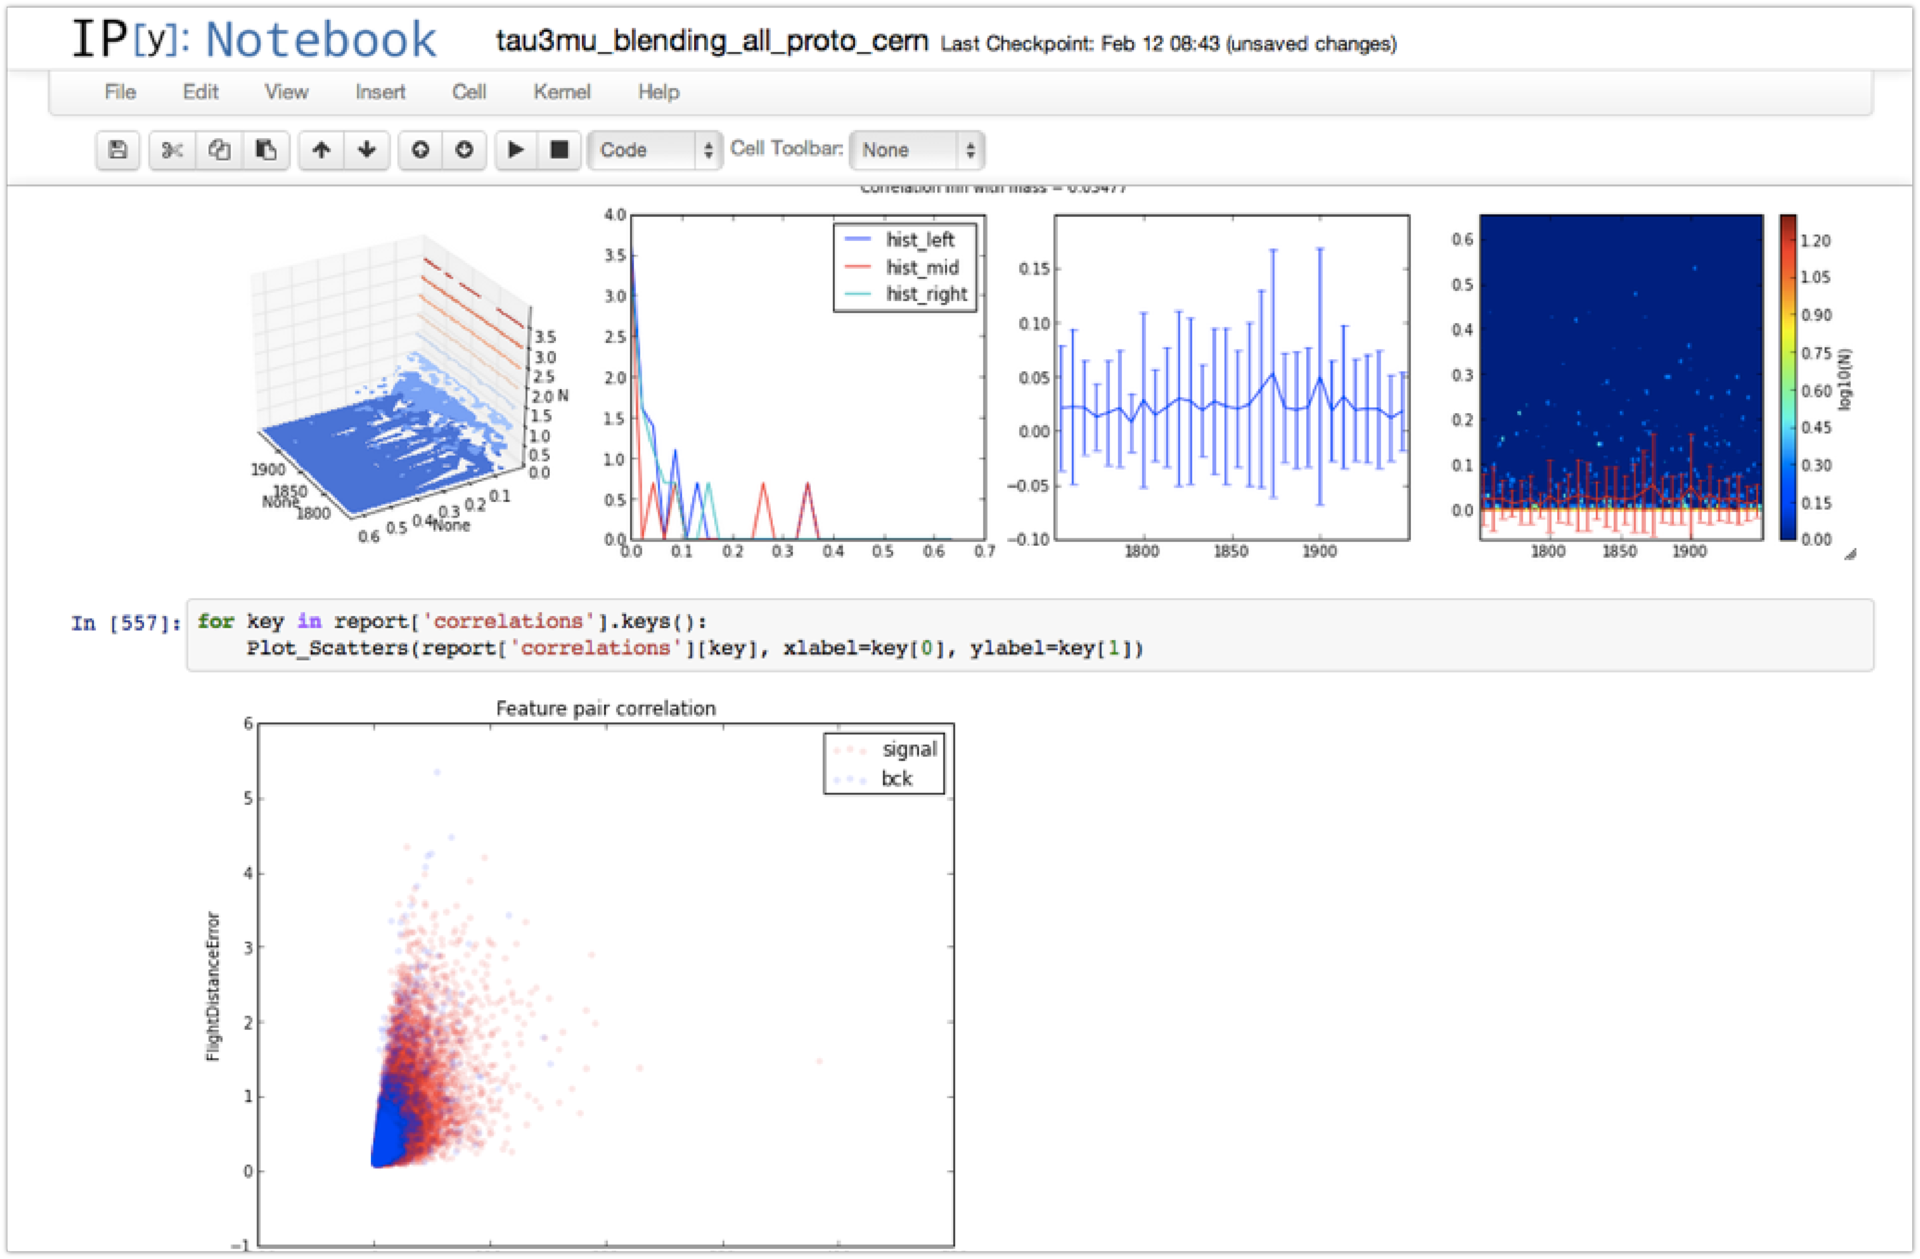
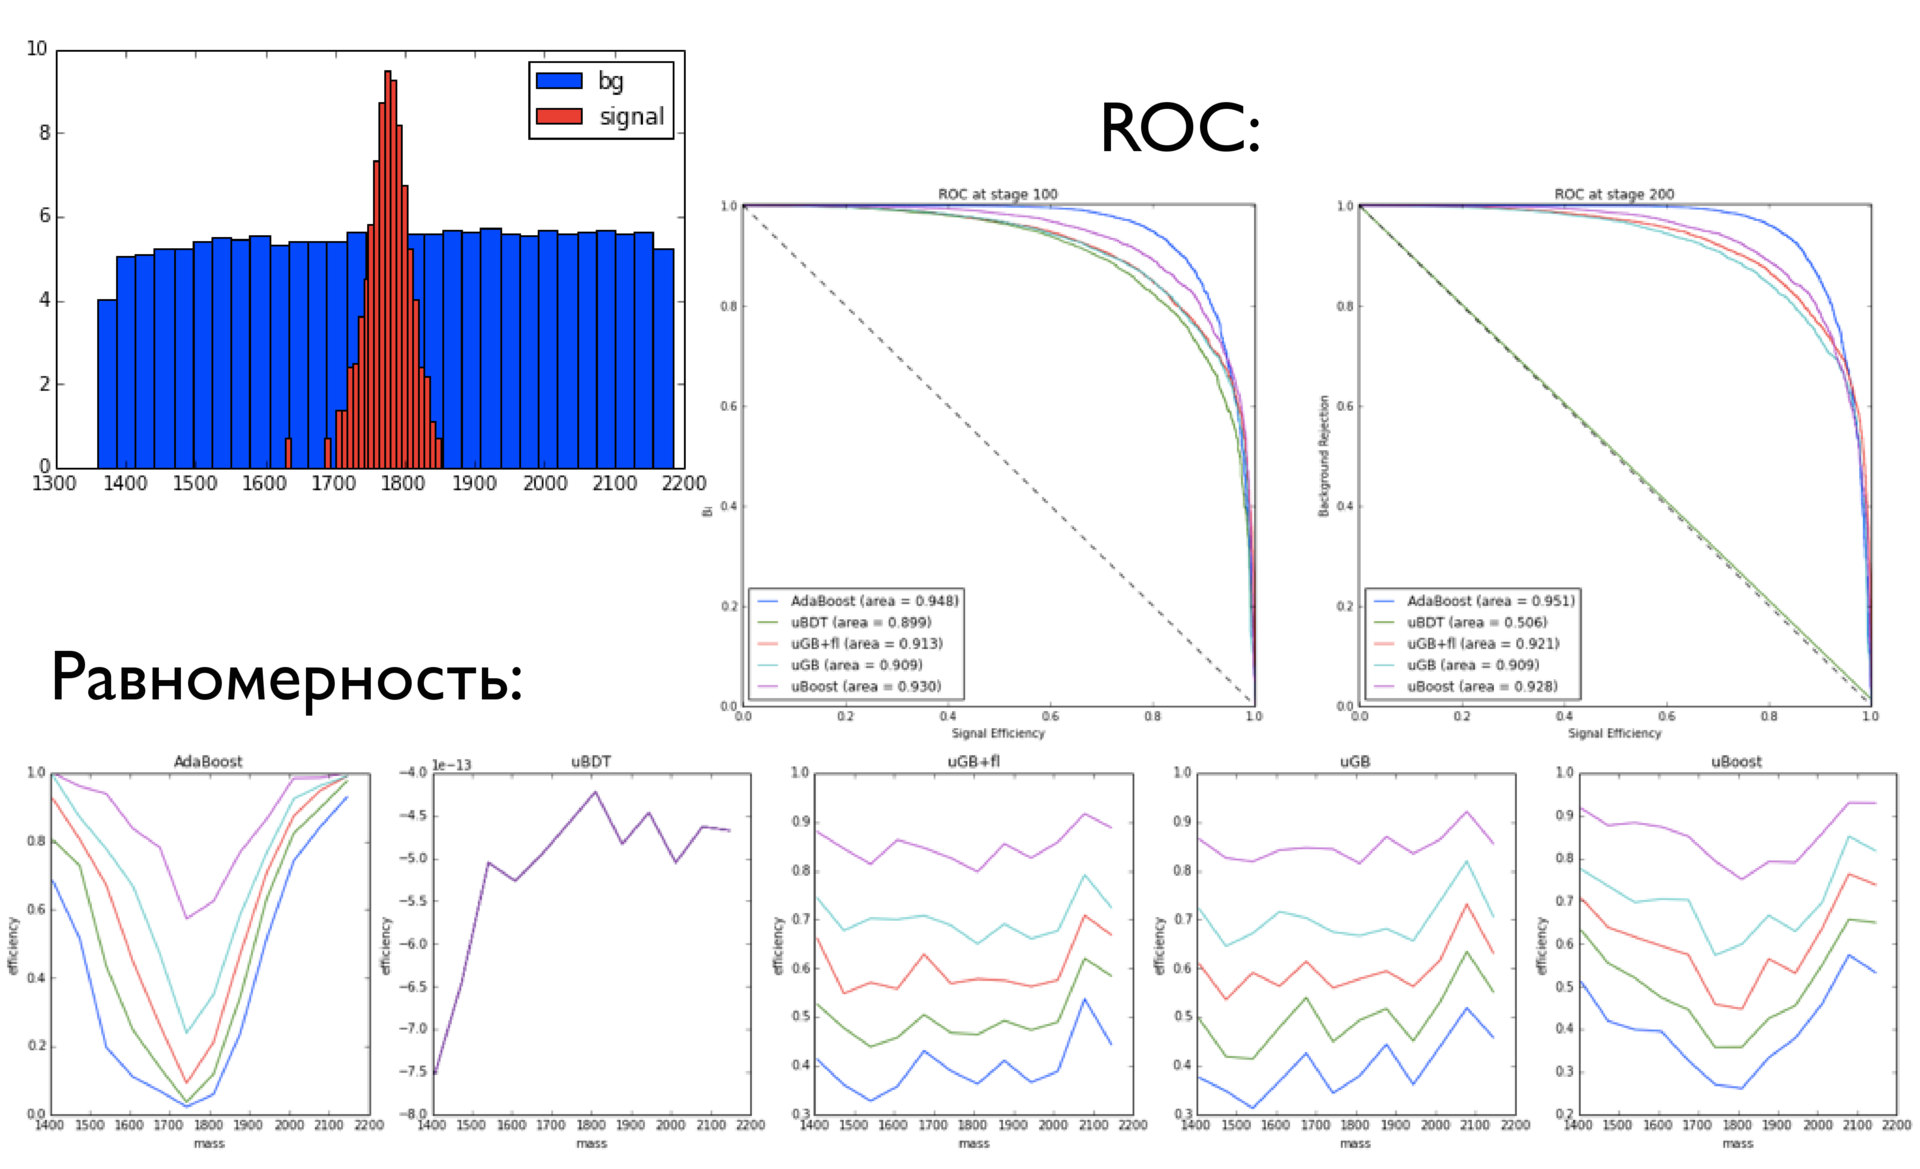
Here is a small example of a study at the interface of physics and machine learning:
Here there is an Analysis of events, a small subsample (10 5 ), from which we want to understand: only noise or noise + signal is present there. If there is a signal, then you need to figure out how much of this signal. When we try to train a classifier on working on simulated data, it is important that the distribution schedule of selected (over any threshold) signals in the case when the classifier is given only a background, has approximately the same shape as the background.
If it turns out that the distributions of the background before and after applying the classifier for some variable differ, then the classifier cannot be used for real analysis, since it is difficult to assess the systematic error introduced by it.
Conclusion
The services we currently provide to CERN are the Event Index and Event Filter. They can also be claimed in new experiments - in particular, in SHIP, which gives us a new direction of work. We have technologies that can provide a good platform for the development of research.
Now we can apply these technologies to solve our own problems, but we are interested in learning how to apply them somewhere else. This is one of the directions of the company. For students of the SAD on their profile, this trend may also seem interesting.
Source: https://habr.com/ru/post/230367/
All Articles