Lean Big Data on 6 Google services
Hello Habr! I want to tell you how we did our own Big Data.
Every startup wants to build something cheap, high-quality and flexible. Usually this does not happen, but we seem to have succeeded! Below is a description of our decision and a lot of my purely subjective opinion on this matter.
')
And yes, the secret is that 6 Google services are used and there is almost no written own code.
What was needed?
I work in a fun Singapore startup - Bubbly, which makes a voice social network. The trick is that you can use without a smartphone, quite a good old Nokia. The user calls to a special number and can listen to messages, record their messages, etc. All voice, do not even need to be able to read to use.
In Southeast Asia, we have tens of millions of users. But since it works through mobile operators, in other countries nobody knows about us. These users generate a huge amount of activity that they want to register and analyze in every possible way:
- Make a beautiful dashboard with key metrics updated online
- Monitor service work and errors
- Do A / B tests and analyze user behavior
- Make reports for our partners
- ...
In general, the tasks that are needed by everyone and always practically.
Why reinvent the wheel?
It would seem - why build something, if there are ready-made solutions? I was guided by such motives:
1. I do not want to use Mixpanel (sorry gays!)
- If there is no complete control over the data, then there is always a question to which someone else’s ready-made system does not answer. Yes, I know that there are Mixpanel export APIs and they allow a lot. But in fact, so many times already came across such situations. I want full control.
- A bunch of all the "hotelok" will have to be screwed into another proprietary product, which is not very convenient. For example, SMS alert to the chief of support if something is broken. Or special reports to third-party partners. And such features cannot be predicted in advance.
- It is really expensive! I know that many instead of all the data are loaded there only a random sample, in order to somehow reduce costs. But this is a very dubious happiness in itself.
2. If you want so much your “own” solution, then why not stir up Hadoop with all the stuffing?
- It is necessary to raise the server and configure everything. There are of course hosted Hadoop, where everything is already “configured”, but you still have to deal with these settings.
- Hadoop is only storage and querying. All the other features will have to do yourself.
MySQL for the task is clearly not suitable, because we have too much data for it.
Briefly how it works for us
- We upload all “events” from users from our servers to Google Big Query
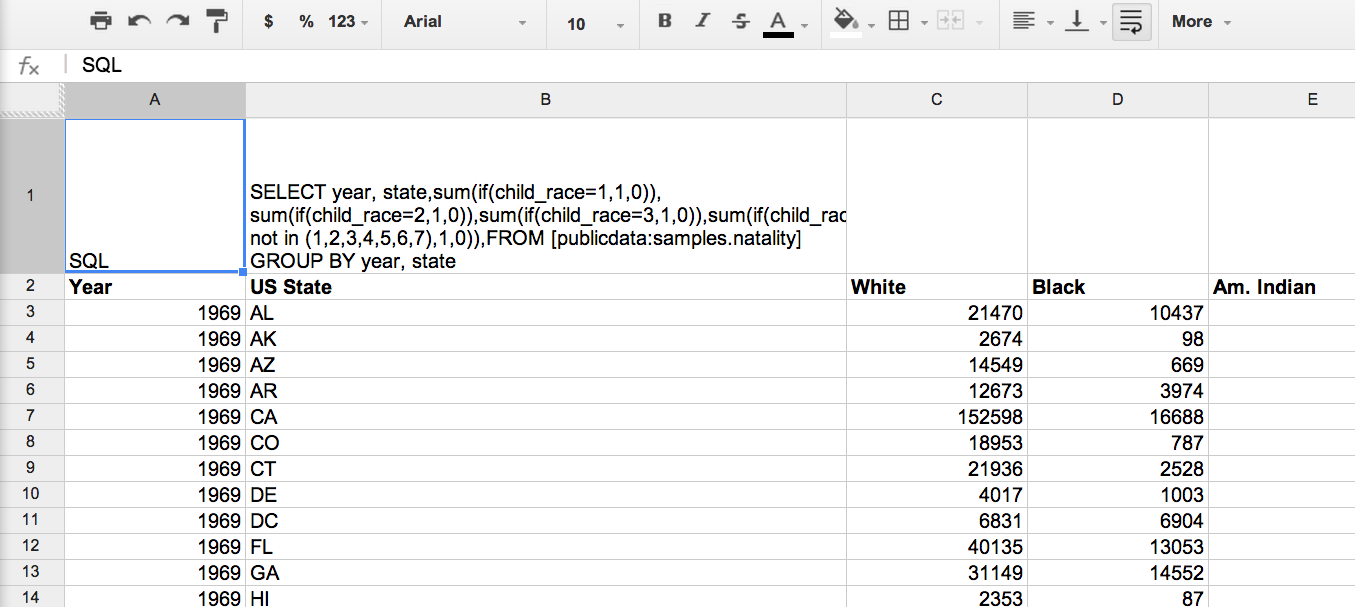
- We use Google Spreadsheets for Big Query queries and subsequent data processing. All logic sits in Spreadsheets and scripts tied to it.
- Next, visualize the data using Google Charts.
- We host these graphics on Google Drive
- In a single "Dash Board" these graphics are going to Google Sites
- Finally, Google Analytics is on top of Google Sites, which oversees the users of all this analytics.
The advantages of this approach (no, I don’t promote Google for money, which is a pity )
Big Query - Pros
- This database can store a huge amount of data. The issue of scalability is not worth it.
- It costs a penny compared to other solutions. I write about the expenses below separately.
- In fact, any request takes less than 20 seconds. This is very different from Hadoop, where the score is at best for minutes. For standard, defined once and for all requests, the difference seems small. But if you look at the data “in free flight” (ad hoc) or repair something by trial and error, then even small pauses tear the entire workflow and reduce the efficiency of the analyst’s work at times. And in life it turns out that only such tasks and doing all day. A very important advantage of Big Query.
- Small buns, such as the web-interface, in fact, help a lot.
Improvements:
I really wanted to make Big Query schemaless, just to add events to the system and not think about anything. Therefore, a piece of code was attached to the loader, which checks the current table schema in Big Query and compares it with what it wants to load. If there are new columns, they are added to the table via the Big Query API.
Google Spreadsheets - Pros
Better spreadsheets for data analysis is nothing. This is my axiom. For this task, Spreadsheets fits better than MS Excel (no matter how much I love it). The reasons are:
- Works with Big Query out of the box ( Goolge Tutorial )
- Everything lies in the cloud and scripts can update data on a schedule.
- Cross platform! It works equally well on PC and Mac.
- Already have a bunch of useful features - email, etc.
Improvements:
The script from the tutorial has been slightly modified. Now he checks every sheet in a spreadsheet. If “A1” is written in cell A1, it means that the query to Big Query lies in A2. The results of the query script will put on the same sheet.
This is necessary so that when using, do not touch the code at all. Created a new sheet, wrote a request, got the result.
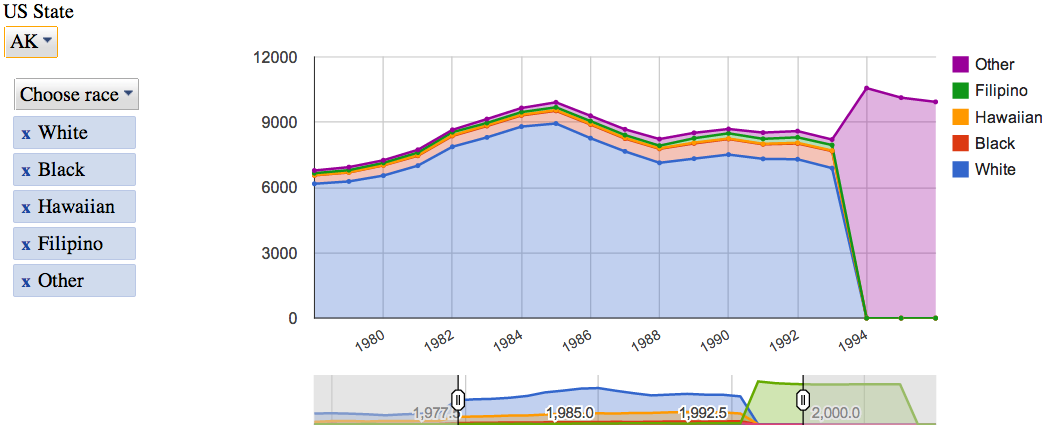
Google Charts - Pros
- There are a lot of visualization libraries, but there is a feeling that Google has become more reliable and functional (unless of course they write off Charts as a Reader).
- Works with Spreadsheets out of the box ( Google Tutorial )
- They bribed them with interactive controls that allow you to play quite deeply with the data even to business people who do not use either SQL or Excel.

Google Sites / Google Drive - Pros
- You can use Google's developed system of access rights. You cannot give read-olny access to Dropbox, but here you can.
- Google Sites have a wysiwyg editor that I personally really like.
- After the whole system was built on Google services, I decided to use them to the end of the principle.
Google Analytics
Recursion! Our Dash Board has about 30 users. Enough to analyze resource usage statistics. Google Sites, not surprisingly, are integrated with Google Analytics in a couple of clicks. Attendance of pages objectively shows which data is most interesting in order to improve the system in this direction.
About the cost of the decision
I believe that in any system the most expensive is the time required for development and man-days spent on development and support. In this sense, this solution is ideal, since its code is almost never written. The whole project was done by one person, in parallel with other tasks, and the first version was made in a month.
There are, of course, suspicions that the integration between the services of Google may break (in their tutorial it can be seen that this has already happened) and it will take support efforts. But I do not expect anything terrible.
As for direct costs, only Big Query costs money in the whole system. Data storage and data requests are paid for. But it's just a penny! We write 60 million events a day and never once more than 200 USD per month did not pay.
Important Add-in for Big Query
Big Query scans the entire table by default. If events for all the time stored in one place, the requests become slower and more expensive over time.
The most interesting is always the data for the last time, so we came to the monthly calculation of these tables. Every month, the events table is backed up on events_201401Jan, events_201402Feb, and so on.
To make it convenient to make such a structure, we expanded the SQL language a bit. Fortunately, everything is controlled by its own script from Spreadsheets, and it can parse and process our requests as needed. Added such commands:
- FROMDATASET dataset - queries all tables in a data set in turn. This is in case you need to request data for the entire period of time.
- FROMLAST table - queries the current table and the table for the last month. This is for queries that need data for the last 7 days, for example. So that at the beginning of the month the request returns the full 7 days, and not what is in the current month.
Future plans:
- To cut a script starting SQL. I want him to, apart from FROMLAST, be able to do all sorts of useful transformations like PIVOT, etc.
- Saw JavaScript for Google Charts. I want to ideally get rid of the need to touch the code at all. In order, like in Excel, pivot charts - to switch with one click the type of graphics, and which series on which axis, etc. But these are global plans.
- I want to experiment with nested data. We can sort all events from a separate user session into one record on the server. That is, events within the session (call in our case) will be the “children” of this session. In theory, this should simplify some confused queries.
How it all works can be seen on the example here .
I'd like to have knowledgeable people say their opinions. For this article and was written.
PS I ask for errors in the text and my anglicisms to write in a personal, I will correct everything.
PPS I'm not a programmer at all, so my code can be scary (but it works!). I will be glad to constructive criticism.
Source: https://habr.com/ru/post/230243/
All Articles