Master plan of the village based on Yandex api v2 or how to relate the coordinates of the picture and map
The purpose of our work is to:
- Get a map with the marks we need (the marks are unique and may be located in different places) .
- When pointing to a mark, we give out information about it (house number) .
- When you click on the mark to show an additional description (content) mark.
- The map has full scaling and navigation capabilities.
Sometimes you want to organize navigation on a certain part of the map, for example, on the terrain. Therefore, Yandex maps, user layers , and management of your maps come to our rescue. In many respects it may seem, but why describe all this if Yandex has a solution to this. Immediately I answer with Yandex, there is a function for this, but there is no solution for each task.
For work, I used:
- Yandex API
- jQuery - since it was in the main project.
- Software from Yandex "Preparing a Tile Layer"
- Picture from the designer, preferably not small (I was provided with 7987px at 3607px, this is quite enough)
- Notepad ++ and hands
')
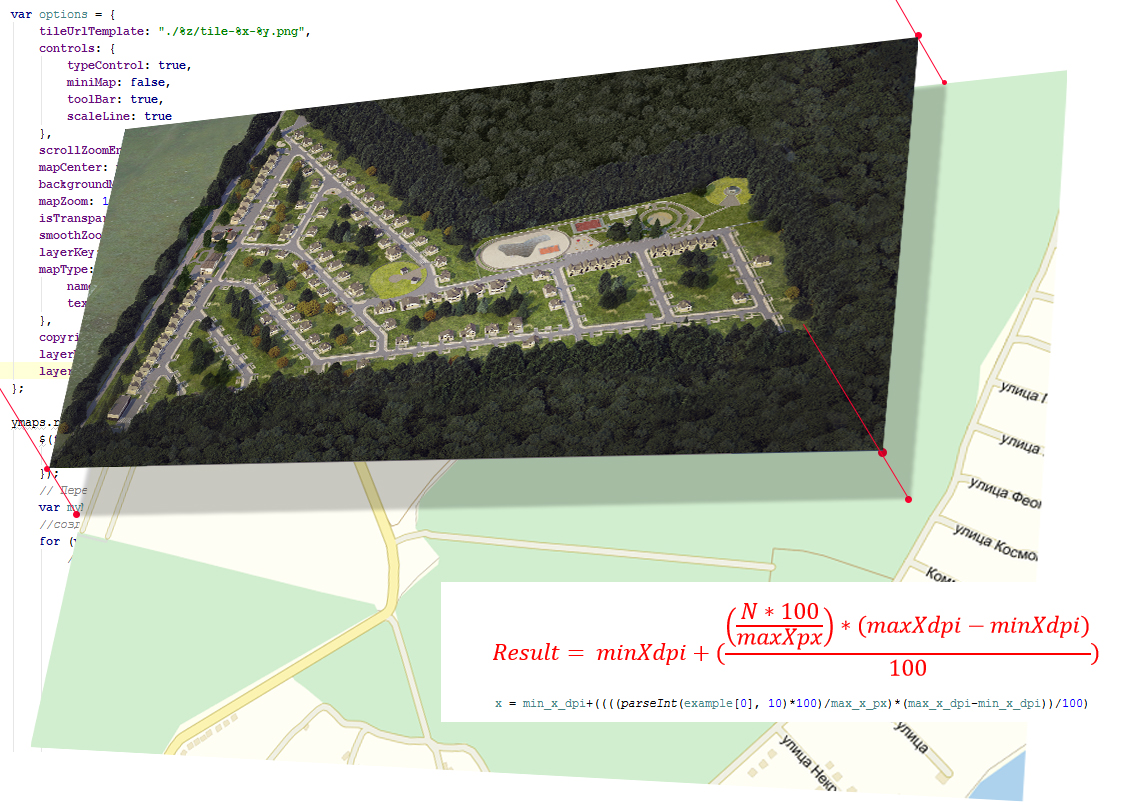
Immediately kind of what we got:

Let's start preparing the tiles:
We put dots at each extreme corner, and the corresponding coordinators named for them (I found a non-standard solution with this. I created a semi transparent picture and put it on the map). If the points somehow do not coincide in the proportions of the picture, there is a probability of distortion of the image ie. fit under the card - we do not need it !!!

After painful arrangements of points we save our tiles. In the end, you should get something like:
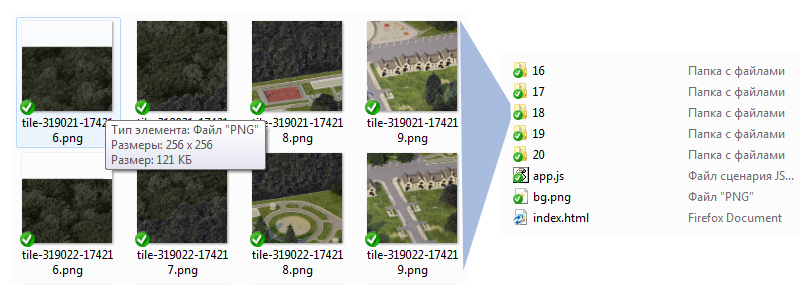
256x256 small cuts in the appropriate folders for the buzzer. The number of folders and their numbering depends on the number of zooming pictures.
Change the generated scripts in the generated file to:
<script type="text/javascript" src="http://code.jquery.com/jquery-1.11.0.min.js"></script> <script src="http://api-maps.yandex.ru/2.0/?load=package.standard,package.geoObjects&lang=ru-RU" type="text/javascript"></script> <script src="app.js" type="text/javascript"></script> In the inside of the body tag we leave only:
<div id="YMapsID"></div> <!-- --> <map id="ImageMapsCom" name="image-maps"> <a href="/catalog/projects/aleksandrovskij_21186_kvm3/" alt="" title=". 1a" data-maps="2042,239,2137,331" class="hause_items_shows" data-info="1310"> <div class="show-items-info"> <img src="/images/cms/data/catalog/12.jpg" alt=""><div class="description-house"> <p class="status"><span>:</span><span color="1716"></span></p><p class="plowad"><span>: </span>5,05</p><p class="stoimost"><span>: </span></p></div></div> </a> <a href="/catalog/projects/aleksandrovskij_21186_kvm3/" alt=" 265,29 .." title="" data-maps="1319,1237,1441,1339" class="hause_items_shows" data-info="1310"> <div class="show-items-info"> <img src="http://adveks.gowhiterabbit.ru/images/cms/data/content/minimarket.png"> </div> </a> <!-- . . . . --> </map> A little bit with an individual style card, connect our style:
#YMapsID { width: 100%; height: 100%; min-height: 600px; } #YMapsID > ymaps { background: url("bg.png") repeat scroll 0 0 rgba(0, 0, 0, 0); } #YMapsID .ymaps-copyrights-pane, #YMapsID .ymaps-controls-rightbottom { display: none; } #YMapsID.hause_items_shows{ display: none; } #YMapsID.show-items-info { background: none repeat scroll 0 0 rgba(253, 250, 243, 0.8); left: 0; padding: 15px; top: 0; width: 250px; z-index: 19; } Map Settings:
var options = { tileUrlTemplate: "./%z/tile-%x-%y.png", controls: { typeControl: true, miniMap: false, toolBar: true, scaleLine: true }, scrollZoomEnabled: true, mapCenter: new YMaps.GeoPoint( , ), backgroundMapType: YMaps.MapType.NONE, mapZoom: 17, isTransparent: true, smoothZooming: false, layerKey: "my#layer", mapType: { name: "", textColor: "#000000" }, copyright: "", layerMinZoom: 16, layerMaxZoom: 20 }; The function of getting melon from unloaded
The transition from the image navigation system (by pixels) to the map navigation system (degrees) is realized here. convert pixels to degrees.

var contentString = new Array(); function strat_masiv() { var clo_in=0; $('#ImageMapsCom .hause_items_shows').each(function (_index, _label) { var blocks = $(_label); contentString[clo_in] = new Array(); var bjects_alt = $(blocks).attr('alt'); var example = $(blocks).attr('data-maps').split(','); var max_x_dpi = 39.05776, // max_x_px = 7986, // min_x_dpi = 39.048469, // max_y_dpi = 51.74439, // max_y_px = 3606, // min_y_dpi = 51.747;// contentString[clo_in][0] = $(blocks).attr('title'); contentString[clo_in][1] = $(blocks).html(); // Y contentString[clo_in][2] = min_y_dpi+((((parseInt(example[1], 10)*100)/max_y_px)*(max_y_dpi-min_y_dpi))/100); // X contentString[clo_in][3] = min_x_dpi+((((parseInt(example[0], 10)*100)/max_x_px)*(max_x_dpi-min_x_dpi))/100); contentString[clo_in][4] = $(blocks).attr('href'); contentString[clo_in][5] = ''; // Y contentString[clo_in][6] = min_y_dpi+((((parseInt(example[3], 10)*100)/max_y_px)*(max_y_dpi-min_y_dpi))/100); // X contentString[clo_in][7] = min_x_dpi+((((parseInt(example[2], 10)*100)/max_x_px)*(max_x_dpi-min_x_dpi))/100); clo_in++ }); console.log('Y='+contentString[0][6]+' x='+contentString[0][7]); } ymaps.ready(function () { strat_masiv(); // TilerConverter . var myMap = (new TilerConverter(options)).getMap(); // for (var i = 0; i < contentString.length; i++) { contentString[i][5] = new ymaps.Rectangle([ [contentString[i][2],contentString[i][3]], [contentString[i][6],contentString[i][7]] ], { balloonContentHeader: contentString[i][0], balloonContent: contentString[i][1], balloonContentFooter: "<a href='" + contentString[i][4] + "'></a>", hintContent: contentString[i][0] }, { fillColor: '#7df9ff33', fillOpacity: 0.5, strokeColor: '#0000FF', strokeOpacity: 0.5, strokeWidth: 2, borderRadius: 6 }); myMap.geoObjects.add(contentString[i][5]); }; }); After all the settings, according to your desire, in order not to see these small squares around the houses we put:
fillOpacity: 0, strokeOpacity: 0, Full script file
Link to the repository!
Source: https://habr.com/ru/post/230215/
All Articles