Syndrome of a step and a cut of attendance of Habr
The last couple of weeks I closely follow the work of Habr with the help of Habr-analytics and decided to collect my observations into the article. Today we will discuss: when and in what quantity Habr is read; what is step syndrome; how to get data about your articles and how you can analyze them.
(An online version is available here and if the site falls, here )
The most interesting facts from the graph:
One day we will have our own iconosquare with intelligent text analysis and benders!
')
Since the 1st of July, over one hundred articles have been analyzed and virtually all of them have “step syndrome”. For example, consider a graph of views of one of the articles:
(An interactive version opens by clicking)
The most characteristic behavior is as follows: up to 24 hours, views grow close to a polynomial of 2 to 3 degrees of the number of hours, while the nature of growth changes during the exit to the main one and becomes similar to exponential. However, after quitting the main one, the moment of saturation comes and the number of views and additions to favorites goes to a constant. This is the saturation of views. the output of the views is actually a constant in time, and I dubbed the step syndrome .

The main hypothesis is related to the fact that after the article leaves the main one, it no longer has any distribution methods. This can be seen in the saturation of the number of reposts over time.
(interactive versions of views , favorites , reposts , data are also available there)
A necessary condition for the "vitality" of the article is to continue its distribution on the network after leaving the main one. Those. or they continue to transmit the article in the form of a word of mouth, for example, the author has similar experience with the article “ How to lie with the help of statistics ”. You can track the distribution through Yandex blogs, for example through such a request [link: habrahabr.ru/post/217545] or for new articles via Habra analytics . Either the article goes to the "Best of the week \ month \ for all time" and gets views at the expense of the main audience of Habr.
One of the new features is the import of these articles and pulse:
You can download them by clicking on the graph and then clicking on “import data”, you can see an example of the imported ones here.HabraData pulse.csv c git repository (by the way, this is a repository in which I collect all interesting data associated with the site, and here HabraAnalyticsTool console utilities to analyze such data).
The data is available (according to the plotly platform) permament, but at the time of tracking the article is limited to 52 hours (unfortunately, if you increase the time to a week, the pool of articles grows and the rendering system begins to fall with an authorization error after a large number of requests).
Due to the fact that the visualization has switched to the plotly platform, now you can embed the pulse and article monitors in html with this design.
If you suddenly want to make a visualization of your articles (or pulses) on a blog, simply add the resulting link (or automatically distribute the analytics website and remove the link from the page).
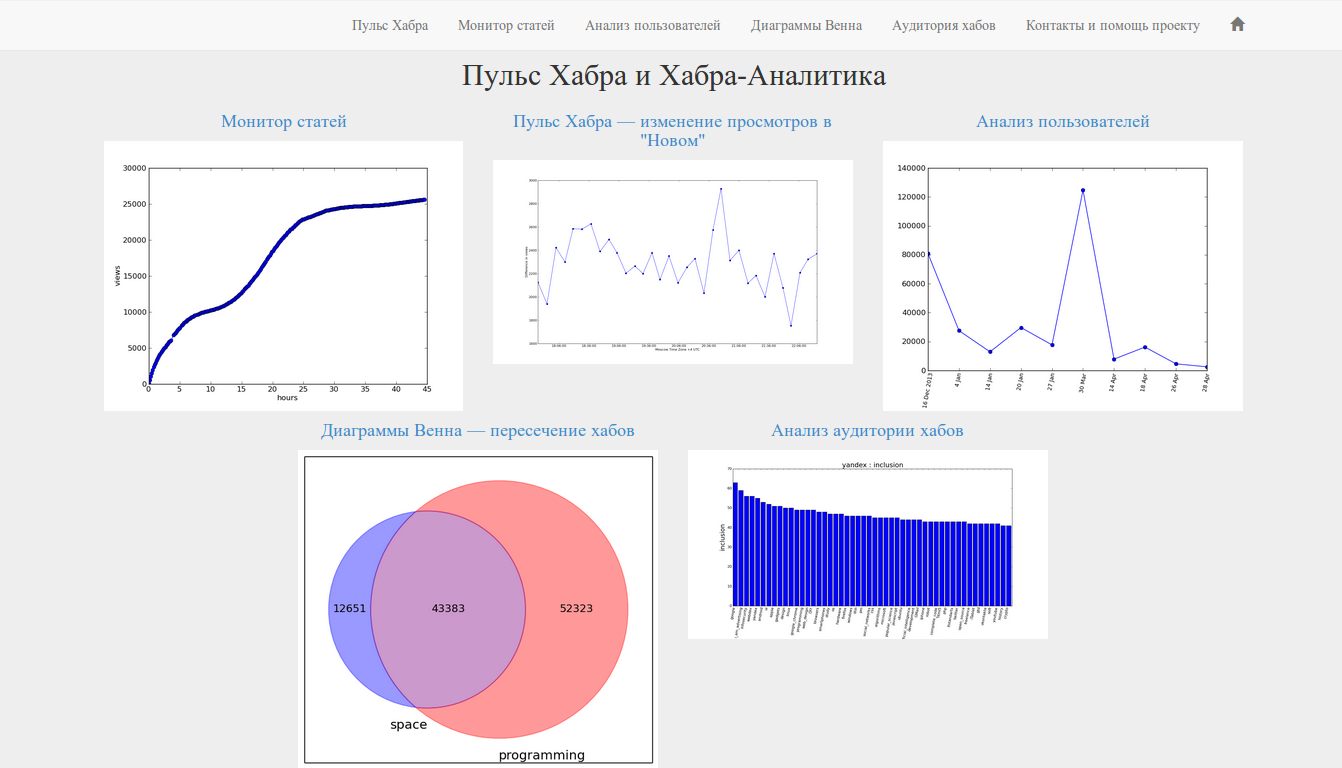
As previously available online: analysis of user articles ("user history"), the intersection of hubs and audience analysis.
The author slowly but surely finishes the previous requests and is always happy to hear ideas (in fact, through any communication channels, but the comments below and the mail work best), what else to implement and improve.
- Attendance statistics
- Article Views: Stair Syndrome
- Data publicity
- Hotlink Habra-graphs
- All tools online
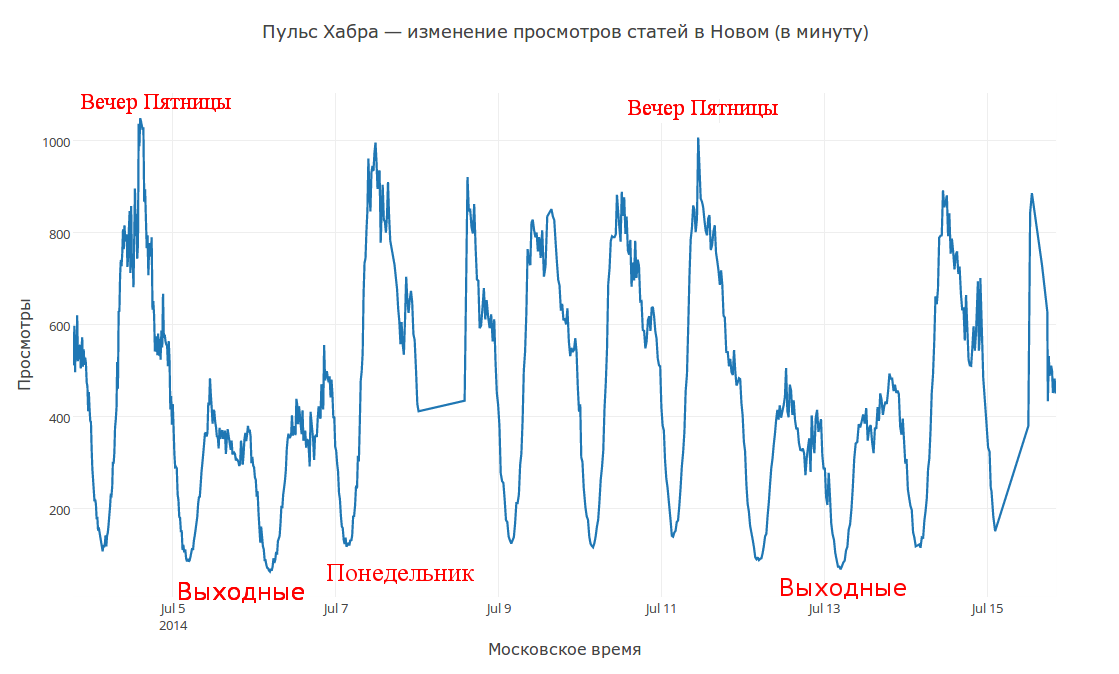
Attendance statistics
(An online version is available here and if the site falls, here )
The most interesting facts from the graph:
- On weekends, Habr is read by an average of two to three times fewer people than on weekdays
- At night (in Moscow) the minimum activity is about 10 times less than the next morning.
- Peaks of activity suspiciously coincide with the working hours in Moscow
- On weekdays, the main surge of activity in the morning before lunch, and on Friday and by the end of the working day
- Monday activity is comparable with the rest of the working days i. no one super peak activity on monday morning
One day we will have our own iconosquare with intelligent text analysis and benders!
')
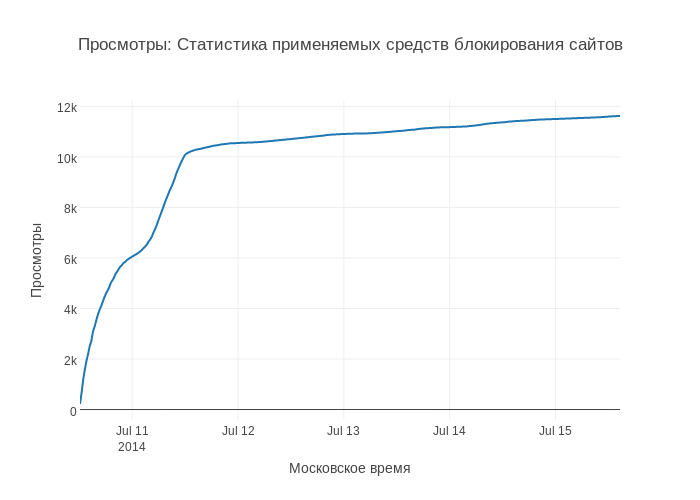
Article Views: Stair Syndrome
Since the 1st of July, over one hundred articles have been analyzed and virtually all of them have “step syndrome”. For example, consider a graph of views of one of the articles:
(An interactive version opens by clicking)
The most characteristic behavior is as follows: up to 24 hours, views grow close to a polynomial of 2 to 3 degrees of the number of hours, while the nature of growth changes during the exit to the main one and becomes similar to exponential. However, after quitting the main one, the moment of saturation comes and the number of views and additions to favorites goes to a constant. This is the saturation of views. the output of the views is actually a constant in time, and I dubbed the step syndrome .
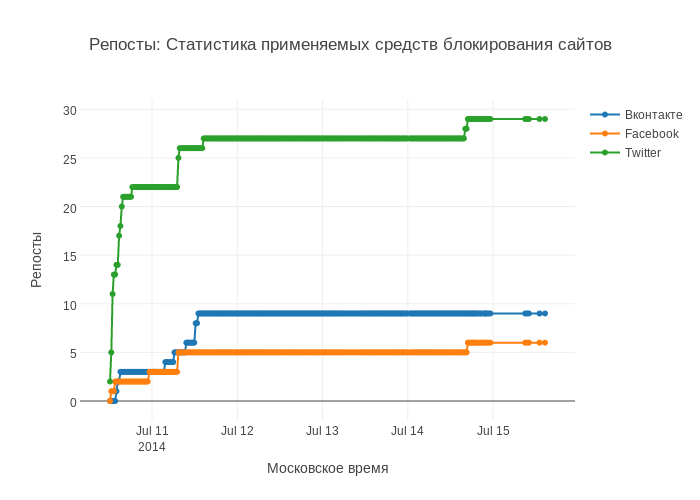
The main hypothesis is related to the fact that after the article leaves the main one, it no longer has any distribution methods. This can be seen in the saturation of the number of reposts over time.
(interactive versions of views , favorites , reposts , data are also available there)
A necessary condition for the "vitality" of the article is to continue its distribution on the network after leaving the main one. Those. or they continue to transmit the article in the form of a word of mouth, for example, the author has similar experience with the article “ How to lie with the help of statistics ”. You can track the distribution through Yandex blogs, for example through such a request [link: habrahabr.ru/post/217545] or for new articles via Habra analytics . Either the article goes to the "Best of the week \ month \ for all time" and gets views at the expense of the main audience of Habr.
Data publicity
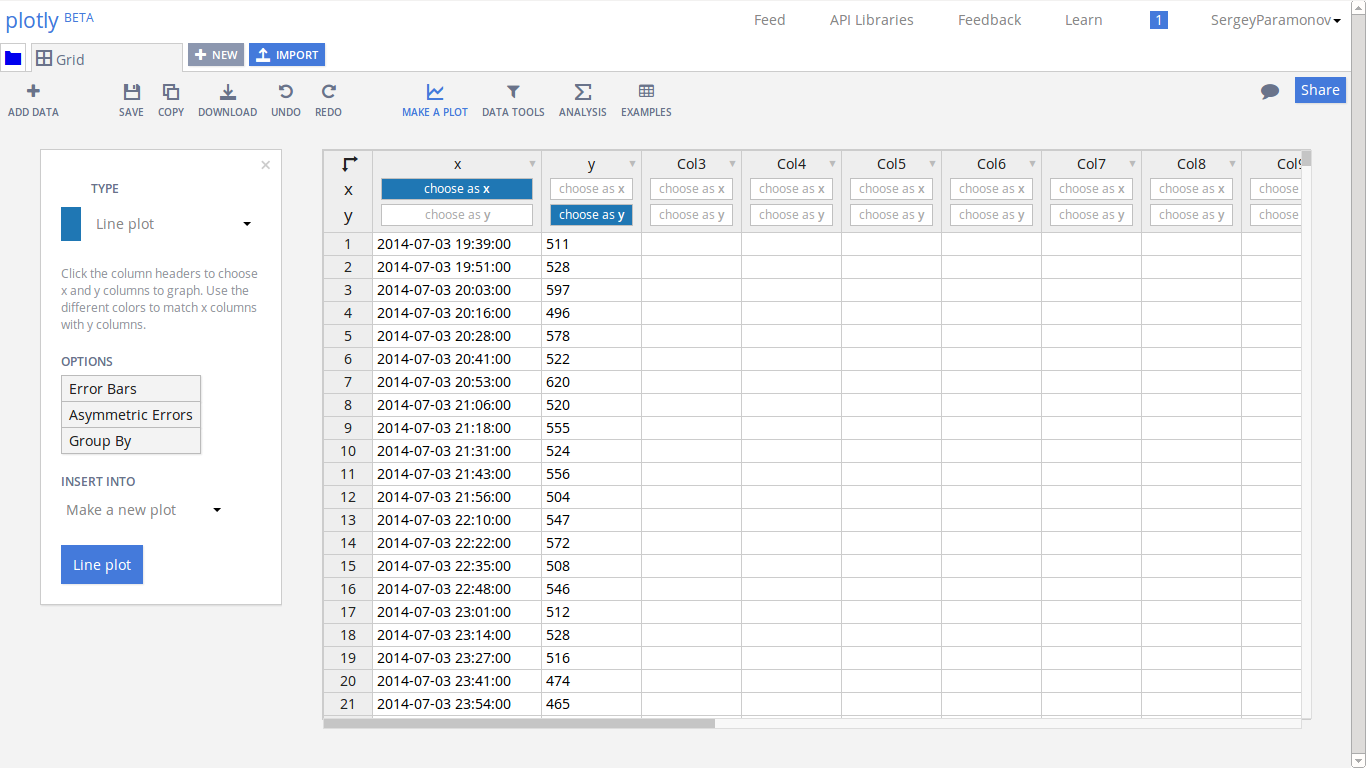
One of the new features is the import of these articles and pulse:
You can download them by clicking on the graph and then clicking on “import data”, you can see an example of the imported ones here.HabraData pulse.csv c git repository (by the way, this is a repository in which I collect all interesting data associated with the site, and here HabraAnalyticsTool console utilities to analyze such data).
The data is available (according to the plotly platform) permament, but at the time of tracking the article is limited to 52 hours (unfortunately, if you increase the time to a week, the pool of articles grows and the rendering system begins to fall with an authorization error after a large number of requests).
Hotlink Habra-graphs
Due to the fact that the visualization has switched to the plotly platform, now you can embed the pulse and article monitors in html with this design.
<div class="container"> <div class="jumbotron"> <div class="row-fluid"> <iframe class="container well span12" id="pulse_stream" src="https://plot.ly/~SergeyParamonov/1/" seamless="seamless" height="600px" scrolling="no" ></iframe> </div> </div> </div> If you suddenly want to make a visualization of your articles (or pulses) on a blog, simply add the resulting link (or automatically distribute the analytics website and remove the link from the page).
All tools online
As previously available online: analysis of user articles ("user history"), the intersection of hubs and audience analysis.
The author slowly but surely finishes the previous requests and is always happy to hear ideas (in fact, through any communication channels, but the comments below and the mail work best), what else to implement and improve.
Source: https://habr.com/ru/post/230003/
All Articles