Get Zabbix statistics from Kyocera devices

Hi Habr!
From such a seemingly uncomplicated Kyocera device, I wanted to receive various statistics on the use of the printer and scanner. It would seem that everything is simple: we take SNMP and get, but ...
SNMP
Making sure that our device gives something via SNMP, I went to Google to find the MIB for our device. However, it was possible to find information only about the fact that it does not exist. Kyocera does not want to share such information, for some reason. Naturally, the idea of a slightly routine search for the necessary values on your own comes to mind. The algorithm is not the most difficult - snmpwalk, print, snmpwalk, diff.
Here is what was found:
user@host:~# snmpwalk -v 2c -c public 192.168.101.239iso.3.6.1.2.1.43.10.2.1.4.1.1 = Counter32: 242And here is the first oddity: the value is somewhat different from that specified in the web panel of the device itself (and in the printer menu):
')
Search in SNMP-issue of numbers, at least somewhat similar to what is written in the web panel of the device did not give the slightest result. Attempts to catch a change in a counter, such as a scan, have failed. Nothing has changed. There was a slight suspicion that the necessary data through SNMP is simply not available.
But if there are values, it means someone needs it! It turns out that Kyocera has its own software for monitoring and controlling their devices - KYOCERA Net Viewer.
Fill out an application form, enter an email, get an email with a one-time link ... You should know why such difficulties, but oh well.
The program is quite simple and shows us the same numbers as in the web muzzle. And if she gets them like that, then we can.
The first to come to my mind was the Wireshark combine, so I will use it.
And here weird number two: in addition to sharing SNMP traffic, we also have HTTP here!

HTTP
Further investigation leads us to the fact that the printer and software communicate XML'kami through SOAP.
The principle is very simple: POST request a special XML is sent to the printer containing the request. In our case, the request is “ALL_COUNTER”, that is, we want to get all the counters. The printer may, in response, send meter readings or the message “DEEP_SLEEP_NOW_ERROR”, which is understandable from without translation. Waking up the printer is somehow not at all necessary. He already woke up from our request, just send the request again and get the XML with counters.
All values are specified as <parameter> number </ parameter>. We make a small parser and get a script ( mirror ), giving us the necessary numbers in a convenient form.
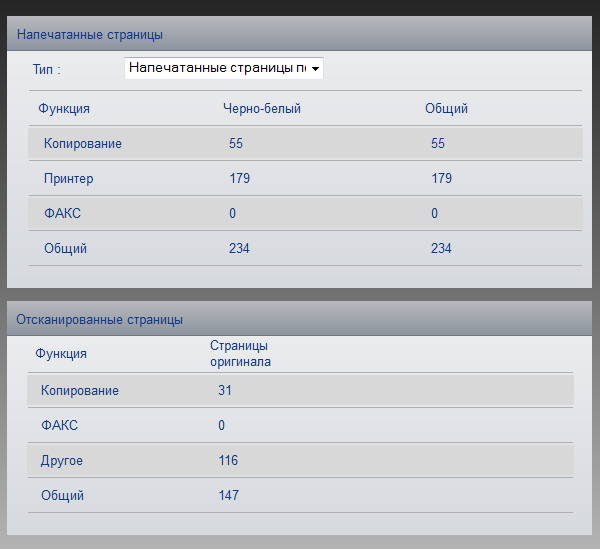
For M2535dn I was interested in the following counters:
- accounting_print_black_and_white_copy_counter : Number of b / w pages printed using a copier
- accounting_print_black_and_white_printer_counter : Number of b / w pages printed using a printer
- accounting_print_combine_none_counter : General counter of printed pages
- accounting_scan_copy_counter : Number of pages scanned using a copier
- accounting_scan_other_counter : Number of other scanned pages (on a USB flash drive, network, etc.)
- device_life_counter : (?) Total count of printed pages over the entire life of the device
The difference in metering of accounting_scan_copy_counter and accounting_print_black_and_white_copy_counter is simple: 2 copies of one original were made. One page went to the copier from the scanner, and the printer from the copier printed two. In addition to these counters, you can get a lot more interesting things: the number of printed A4, a5, letter and other pages, the number of pages printed using duplex, copied in 2in1 and 4in1 modes, for color devices you can get the number of color-and-color and color copies separately . The device_life_counter counter gives the printer to us via SNMP, but this value is not displayed either in the web interface or in special software. I did not quite understand the meaning of this parameter. Yesterday it was different from the total counter by 3, today it is already 8. I am waiting for your ideas in the comments.
Zabbix
Now you need to connect it to our monitoring in Zabbix. We will use external verification. The script must be placed in the ExternalScripts directory, given the right to execute and slightly increase the timeout for running scripts, by default it is 3s:
user@host:~# cat /etc/zabbix/zabbix_server.conf | grep Timeout | grep -v ^#Timeout=10It now remains to figure out a new template and fill it with data elements:
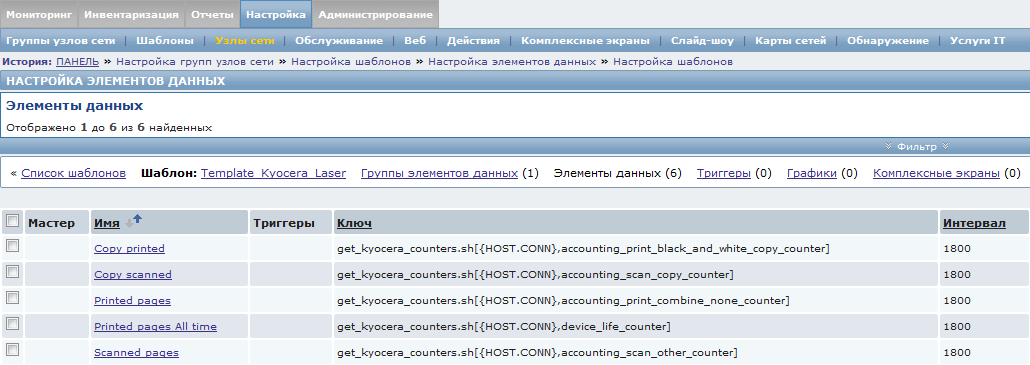
Template for Zabbix (Settings → Templates → Import): tyts and mirror .
A small note: you should not set too small a check interval, this can lead to a decrease in the performance of the monitoring system as a whole. We apply to the nodes of the network, customize graphs, reports, and further on the mood.
That's all, all good Friday and great weekend!
PS Not all of us are perfect and please report any errors in the text to the LAN.
Source: https://habr.com/ru/post/229539/
All Articles