We distinguish the bus from the car by GPS tracks

Photo by Artem Svetlov
To build a plausible corkboard, the Mail.Ru Map project processes a large amount of information on the GPS tracks of the participants in the movement. Often, very little is known about the source of the tracks, including for security reasons. But to determine the true situation on the roads, I always wanted to know more. At least in order to understand how the speed of the source machine corresponds to the speed of the rest of the stream. This article focuses on the method of selection of route vehicles (buses, trolley buses, minibuses and trams) from the raw stream of GPS data.
Why is it important
Route vehicles most often do not travel at the speed of the rest of the stream. Of course, they can be indicators of the transport situation, but with some specificity:- Buses and trolley buses, as a rule, have their own timetable with a large number of stops on the route. This means that on a free road, the bus will drive a deliberately slower flow and often stop for a short time. At rush hour, when buses run at intervals of 7-10 minutes, they can send a sufficient amount of information about the decrease in the flow rate in the area of the stop.
- Thanks to the dedicated lanes, the bus can go faster than traffic in a traffic jam.
- Drivers of minibuses often go against all sorts of rules.
Separately, I would like to describe the trams, which almost always drive along dedicated lanes, passing along or in the center of the streets with car traffic. Therefore, the track of the tram is practically indistinguishable from the track of the car.
Initial data
I will make a reservation in advance that the purpose of the article is not to compare which satellite navigation system is better. Virtually all client devices now have chips that accept data from all available systems and provide generalized coordinates. To save space here and in the future I will call the track obtained using the satellite navigation system, the GPS track.First, let's define what a GPS track is. A GPS track is a sequence of device position coordinates over time. Unfortunately, the only thing we know about each device sending a track is its unique identification number. These are stringent privacy requirements.
')
All tracks have a different nature and come from different suppliers. In this article I will consider the case when the device is rigidly fixed on the vehicle and sends data at regular intervals. This simplification will allow me not to consider the situation when the device recording the track was in the hands of someone, then this someone got on the bus and drove a couple of stops on it.
The purpose of the analysis will be the selection from the general list of tracks of those that most of the time move along the same sequences of streets - routes.
Solution Method
First of all, the original continuous track should be divided into single trips, which we will compare with each other. As described earlier, physically there is a GPS tracker on the machines, which sends its coordinates every few seconds. Most often, the tracker works when the car is turned on, but there are devices that work around the clock. Therefore, the travel divider will take a long period of time in which the speed was always 0 or the device did not send data.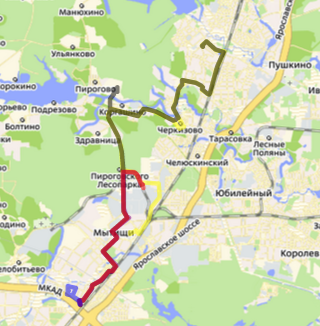
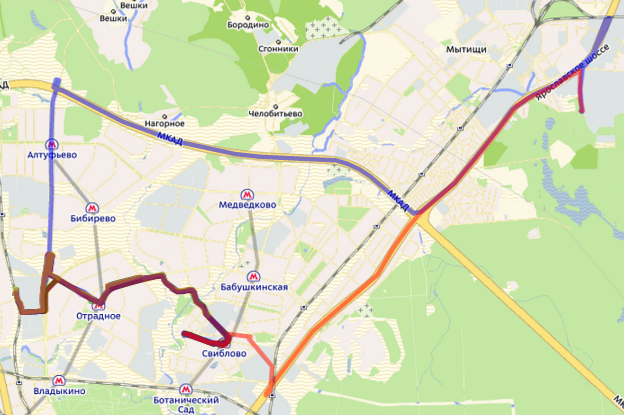
Example of dividing a track into trips
Now for each vehicle we have a set of tracks, trips, which it made for a certain period of time. Among them are both real trips, and loosely coupled tracks caused by coordinate determination errors, movements within the closed area of the enterprise, “pereparkovki” and the like garbage. In order not to waste computational resources on it, I filter all tracks with a length of less than 400 meters, a number of points less than 10 and a geographic spread of less than 200 meters for a bounding box. This will avoid star tracks, which are formed due to large random errors of the GPS receiver.
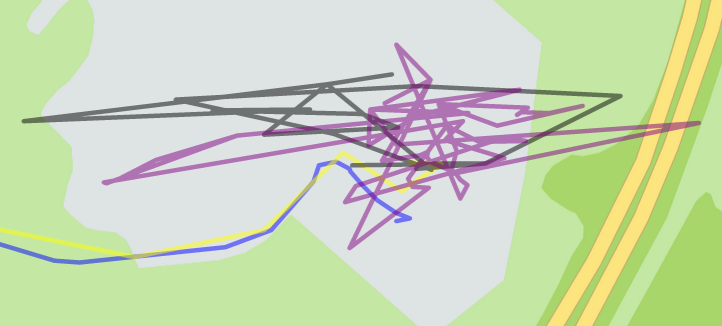
Typical star tracks
The next task is to compare these tracks with each other and determine whether they are on the same route. To do this, the first thing I will bring all the GPS-tracks in a single form, tying them to our road graph. I wrote about the work of the binder in my previous post . Since then, it has undergone some changes, but the basic principles remain the same. At the exit from the binder, I get a track in the form of a chain of pairs (id edges of the graph, direction (forward or reverse)). At this stage, you can filter the tracks that do not fall on our road graph. It can be tracks from airplanes / helicopters, containers in the seas, combine harvesters. Or just from cars that drove to places where we for one reason or another do not have a road graph. I want to note that only those tracks are filtered here that do not correspond to the road graph at all. If the car came out of a parking lot where we don’t have a road graph, then drove along the roads for a long time, where it tied to the road graph and drove to the parking lot (where there is no road graph again), then this track will be counted.
The resulting chains are much easier to compare with each other. I looked through various comparison metrics and ended up on the Levenshtein metric . The alphabet in this case is a set of all possible edge-direction pairs. Thus, I was able to numerically determine the “similarity” of tracks as the number of edits to the edges of the route (add / delete / replace edges) in order to get another route from one route.
The next step is to group the tracks by route. This issue is solved by data clustering algorithms. Since I already have a one-dimensional metric of “similarity” of tracks, I took the simplest algorithm for hierarchical data clustering: the dendrogram . The tree is built on the basis of the minimum Levenshtein distance and then its branches are split, differing by more than n edges. It is imperative to calculate the optimal n equal to 16.
As a result, I get a set of clusters that store similar routes in themselves. With this information, it is already possible to conclude that the vehicle is traveling along a predetermined route. I had ideas to use different n depending on the number of edges in the route, but this improvement does not increase the quality of the search, and I decided to leave a fixed n.
Initially there were thoughts that most vehicles have 2 routes (from the final to the final) in both directions. But, as practice has shown, sometimes the route can be circular, or consist of several parts.
Route vehicles do not always move along the route. There are trips to the garage, gas station, etc.
Tracks from the route. Near view
Thus, most vehicles have at least one cluster in which they accumulate trips, and several official: one-time or more rare routes (to the garage, before refueling, and so on). On the basis of the obtained data, one more hypothesis can be tested: since we have vehicle routes and route comparison metrics, we can distinguish vehicles operating on the same route. To do this, just take the individual clusters of different vehicles and compare them with each other (especially since the comparison function of the clusters is already in the implementation of the hierarchical tree).

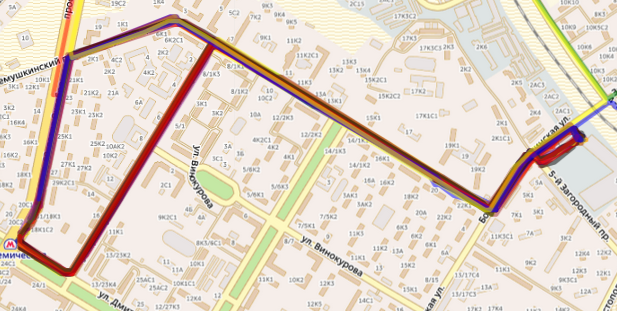
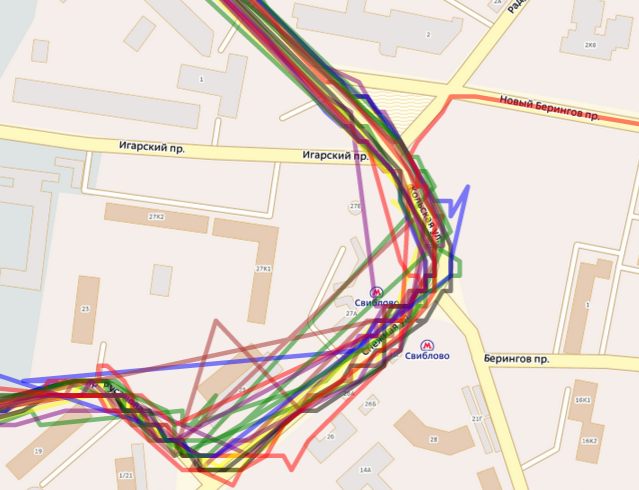
Two different buses moving along the same routes.
Thus, I can clarify the route and group vehicles into parks.
findings
Anonymous GPS data carries a lot of information. By correctly analyzing this data, you can learn a lot of additional information about the vehicle that created the track, as well as about the city and its roads. Therefore, the scope of these tracks should not be limited to obtaining information about traffic jams, and the information itself can benefit not only motorists, but also utilities and town-planning services. At the same time for the processing of these tracks do not necessarily know the exact data about the machine that creates them. All the necessary information about the vehicle can tell the statistics of its movements. At the same time, GPS tracks are an inaccurate tool for determining information. To obtain the result, it is necessary to examine a large amount of data, which places high demands on the processing infrastructure.Source: https://habr.com/ru/post/228289/
All Articles