Zabbix 2.2: Monitoring the temperature of the Windows processor of the machine

A little about yourself and the work environment
When I first met zabbix, I was overwhelmed with emotions and fantasies about monitoring everything in the world. The first was the idea of preventing physical malfunctions by tracking key indicators of iron, such as temperature or voltage, because it seems to me very logical and cost-effective to change the thermal grease or begin to pick up the replacement of tired equipment before the user reports her premature death or terrible brakes.I work as an engineer in a company of two people, we serve a dozen of municipal and commercial enterprises with a fleet of computers up to 100 pieces of which 99% of windows are machines. We are engaged in everything from laying a network to setting up information systems. There is a lot of work and sometimes I really want to make my life a little easier and now, at the next such moment, I ran into the zabbix monitoring system.
Zabbix monitoring system is really very powerful and flexible, but unfortunately, not all aspects of tracking are available from standard box templates. Thus, my fantasy crashed against the wall of the lack of regular temperature monitoring tools in Windows.
The search process on the Internet has put me in front of the fact that iron temperatures can not be pulled out without third-party tools. When searching for these very means, I came across a popular utility SpeedFan , which can collect data on device temperature, fan speed, voltages. But getting from her ready-to-process data without installing another utility is not possible. Plus, they are not open source and require activation of the SNMP protocol component. Conclusion: it is possible to try on windows server without IMPI, but as a variant of mass distribution in the network it is not suitable. Further search brought on programs hwmonitor and aida64 - monsters, large and paid.
Openhardwaremonitor
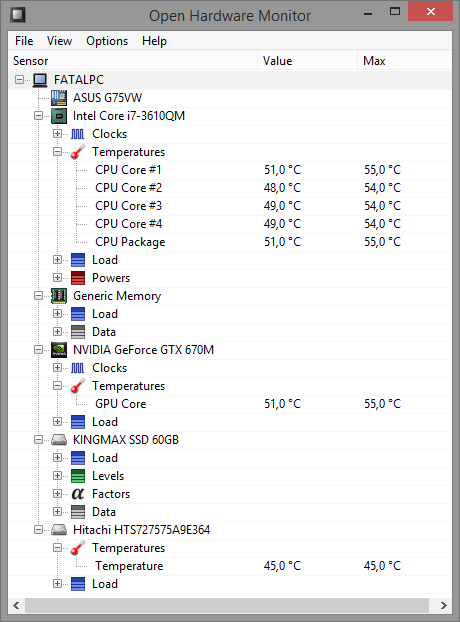
Already almost desperate, caught on a short message on the English-language forum zabbix. They recommended a small open source utility OpenHardwareMonitor - it has a graphical interface and can read the temperature of devices from sensors. And most importantly, its author, at the request of the workers, wrote a console version (latest version 10/28/2012), outputting information in a form ready for processing.
GUI version :
')
Console version :
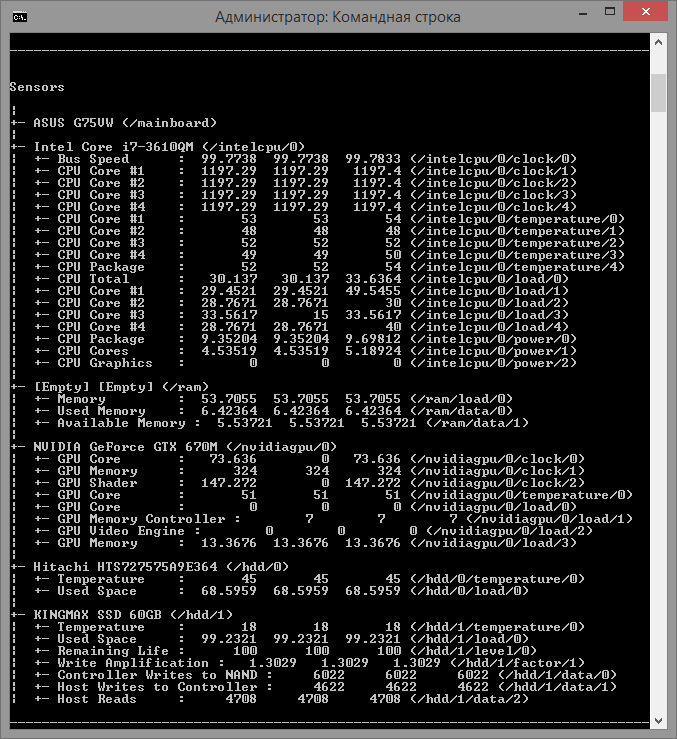
The console version consists of two files, an exe executable file and a dll library.
- OpenHardwareMonitorReport.exe
- OpenHardwareMonitorLib.dll
Where we get the data, we now need to adjust the delivery of Zabbix indicator values to the server.
Server Tuning
First, add a new item to the server for the host:
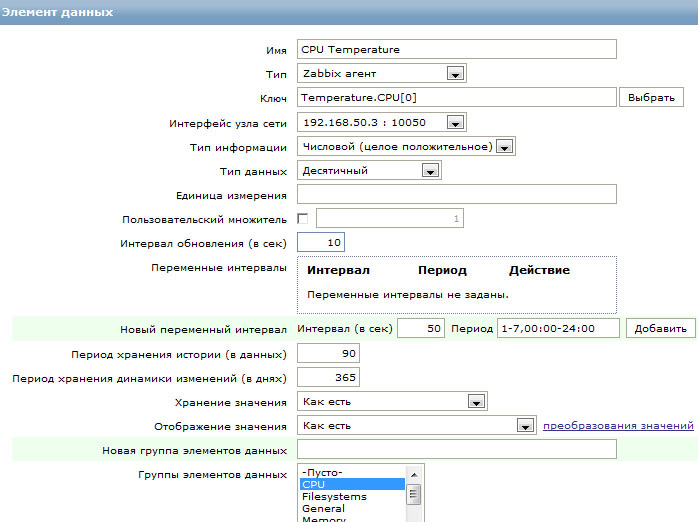
Let's call it: CPU Temperature. (CPU temperature)
Type: Zabbix Agent
Key: Temperature.CPU [0]. (The name does not matter, the main thing is that the agent config matches).
Host interface: ip \ dns. (The node that will be monitored).
Type of information: Numeric (integer positive)
Data type: Decimal
Update interval (in seconds): 3600. (In the screenshot it costs 10 seconds, for a temporary check).
On the server finished, go to the client configuration.
Client setup
We will send non-standard data via the Zabbix agent in the config (zabbix_agentd.conf) which provides for the so-called user parameters - UserParameters of the form:
UserParameter=[*], The command through which we get the value is processed on the client side. Zabbix server will receive a key with the value assigned to it. The article means that you already have an agent installed as a service and are friends with the server.
At the end of the config file agent add:
UserParameter=Temperature.CPU[*], C:\OpenHardwareMonitor\CPUTemperature.bat CPUTemperature.bat - a batch file written by me that pulls out of OpenHardwareMonitor, the average temperature across the processor. In the program, this line is called CPU Package.
In C: \ OpenHardwareMonitor there are 3 files:
- OpenHardwareMonitorReport.exe
- OpenHardwareMonitorLib.dll
- CPUTemperature.bat
Contents CPUTemperature.bat
Updated: New code from respected cawaleb
For intel processors, the version with find instead of findstr and a regular expression is also valid:
Here is my old code
Disabled on crutches.
I appeal to the habra-community for help in transforming this horror into normal program code without crutches from text files.
Nevertheless, the script copes with its task.
@echo off del /s C:\OpenHardwareMonitor\*.txt >nul 2>null call start /B /wait C:\OpenHardwareMonitor\OpenHardwareMonitorReport.exe >> C:\OpenHardwareMonitor\OpenHardwareMonitorReport.txt find "CPU Package :" C:\OpenHardwareMonitor\OpenHardwareMonitorReport.txt | find "temperature" >>C:\OpenHardwareMonitor\Result.txt for /f "tokens=7 delims= " %%i in (C:\OpenHardwareMonitor\Result.txt) do echo %%i >> C:\OpenHardwareMonitor\temp.txt TYPE C:\OpenHardwareMonitor\temp.txt I appeal to the habra-community for help in transforming this horror into normal program code without crutches from text files.
Nevertheless, the script copes with its task.
Updated: New code from respected cawaleb
@echo off for /F "usebackq tokens=7-10" %%a in (`C:\OpenHardwareMonitor\OpenHardwareMonitorReport.exe`) do echo %%b %%c %%d| findstr .*lpc.*\/temperature\/0>nul && set temper=%%a echo %temper% For intel processors, the version with find instead of findstr and a regular expression is also valid:
@echo off for /F "usebackq tokens=7-10" %%a in (`C:\OpenHardwareMonitor\OpenHardwareMonitorReport.exe`) do echo %%b %%c %%d| find "/intelcpu/0/temperature/0">nul && set temper=%%a echo %temper% The script returns the value as a decimal number.
After this, change the config file and place all the files and scripts, restart the zabbix agent service.
Start getting values on the server:
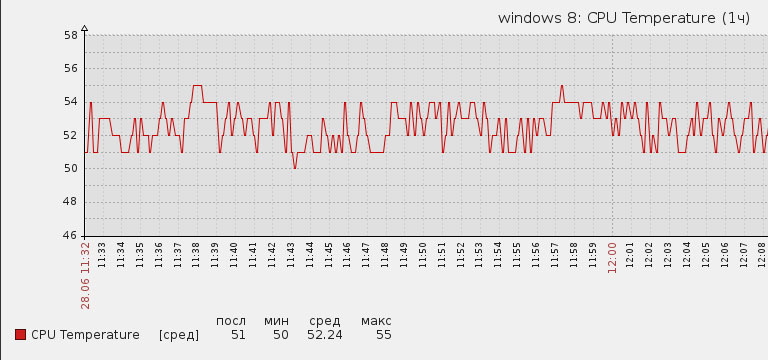
Conclusion
Solved the problem of extracting the temperature of the CPU. According to the same scheme, you can get the temperature of the GPU. But there are still acute issues related to determining the speed of the fans, voltage at the power supply, as well as whether there is a way to check the state of the north and south bridges.
Update: Added code for CPUTemperature.bat proposed by the distinguished Cawaleb . Do not forget to thank him for having responded to help!
Source: https://habr.com/ru/post/228095/
All Articles