SSD + raid0 - not so simple
Introduction
Colleagues from the neighboring department ( UCDN ) addressed a rather interesting and unexpected problem: when testing raid0 on a large number of SSDs, the performance changed in just such a sad way:
X axis - the number of disks in the array, Y axis - megabytes per second.
I began to study the problem. The initial diagnosis was simple - a hardware raid did not cope with a large number of SSDs and rested on its own performance ceiling.
After the hardware raid was thrown out and HBA was put in its place, and the disks were assembled into raid0 using linux-raid (it is often called 'mdadm' by the command line utility name), the situation improved. But it did not pass completely - the numbers increased, but they were still lower than the calculated ones. In this case, the key parameter was not IOPS, but multi-threaded linear recording (that is, large pieces of data written to random places).
')
The situation for me was unusual - I never chased the net bandwidth raids. IOPS are our everything. And here - it is necessary many-sided in a second and more.
Hellish graphics
I began by defining the baseline, that is, the performance of a single disk. I did it, rather, to clear my conscience.
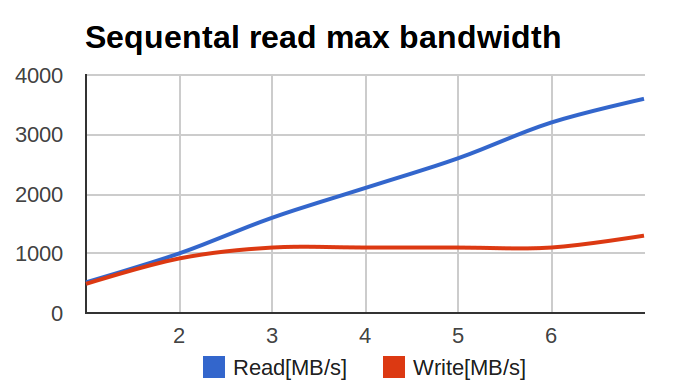
Here is a linear reading schedule with a single SSD.
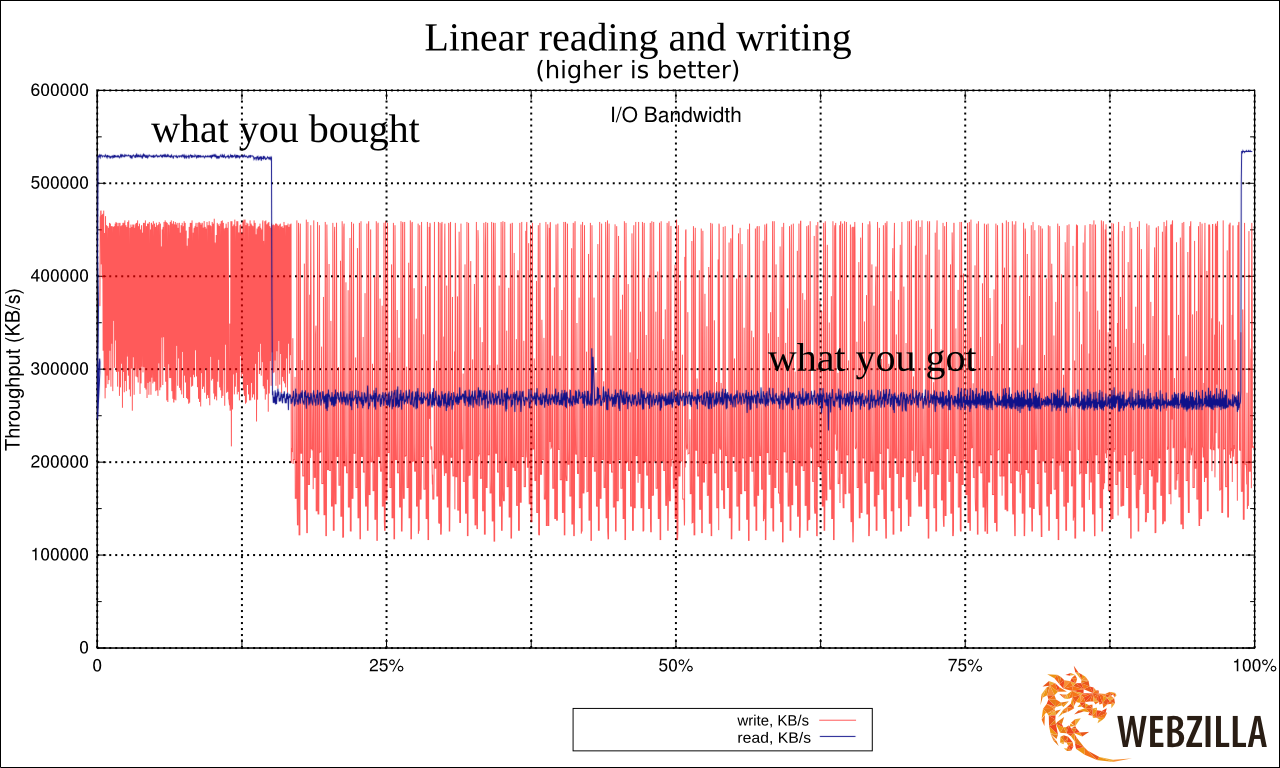
Seeing the result, I really hoisted. Because it very much resembled the tricks that manufacturers of cheap USB flash drives go to. They place the fast memory in the areas where the FAT (tables) are located in FAT32 (the file system) and slower in the data storage area. This allows a slight gain in performance when working with small operations with metadata, while assuming that users who copy large files are first ready to wait, and secondly the operations themselves will occur in large blocks. Learn more about this heartbreaking phenomenon: lwn.net/Articles/428584
I was sure that I had found the cause and the root of all the problems and had already prepared a stinging message (see the captions in the picture) explaining what a dull, poor-quality equipment of the “fertilizer” class turned out to be on the test, and many other words that are better not to repeat.
Although I was embarrassed by the version of the kernel on the stand - 3.2. According to my previous experience, knowing the regrettable features of LSI that change everything in the drivers (mpt2sas) from version to version, literally everything, I thought, “what if”?
A little background. mpt2sas - LSI driver for HBA. He lives an incredibly stormy life, starting from version v00.100.11.15 through version 01.100.0x.00, reaching as much as version 16.100.00.00 (I wonder what the number “100” means?). During this time, the driver distinguished itself by rearranging the drive letter names when updating the minor kernel version, which differs from the BIOS-BIOS disk ordering, crashes on the “unexpected” LUN configurations, on the backplane timeout, on the unexpected number of drives, logging errors in dmesg with infinite loop speed the kernel itself (de facto, this is the equivalent of a system hangup), and similar gay things.
Updated, run the test. And this "suddenly" happened. This is how the same chart looks at 3.14. But I barely rejected innocent SSD's.

After the disk performance stabilized, a second test was conducted: independent tests were run on all disks in parallel. The goal was simple - to check if there is a bottleneck somewhere on the bus or HBA. The performance of the disks turned out to be quite decent, there was no “plug” on the bus. The main task was solved. However, the performance schedule was still different. Not much, but obviously with a hint of worse than linear recording speed.
Why does the recording behave this way as the number of disks in the array increases? The graph (at the beginning of the article) very much resembled the graph of the performance of multi-threaded applications as the number of threads grow, to which programmers and Intels usually show when they talk about problems with thread locks ...
During the test, something strange was observed in the blktop : some of the disks were loaded into the ceiling, some were almost idle. Moreover, those who show low performance are loaded into the ceiling, and the “fast” disks are idle. Moreover, disks sometimes change places - that is, before a 100% loaded disk suddenly shows a higher speed and lower loading, and vice versa, a disk that was loaded by 50% suddenly turns out to be loaded by 100% and at the same time shows a lower speed. Why?
And then it hit me.
raid0 depends on latency worst of disks
If we write a lot of data, the recording usually goes in large chunks. These pieces are divided into smaller pieces by the raid0 driver, which writes them to all disks from raid0 at the same time. Due to this, we get an N-fold increase in performance. (In raid0 on N disks).
But let's look at the record in more detail ...
Suppose we have a raid using chunk'i and the size of 512k. In the array of 8 disks. The application wants to write a lot of data, and we write on raid in 4MB chunks.
Now watch your hands:
- raid0 receives a write request, divides the data into 8 pieces of 512kb each
- raid0 sends (in parallel) 8 requests for 8 devices by writing 512kb (each its own)
- raid0 is waiting for confirmation from all 8 devices to complete the recording
- raid0 responds to the “written” application (that is, it returns control from the write () call)
Imagine now that the disks had a recording in such a time (in milliseconds):
| Disk 1 | Disk 2 | Disk 3 | Disk 4 | Disk 5 | Disk 6 | Disk 7 | Disk 8 |
| 4.1 | 2.2 | 1.9 | 1.4 | 1.0 | 9.7 | 5.4 | 8.6 |
Question: how long will it take to write a 4Mb block to this array? Answer: in 9.7 ms. Question: What will be the recycling of disk number 4 at this time? Answer: about 10%. And the disk number 6? 100%. Note, for example, I chose the most extreme values from the log of operations, but with a smaller discrepancy, the problem will remain. Compare the reading and writing schedule (I give the same picture again):
See how uneven writing is in comparison with reading?
The latency SSD drives are very uneven. It is connected with their internal device (when a block of large size is recorded at a time, if necessary, by moving and transferring data from place to place). The larger this block, the stronger the latency peaks (i.e., momentary dips in performance). Regular magnetic disks have completely different graphics - they resemble a flat line with almost no deviations. In the case of linear sequential IO, this line is high, in the case of constant random IO - always low, but the key one - constantly. Latency in hard drives is predictable, latency in SSD is not. Note that all drives have this property. The most expensive latency is shifted (either very quickly or very, very quickly) - but the discrepancy still remains.
With such latency fluctuations, the performance of an SSD is, on average, excellent, but at certain points in time, the recording may take slightly more than at other times. For the tested disks, it fell at this moment to shameful values of about 50 Mb / s (which is lower than the linear recording in modern HDDs by a factor of two).
When device requests go stacked and independent, it does not affect. Well, yes, one request was executed quickly, the other slowly, on average, everything is fine.
But if the recording depends on all the drives in the array? In this case, any "braked" disc slows down the entire operation. As a result, the more disks in the array, the greater the likelihood that at least one disk will work slowly. The more disks, the larger the performance curve of their sum in raid0 begins to approach the sum of the performance of their minima (and not the average values, as we would like).
Here is a graph of real performance versus number of disks. Pink line - predictions based on average disk performance, blue line - actual results.

In the case of 7 discs, the differences were about 10%.
A simple mathematical simulation (with data on the latency of a real disk for a situation of multiple disks in an array) made it possible to predict that as the number of disks increases, degradation can go up to 20-25%.
Unlike replacing the HBA or the driver version, in this case nothing could have been changed significantly, and the information was simply taken into account.
What is better - HDD or SSD?
I will say right away: the worst expectation from SSD is better than the constant from HDD (if it sounded too difficult: SSD is better than HDD).
Another thing is that an array of 20-30 HDD - this is normal. 30 SSD in raid0 will cause salivation in geeks and an attack of hepatic colic in the finance department. That is, many HDDs are usually compared to several SSDs. If we normalize the numbers by IOPS (ohoho), that is, we get the same parrots from the HDD as SSDs, then the numbers will suddenly, by others - an array of HDDs will significantly overtake the array of several SSDs by recording speed.
Another thing is that a large array of HDDs is already another kind of extreme, and surprises await there because of the overall use of the bus, the performance of the HBA, and the behavior of the backplanes.
And raid1 / 5/6?
It is easy to understand that for all these arrays the problem of waiting for the “slowest” is preserved, and even slightly intensified (that is, the problem occurs with a smaller block size and lower load intensity).
Conclusion
Admin: I do not like LSI. If any discrepancies are detected in the operation of disks with the participation of LSI in the system, debugging should be started by comparing the behavior of different versions of the mpt2sas driver. This is the case when a version change can affect performance and stability in the most dramatic way.
Academic: When planning for high-load systems using SSD in raid0, it should be borne in mind that the more SSD in the array, the stronger the effect of uneven latency. As the number of devices grows in raid0, device performance begins to strive to multiply the number of devices by the minimum disk performance (and not the average, as one would expect).
Recommendations: in the case of this type of load, you should try to choose devices with the smallest variation in latency on the record, if possible use devices with a larger capacity (to reduce the number of devices).
Special attention should be paid to configurations in which part or all of the disks are connected over the network with an uneven delay, such a configuration will cause much greater difficulties and degradation than local disks.
Source: https://habr.com/ru/post/227927/
All Articles