How do we with the help of mathematical statistics measure the quality of data in Yandeks.Gorode
Flying in the plane Petka and
Vasily Ivanovich, Vasily Ivanovich shouts:
- Petka, devices!
Petka replies:
- Two hundred!
Vasily Ivanovich:
- And what is "two hundred"?
Petka:
- And what about the "devices"?
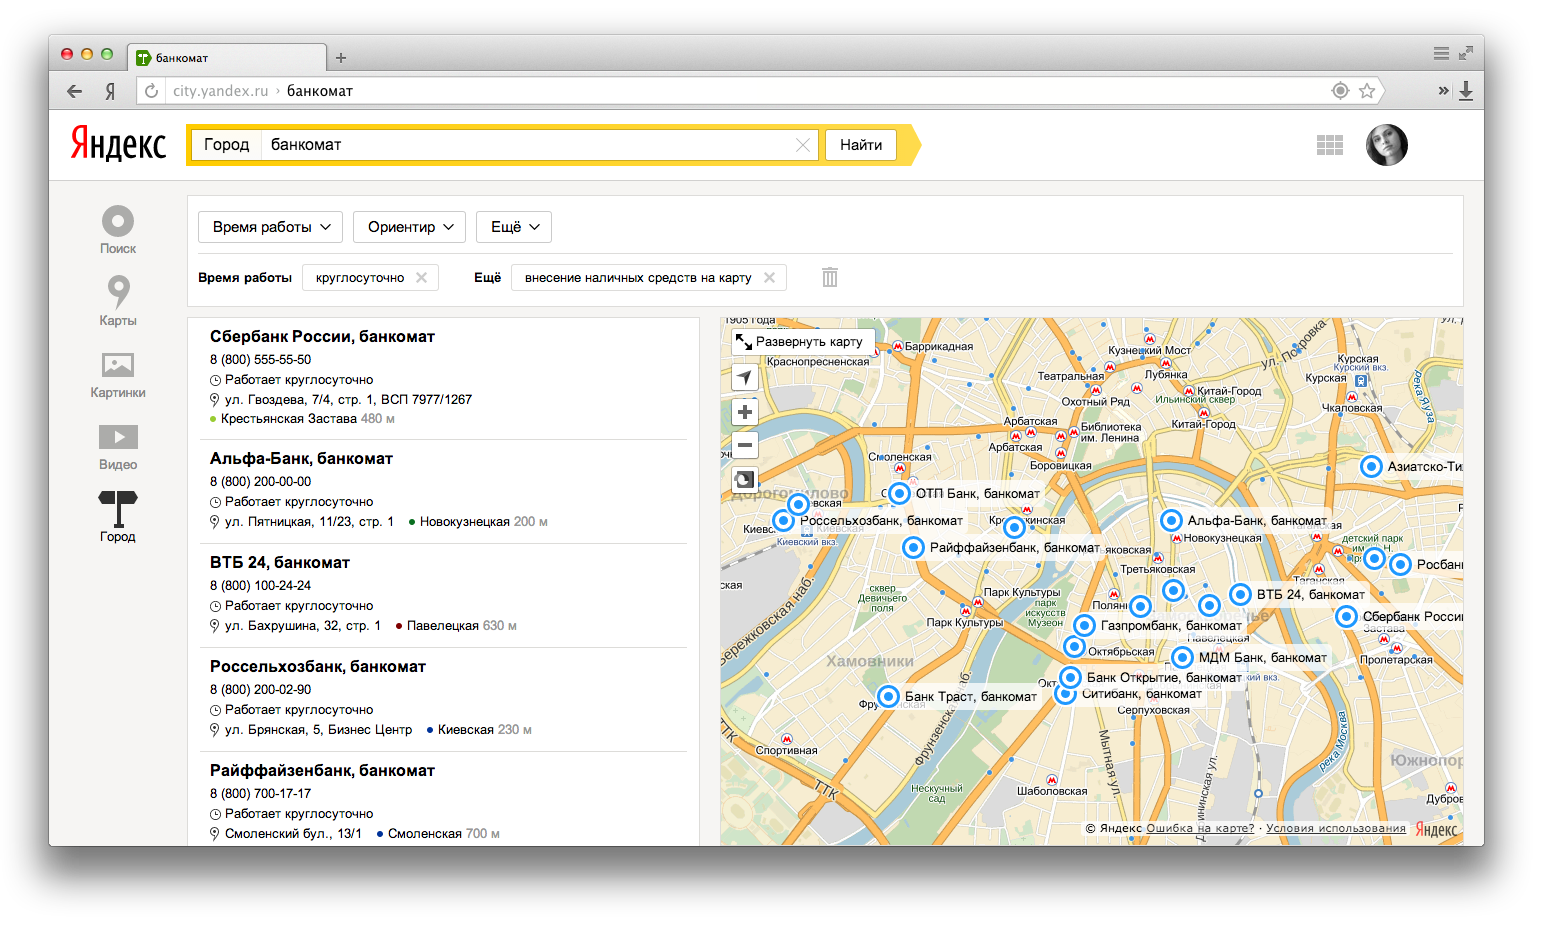
Today our new service, Yandex.City , is out of beta. It appeared as a logical continuation of the Yandex. Reference Book, which was the only source of knowledge about organizations for all our services. Its data is used in the J.Gorod application itself, on Yandex.Maps, in snippets on the search results page, for plotting routes in Maps and Navigator, determining the number in Yandex.Kite, choosing places of departure and arrival in Taxi. It was possible to find places and organizations on many of our sites, but it’s not very convenient to choose there.
We realized that users need a separate service for this. But to understand and do is not the same thing. In this post I want to talk about how we chose metrics in order to measure what happens, what unobvious discoveries have been waiting for us along the way, and in general why it is not easy to assess the quality of data across Russia or even individual cities.
If you have your own business, and if you are a hired manager, it is very important for you to be able to measure business performance. How do you understand that everything works well or badly? How to check that changes led to improvement? What will you base on when making decisions? All this requires metrics - quantitative characteristics of the state of the system.
')

The site search service on Yandex has a long history, and several teams had a hand in its creation. It grows from the project adresa.yandex.ru. Then Yandex integrated the “Yellow Pages” business into it - this is how the Directory appeared. About a year ago, the service team was greatly updated. And he began to turn into Yandex.City. I am in charge of the data production service in this team and today I will tell you about the metrics we have and how they help us make the best base of organizations in Russia.
How we chose metrics
In fact, once upon a time we lived without them at all. The fact that we were able to develop some sort of evaluation system, which we began to focus on, was in itself a great achievement for the whole team. At the next stage, we began to think about whether we have good metrics.
One of our basic indicators was the number of well-known service organizations (POIs). But on closer examination, this metric was quite meaningless. It is certainly convenient and useful for operational management, because it is easy to read and understandable to everyone. But we are making a product for users, and their happiness was not reflected in it.
Judge for yourself, did the user become better at what we knew 50K organizations, and 60K organizations began to know? Maybe. And if we still do not know the 24-hour pharmacy nearest the house or the nearest ATM of the bank you need?
But if we have chosen for ourselves the metrics of the number of organizations, then before answering a man’s question, we need to clarify one important point. And whether to consider the organization this ATM? And the Rospechat booth? And a public toilet? And the automatic kiosk for the sale of tickets on the subway or train?
It seems that summarizing the user's needs, the product manager can answer these questions. But there are many products and each has his own manager with his own data requirements. How to bring them into a single and not contradictory order, given that each customer can not know all the details about the base?
Realizing that you do not need to wait for someone to answer for me, I wrote a consolidated definition of the organization and put it in a public place. At the bottom he added: “Arguments to change this document should be sent to the next list of people.” This made it possible to start work in parallel with endless discussions on how to live correctly.
As we have already discussed above, the “total number of known organizations” metric is not the best, because it does not help us understand how well we solve the user's tasks. And to do this is our main goal.
Let's see how a set of metrics can describe our project. Quite obvious metrics come to mind:
- The above-mentioned number of organizations - both absolute and in comparison with the main competitors (including in certain categories).
- The number / proportion of irrelevant responses that were caused because the organization was not in the database. Convenient metric, but difficult to measure, especially in the scale of our country.
- Accuracy - the proportion of organizations with the correct data among all organizations available in the system.
- Completeness - the proportion of organizations known to Yandex among all organizations in the real world.
And we chose the last two metrics as those that best reflect the quality of the system and the complexity of measurement that suits us.
How we considered metrics
It seems that life has improved: we have defined metrics, regularly measured them, thought through measures to improve them. Live and be happy. Inside the company, we are very willing to discuss metrics in terms of “accuracy should not be lower than X” or “completeness should be not lower than Y”. It seemed to everybody what precision is - and, of course, it should be as high as possible. It is not very interesting what we consider an organization, what we consider a mistake, affecting accuracy, and so on.
But when we analyzed how we actually measure accuracy, it turned out that different parties often understand this as slightly different. And it would be possible to save many hours spent on lively meetings, if it immediately became clear - we speak different languages and therefore we can not agree. Our data is used by different Yandex services, and each service has its own requirements for accuracy. But an amazing story: at the same time, they simply require “data with an accuracy not lower than X”. The big surprise for everyone was that everyone understands accuracy very differently.
As a result, we described several accuracy metrics that consistently strengthen one another.

Due to this, we have seen that if our basic accuracy is used from the very beginning, our accuracy is really high (above 90%), then for the rest it can reach 50-60%. And it is precisely the nesting of metrics into each other that allows us to consistently work on the quality of the base, moving from one metric to another.
Naturally, all such measurements occur on random samples of organizations, and this entails another insidious error. Often people forget that any indirect metric has an error. That is, if six months ago, the accuracy of the measurements was 62%, and now, after performing a certain project, it has become 63%, then this does not mean anything, it’s too early to beat the drums. Such a citation of statistical data is generally unprofessional, unless an error is simultaneously indicated.
The second mistake when working with similar metrics is the use of some point metrics. For example, depending on the significance of the error, a “rating” is set from 1 to 5. Obtaining an acceptable estimation error with imputed metering costs is possible only in the case of a binary metric - that is, data on a particular organization is either accurate or not.
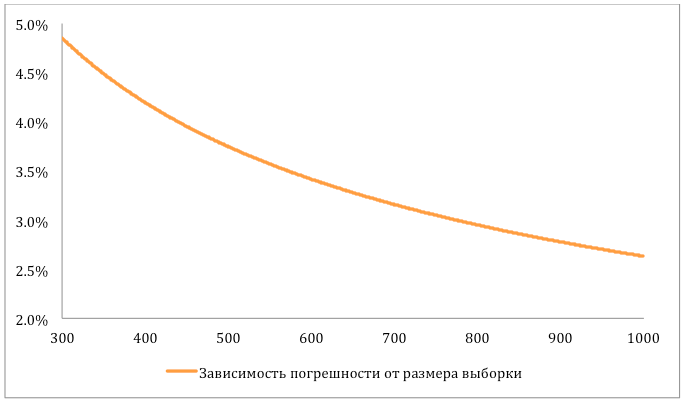
As mentioned above, the measurement of metrics is based on random samples. Random samples are manually checked by people, and based on this, the final metric is estimated. The larger the sample, the higher the labor costs for its checking (markup). In an ideal world that does not exist, the labor costs are worthless and the organization’s verification takes infinitely little time. Therefore, there, in an ideal world, it would be logical to check the entire base and calculate the value of accuracy. Then, by the way, I would not have to constantly make corrections for errors. However, the reality makes its own adjustments and I want to determine the optimal sample size. Mathematical statistics comes to the rescue.
Suppose that we have in the database N = 40 000 organizations. We are interested in the size of the sample n, which must be marked out, so that on its basis we can make a reliable conclusion about the accuracy of the entire base. Note that on the basis of selective markup, it will be possible to draw only a conclusion of the following form:
"The real accuracy of the base deviates from some number p by no more than δ with a probability of at least P".
So, we have three values: n is the sample size, δ is the estimate error, P is the probability of this estimate. Of course, we want to minimize our cost of marking up n organizations, minimize the error in estimating δ and maximize the probability P , with which we can assert that the results obtained on the basis of the sample are applicable to the entire base as a whole. But, as in the well-known joke “Quickly, efficiently, inexpensively - choose any two points”, we need to sacrifice something. We will not sacrifice much of the probability P , otherwise the estimate obtained will reflect the real state of affairs only with a small probability, but why then was the measurement taken? We agree on the probabilities P = 95% and the permissible error δ = 5%. And the size of the minimum sample is now not difficult to calculate. And what can not but rejoice, it can be argued that it will be enough to mark out a sample of only 384 organizations!
Suppose that we estimated a sample of size n = 384 organizations, and of these, m = 290 organizations turned out to be correct. Then we have the following estimate:
As already noted, when we receive, for example,
We now turn to the other defining metric of each directory - the metric of completeness. Completeness is the proportion of real-world organizations represented in the directory. So, if there are 10,000 organizations of interest to you in city X , and you only know 6,000 of them, then your completeness is 60%.
This metric can be measured in an “honest” way only by visiting organizations in the real world — that is, the metric itself is, in terms of labor costs, quite expensive. Fortunately, for the same reasons as above, the random flow of just 384 organizations is enough for us to measure completeness with an acceptable margin of error.
The measurement process itself is as follows. The first thing we need to do is create a random selection of addresses (house numbers) based on the address database we have on our Maps. Next, you need to visit each house and, according to the chosen definition, describe all the organizations present there.

A random sample of the collected organizations is checked for presence in Yandex.City. The estimate of the completeness and the error of this estimate are calculated using formulas that are already familiar to us.
findings
In addition to technical things, I want to highlight those managerial lessons that I learned during my work at Yandex.City.
- [captain obvious] Metrics are needed to manage any process or project. At the same time, if possible, they should be simple and understandable. There is nothing wrong with complex metrics, but in the case of a large distributed team, there must necessarily be a simple metric shared by all team members.
- When evaluating any metric and comparing metrics at different points in time, it is important to understand the accuracy of this estimate.
- When estimating metrics on random samples, it is required to use binary metrics, since only such an approach allows achieving an acceptable accuracy of estimation with a relatively small number of measurements.
- If you bring some kind of metric, do not be lazy, find out exactly how it is calculated. Ask for the source code, formula, description of the calculation algorithm, markup examples. Find out sample sizes and how they were generated. It may be a surprise that some offline metric, measured once a year, is usually considered on the data for the last month - that is, without regard to seasonality.
We considered two metrics - accuracy and completeness, which, on the one hand, allow us to adequately judge how well we reflect organizations from the real world in our system, and on the other hand, they are sufficiently comprehensible for the whole company and inexpensive to measure.
Next time we will talk about how to measure the offline metric of completeness in cases where there is no good map for the city, which in our case means that we do not have address information and a full list of “houses”.
Source: https://habr.com/ru/post/226517/
All Articles