How did SQL Server switch every two to three hours to using a non-optimal query execution plan?
I've been working on an interesting task for the last couple of days and would like to share an interesting experience with the community.
What is the problem:
I run the stored procedure (stored) on a sample of data for a report - it takes three seconds, I look at the battle profiler - the users have the same results. But it takes three hours and the same store, with the same parameters, it has already been running for 2 minutes, and similarly with users. Moreover, the data in the used tables were not inserted / deleted, the environment was not changed, and the admins did not make the settings.
Localized before request:
He set the profiler on execution plans and noticed that with an increase in the execution time, the execution plan of the problem query also changes.
')
Already something!
Then I began to look more attentively at what is changing in terms of implementation. It turned out that in the long run plan, NestedLoop unions are used, and in the fast plan, HashMatch are used.
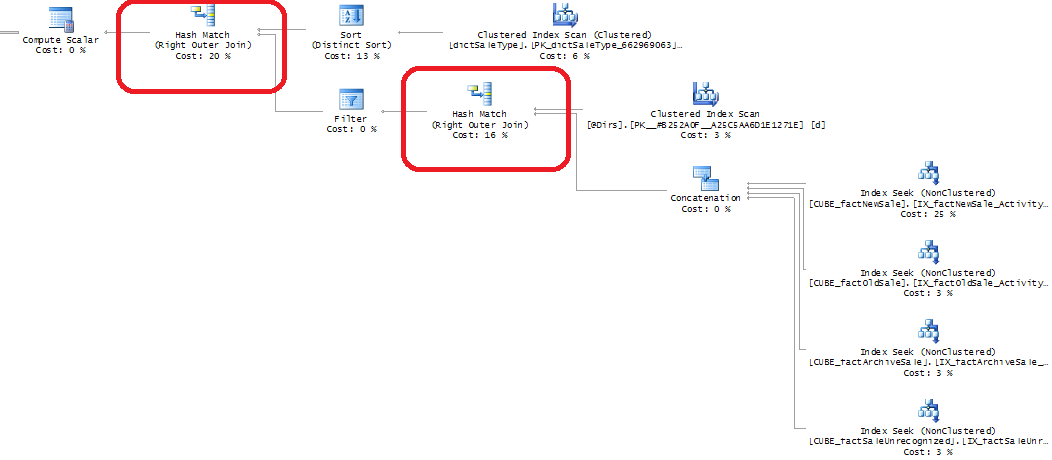
Quick Plan:
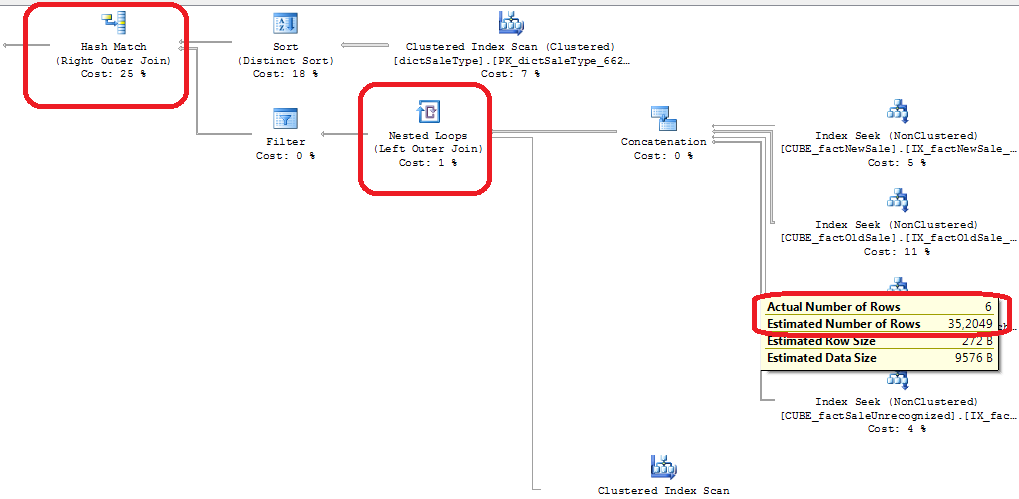
Slow (to which SQL Server switches in 2 hours):

I just did not want to prescribe HINTs for using HASH JOINs, since you need to understand why SQL Server still chooses the wrong plan.
The first thought was that something was wrong with the statistics, but on the execution plan from the profiler Actual Number Of Rows was 0, and the Estimated Number Of Rows is 1. Thus. Thus, the difference is not so great as to investigate problems with statistics and Cardinality.
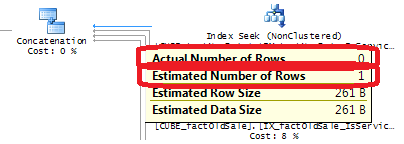
However, looking at Actual Number Of Rows = 0 from once to once, I had doubts - really, not a single row is always returned. It turned out that this is not the case; just the profiler intercepts the execution plan before the request is executed and the Actual data is known. And accordingly, it can not display anything except as a zero in Actual Number Of Rows.
Ok, now look at the actual values of Actual Number Of Rows!
Then the question arose - why is Estimated Number Of Rows always equal to one? After all, the index is used, it has current statistics. And the value of Estimated Number Of Rows is every time 1. But here without surprises - SQL Server does not use statistics if it starts from a low selective column (i.e., if the number of different values is small, for example: 0, 1, NULL). Therefore, I moved the first column in the index key to the last place. After making sure that all the conditions on these columns are superimposed in WHERE and listed through AND, it means that the index with its statistics is still suitable for use.
Diagnosis:
Decision:
And now all the requests are executed in no more than 2 seconds, the execution plan is used as a mix from the previous ones, and the Actual Number Of Rows is viewed in Management Studio:
But that's not all!
Such a work strategy will still cache execution plans, which has both a positive side and a negative one.
Positive:
execution speed is really 1-2 seconds
Negative:
Periodically, the request is executed for about 20-40 seconds, and then it continues to be executed again for 1-2 seconds. This happens when there is a jump in the change in the number of rows in the problem query (either from large to small, or from small to large).
But SQL Server gives us the opportunity to overcome it!
To do this, you can use the OPTION (RECOMPILE) option, which will rebuild the execution plan with each execution. This will lead to an increase in the execution time of each request up to 3-4 seconds, but there will be no executions of 20-40 seconds during the day. By the way, OPTION (RECOMPILE) also helps to get the most accurate Cardinality score when using temporary objects and table variables, which is used when determining the Estimated Number of Rows and then when choosing a query execution plan. (More details about temporary objects and the essence of the RECOMPILE option in them are described in an extremely good post - sqlblog.com/blogs/paul_white/archive/2012/08/15/temporary-tables-in-stored-procedures.aspx )
Here we ourselves need to decide what is more important - that the majority of requests be executed for 1-2 seconds or that no request is executed for more than 20 seconds during the day.
What is the problem:
I run the stored procedure (stored) on a sample of data for a report - it takes three seconds, I look at the battle profiler - the users have the same results. But it takes three hours and the same store, with the same parameters, it has already been running for 2 minutes, and similarly with users. Moreover, the data in the used tables were not inserted / deleted, the environment was not changed, and the admins did not make the settings.
Localized before request:
INSERT INTO @table_variable1 SELECT ... FROM dbo.view_with_unions v1 WITH (READUNCOMMITTED) LEFT JOIN @table_variable2 AS t1 ON t1.Code = v1.DirectionDimensionCode LEFT JOIN other_table v2 WITH (READUNCOMMITTED) ON v2.Code = v1.SaleType WHERE ... He set the profiler on execution plans and noticed that with an increase in the execution time, the execution plan of the problem query also changes.
')
Already something!
Then I began to look more attentively at what is changing in terms of implementation. It turned out that in the long run plan, NestedLoop unions are used, and in the fast plan, HashMatch are used.
Quick Plan:
Slow (to which SQL Server switches in 2 hours):
I just did not want to prescribe HINTs for using HASH JOINs, since you need to understand why SQL Server still chooses the wrong plan.
The first thought was that something was wrong with the statistics, but on the execution plan from the profiler Actual Number Of Rows was 0, and the Estimated Number Of Rows is 1. Thus. Thus, the difference is not so great as to investigate problems with statistics and Cardinality.
However, looking at Actual Number Of Rows = 0 from once to once, I had doubts - really, not a single row is always returned. It turned out that this is not the case; just the profiler intercepts the execution plan before the request is executed and the Actual data is known. And accordingly, it can not display anything except as a zero in Actual Number Of Rows.
Ok, now look at the actual values of Actual Number Of Rows!
Then the question arose - why is Estimated Number Of Rows always equal to one? After all, the index is used, it has current statistics. And the value of Estimated Number Of Rows is every time 1. But here without surprises - SQL Server does not use statistics if it starts from a low selective column (i.e., if the number of different values is small, for example: 0, 1, NULL). Therefore, I moved the first column in the index key to the last place. After making sure that all the conditions on these columns are superimposed in WHERE and listed through AND, it means that the index with its statistics is still suitable for use.
Diagnosis:
- The profiler does not display Actual Number Of Rows on the execution plans, and does not write n / a, but zero. We must remember this!
- SQL Server does not use statistics to determine the Estimated Number Of Rows, in our case.
- And even if he starts using statistics, he is very mistaken.
Decision:
- We manually launch many requests from the profiler and look at the real Actual Number Of Rows
- It is necessary to give SQL Server the opportunity to use statistics on the index, for this the first column in the key should have many different values (for example, not three 0, 1, NULL). Since if the first column has few different values (low selective), then SQL Server does not have the ability to adequately predict the number of rows and therefore does not use such statistics.
- After rebuilding the index, you need to update the statistics with the WITH FULLSCAN option to improve the quality of Estimated Number Of Rows forecasts:
UPDATE STATISTICS [dbo]. [ Table_from_union_for_view ] WITH FULLSCAN;
GO
And now all the requests are executed in no more than 2 seconds, the execution plan is used as a mix from the previous ones, and the Actual Number Of Rows is viewed in Management Studio:
But that's not all!
Such a work strategy will still cache execution plans, which has both a positive side and a negative one.
Positive:
execution speed is really 1-2 seconds
Negative:
Periodically, the request is executed for about 20-40 seconds, and then it continues to be executed again for 1-2 seconds. This happens when there is a jump in the change in the number of rows in the problem query (either from large to small, or from small to large).
But SQL Server gives us the opportunity to overcome it!
To do this, you can use the OPTION (RECOMPILE) option, which will rebuild the execution plan with each execution. This will lead to an increase in the execution time of each request up to 3-4 seconds, but there will be no executions of 20-40 seconds during the day. By the way, OPTION (RECOMPILE) also helps to get the most accurate Cardinality score when using temporary objects and table variables, which is used when determining the Estimated Number of Rows and then when choosing a query execution plan. (More details about temporary objects and the essence of the RECOMPILE option in them are described in an extremely good post - sqlblog.com/blogs/paul_white/archive/2012/08/15/temporary-tables-in-stored-procedures.aspx )
Here we ourselves need to decide what is more important - that the majority of requests be executed for 1-2 seconds or that no request is executed for more than 20 seconds during the day.
Source: https://habr.com/ru/post/226335/
All Articles