Space cycles in radioactive decay
Good afternoon Habr. I am writing here because some may be interested in the Dynamic Time Warping method .
not only in the recognition of speech and time series, but also as an application in purely scientific methods.
In the distant 50s of the 20th century, radiologist Simon Shnol from the Pushchino Institute of Theoretical and Experimental Biophysics and Moscow State University attempting to reduce the range of results with as accurate as possible measurements of the rate of ATP hydrolysis of protein catalyzed by actomyosin complex, came up with an inexplicable similarity of histograms (probability density graphs) simultaneously, but located at different points in the measurement laboratory.
How can probability densities be similar? It is very simple, if you imagine that any real measurement is interfering with any design of distribution hypotheses.
')
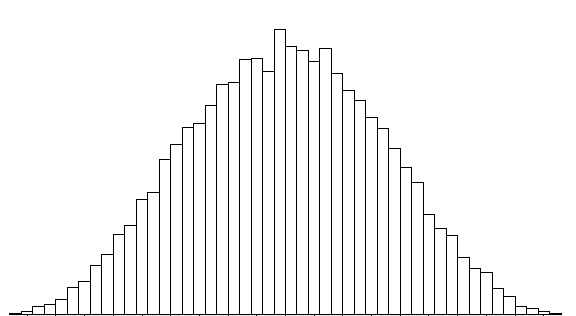
Normal distribution example

Distorted example

An example of comparing two histograms.
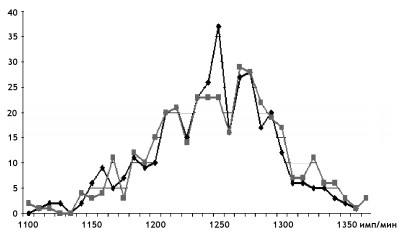
Human vision can easily see all these humps and plains. The task as for recognizing human handwriting.
We continue the story:
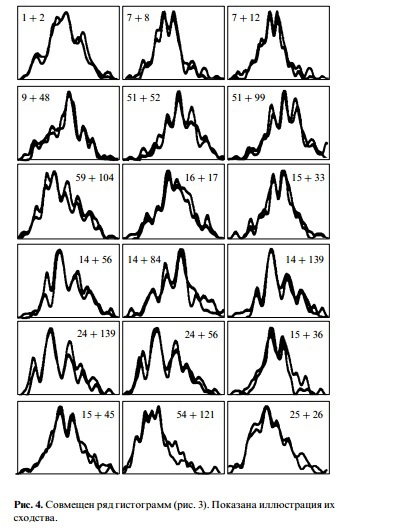
It turned out that while maintaining the amplitude of fluctuations of the magnitude in a constant range, histograms can vary greatly and each form
unique picture, well visible to the eye. These pictures can be attributed to several dynamically formed classes. Or compare each with each.
Scientists walked a long way through the study of the effects of electromagnetic isolation, arctic and antarctic expeditions, the transition from biochemical reactions
to electromagnetic noise and radioactive decays.
Alternately checked the preservation of shape effect
- on actomyosin fibrillar proteins in aqueous solution
- globular proteins of creatine kinase in aqueous solution
- reaction of ascorbic acid with dichlorophenolindophenol (blue paint)
- experiments with homologous series of alcohols and with D2O
- the influence of visible light was checked
- checked the dependence of the amplitude of the constitutional oscillations on the shape of the vessels
- The influence of artificial electromagnetic fields was tested.
- when protected by an electromagnetic screen
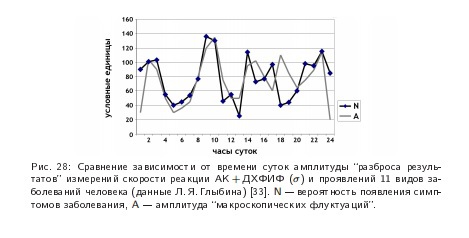
- the change in the amplitude of chemical reactions correlates live with solar activity
- alpha decay of 239 plutonium
- the conversion of iron 55 to magnesium 55
- beta carbon decay 14
This is described in more detail in the book.
and articles on the successes of the physical sciences
http://ufn.ru/ru/articles/1998/10/e/
http://ufn.ru/ru/articles/2000/2/o/
As well as light rollers
Academy
Gordon
Findings of these studies
- The form of histograms is not accidental and depends on cosmophysical reasons
- It is not accidental repetition of the form of histograms over time
- The form of histograms with a high probability is repeated at intervals of day, month, solar and stellar year
- The shape of the histograms is similar in the near future.
- Shapes of histograms with high probability are chiral symmetric
What method can you obtain a mathematical proof of this effect?
Everything converges if you apply Dynamic time warping (DTW) - one of the methods of statistical distance
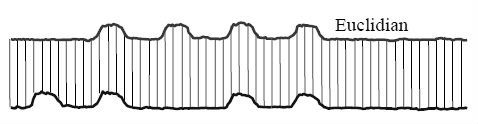
The most trivial case for statistical distance is to use the Euclidean distance:
DTW is a preliminary combinatorial comparison of all elements with all to form a matrix of distances and
the subsequent calculation of the minimum path by which from the point of the beginning of the graph you can get to the end with minimal permutations.
A good representation is the bars of the histogram represented in the form of heaps of earth . And then the distance between column number 2 and 7:
(7-2) * (height of column 1 - height of column 2) or for the matrix it will be simple (height of column 1 - height of column 2).

Step left, step right to find the minimum

Link to the file of the series of the amount of radioactive decay per second for two days 2 * 86400 values
https://www.dropbox.com/s/fhroi3vt04tw5xl/28-08-2004.txt
An example of a daily rhythm compared with a random comparison. 120 points on the chart.
I considered the sum of all dtw distances of 1 histogram of 1 day and 1 histogram of the second day +2 histogram of 1 day 2 histogram of 2 days ...
The closer to 0, the similar.
Random is a comparison of 2 random histograms and the sum of n such = histograms in days
10 iterations randomly:
0 iteration 175151
1 iteration 173674
2 iteration 177803
3 iteration 173606
4 iteration 170081
5 iteration 163283
6 iteration 168616
7 iteration 171315
8 iteration 172237
9 iteration 174893
For daily rhythm 27857
Each step is 120 seconds away from the daily rhythm.
+ 0 step 27857.0
+ 1 step 28236.0
+ 2 step 28390.0
+ 3 step 28627.0
+ 4 step 28670.0
+ 5 step 28817.0
+ 6 step 29241.0
+ 7 step 29174.0
+ 8 step 29498.0
+ 9 step 29607.0
+ 10 step 29897.0
+ 11 step 29882.0
+ 12 step 30004.0
+ 13 step 30519.0
+ 14 step 30724.0
The most remarkable thing is that the distance formula for DTW can be any, for example, the calculation of the day for the formula
For the formula above, random 42627
Daily rhythm 6027
Or such
Bottom line: We are dealing with fluctuations in the space of time due to the inhomogeneity of space.
Perhaps this is the missing cube for thermonuclear fusion and the reason for the incompleteness of knowledge in this area.
github.com/smagikern/radioactivity - Code for searching rhythms on a githaba
not only in the recognition of speech and time series, but also as an application in purely scientific methods.
In the distant 50s of the 20th century, radiologist Simon Shnol from the Pushchino Institute of Theoretical and Experimental Biophysics and Moscow State University attempting to reduce the range of results with as accurate as possible measurements of the rate of ATP hydrolysis of protein catalyzed by actomyosin complex, came up with an inexplicable similarity of histograms (probability density graphs) simultaneously, but located at different points in the measurement laboratory.
How can probability densities be similar? It is very simple, if you imagine that any real measurement is interfering with any design of distribution hypotheses.
')
Normal distribution example
Distorted example
An example of comparing two histograms.
Human vision can easily see all these humps and plains. The task as for recognizing human handwriting.
We continue the story:
It turned out that while maintaining the amplitude of fluctuations of the magnitude in a constant range, histograms can vary greatly and each form
unique picture, well visible to the eye. These pictures can be attributed to several dynamically formed classes. Or compare each with each.
Scientists walked a long way through the study of the effects of electromagnetic isolation, arctic and antarctic expeditions, the transition from biochemical reactions
to electromagnetic noise and radioactive decays.
Alternately checked the preservation of shape effect
- on actomyosin fibrillar proteins in aqueous solution
- globular proteins of creatine kinase in aqueous solution
- reaction of ascorbic acid with dichlorophenolindophenol (blue paint)
- experiments with homologous series of alcohols and with D2O
- the influence of visible light was checked
- checked the dependence of the amplitude of the constitutional oscillations on the shape of the vessels
- The influence of artificial electromagnetic fields was tested.
- when protected by an electromagnetic screen
- the change in the amplitude of chemical reactions correlates live with solar activity
- alpha decay of 239 plutonium
- the conversion of iron 55 to magnesium 55
- beta carbon decay 14
This is described in more detail in the book.
and articles on the successes of the physical sciences
http://ufn.ru/ru/articles/1998/10/e/
http://ufn.ru/ru/articles/2000/2/o/
As well as light rollers
Academy
Gordon
Findings of these studies
- The form of histograms is not accidental and depends on cosmophysical reasons
- It is not accidental repetition of the form of histograms over time
- The form of histograms with a high probability is repeated at intervals of day, month, solar and stellar year
- The shape of the histograms is similar in the near future.
- Shapes of histograms with high probability are chiral symmetric
What method can you obtain a mathematical proof of this effect?
Everything converges if you apply Dynamic time warping (DTW) - one of the methods of statistical distance
The most trivial case for statistical distance is to use the Euclidean distance:
DTW is a preliminary combinatorial comparison of all elements with all to form a matrix of distances and
the subsequent calculation of the minimum path by which from the point of the beginning of the graph you can get to the end with minimal permutations.
A good representation is the bars of the histogram represented in the form of heaps of earth . And then the distance between column number 2 and 7:
(7-2) * (height of column 1 - height of column 2) or for the matrix it will be simple (height of column 1 - height of column 2).
Step left, step right to find the minimum
Link to the file of the series of the amount of radioactive decay per second for two days 2 * 86400 values
https://www.dropbox.com/s/fhroi3vt04tw5xl/28-08-2004.txt
An example of a daily rhythm compared with a random comparison. 120 points on the chart.
I considered the sum of all dtw distances of 1 histogram of 1 day and 1 histogram of the second day +2 histogram of 1 day 2 histogram of 2 days ...
The closer to 0, the similar.
Random is a comparison of 2 random histograms and the sum of n such = histograms in days
10 iterations randomly:
0 iteration 175151
1 iteration 173674
2 iteration 177803
3 iteration 173606
4 iteration 170081
5 iteration 163283
6 iteration 168616
7 iteration 171315
8 iteration 172237
9 iteration 174893
For daily rhythm 27857
Each step is 120 seconds away from the daily rhythm.
+ 0 step 27857.0
+ 1 step 28236.0
+ 2 step 28390.0
+ 3 step 28627.0
+ 4 step 28670.0
+ 5 step 28817.0
+ 6 step 29241.0
+ 7 step 29174.0
+ 8 step 29498.0
+ 9 step 29607.0
+ 10 step 29897.0
+ 11 step 29882.0
+ 12 step 30004.0
+ 13 step 30519.0
+ 14 step 30724.0
The most remarkable thing is that the distance formula for DTW can be any, for example, the calculation of the day for the formula
For the formula above, random 42627
Daily rhythm 6027
Or such
Bottom line: We are dealing with fluctuations in the space of time due to the inhomogeneity of space.
Perhaps this is the missing cube for thermonuclear fusion and the reason for the incompleteness of knowledge in this area.
github.com/smagikern/radioactivity - Code for searching rhythms on a githaba
Source: https://habr.com/ru/post/225661/
All Articles