How to gash your dashboard for all occasions?
In the work of almost every person, by all means there are numbers on which everything depends. Site attendance, response time or number of commits - whatever! And if you put these numbers in the most visible place, they immediately become either a great way to make decisions quickly, or just a visual tool of motivation. And the best way to do this is with your own dashboard, information board, which can be hung in the most prominent place in the office.

According to Google Translate, the Dashboard is a dashboard. And indeed, on those Dashboards, which will be discussed in the article, you can quickly monitor changes in various parameters - as if on an airplane dashboard. Only instead of the plane we will have a conditional start-up, and instead of height, roll and temperature overboard - the number of visitors online, the status of the various components of the service and the server load.
')
In essence, a dashboard is a screen on which actual data is displayed in real time in some beautiful and visual form, for example, in the form of graphs, numbers or diagrams. Such screens hang on the walls of the offices of many cool companies: for example, search queries that users enter at the moment are displayed on the screen at the Yandex office. In many technical startups on the screen for technical guys show data of various monitoring. I also wanted to do something similar and had already prepared to code for several days - but it turned out that everything I had already done was done before me.
We will build our Dashboard using the free framework Dashing , developed in the depths of the company Shopify. Pledged architecture implies that the dashboard consists of:
He can collect and process almost any data, and he is accustomed to take them from anywhere: for example, from our server he can take the load off, ping time, the number of registrations on the service; from social networks - the latest posts on the topic, the number of followers Twitter, the most popular topics reddit; from other services - weather, news in the world, pull requests on the githaba. In general, we can collect and show almost anything we want. And now I will tell you exactly how. Watch your hands - repeat the movement.
Heroku is the perfect platform for free Dashing.
To do this, on the main page of Heroku, click the Sign Up button, on the page that appears, enter the email, in the received email, click on the confirmation link, create a password and click Save. Done! Now we have a small but proud corner in the cloud where you can quickly create elegant web applications.
The page on which we are on, offers to install Heroku Toolbelt - a utility for working with the cloud. We will not deny this to ourselves. If you have, like me, Ubuntu or Debian, then feel free to write to the console:
If Windows or OS X, download from their site exe or pkg and install.
Secondly, we will need a version control system to quickly return everything to its place if we suddenly spoil everything, and to know who to give a blow on the cap if someone else spoils everything. The creators of Heroku recommend Git for this purpose. Let's not refuse - Git is really good. Installing it is easy:
For another operating system, Git also swings from the official site just as easily and installs just as easily. Now we have everything to start.
First, let's log in to Heroku. To do this, open the command line, write:
Enter here the email and password specified during registration. Create a folder for the future repository and go to it.
We clone Git-repository Dashing:
Now you need to install the application, initialize the new Git repository, and commit everything we just cloned into it:
Create an application in Heroku
It is now available at
If the console swears at the absence of the Gemfile.lock file, despite the fact that it is there, open the
and remove the line
After that push will pass successfully, after which the installation will automatically start. Ah, this beautiful age of smart cars! While the installation is underway, you can drink coffee and send a newsletter to your colleagues that in 20 minutes an incredible beauty and visibility corporate data visualization service will be ready.
Since Dashing is written in Ruby, creating your first dashboard will be easier than ever. Install the appropriate gem (make sure Ruby 1.9+ is installed on the system):
Next, we generate a new project:
Go to the directory sweet_dashboard_project and bundle gems:
Now you can run the server:
If everything went as it should, then on the port 3030 a web server started (based on Dashing using Sinatra), so you can safely open localhost: 3030 in the browser.
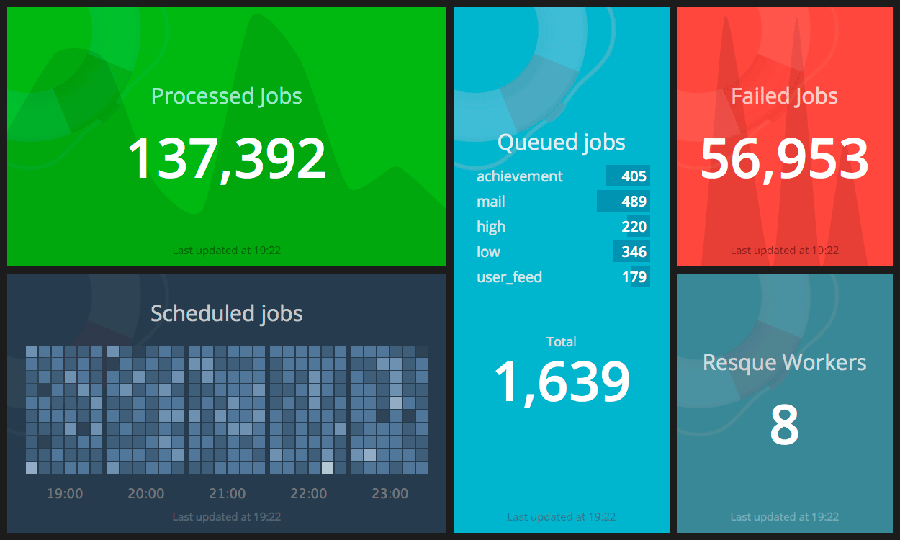
Any dashboard comes with demo widgets and the necessary files - together they provide a good starting point to make a dashboard for you. On the screen there will be several widgets that can be arbitrarily moved and interchanged. The developers specially selected such a set to demonstrate the variety of data visualization methods: one of the widgets shows a graph of a certain parameter change (for example, processor load), the second one is more suitable for visualizing value and its securities change, the third one visualizes a digital value, but using a circular indicator , similar to a speedometer, in the fourth the plate with a certain statistics is deduced, in one the text is deduced and there is a countdown.
By the way, here is an example of how you can influence the data that is displayed on the Dashboard. Try to type in the console:
and in one of the widgets the text will change. About this we'll talk further.
First you need to understand the simple structure of the application:
Below is an example of a simple dashboard consisting of two widgets:
Each of the widgets has two important parameters: data-id (this is the id of the widget, which is then used when updating files), as well as a data-view (indicating the type of widget, in this case both of the widget are numeric). Using the grid described by the data-row (row) and data-col (column) parameters as a constructor, we collect a dashboard from the necessary widgets (by default, clock, comments, graph, iframe, image, list, meter, number, text are implemented in Dashin ).

Nobody bothers to write your widget (we will not go deep, everything is in the documentation), but at first we will definitely have enough of the standard ones. But with what it is important to understand, so it is with updating the data that will be further visualized. After all, this is the most important thing.
Data transfer to widgets is implemented very simply. You only need to specify the widget that you want to use (using its widget-id), and transfer data to it in the form of JSON. There are two ways to do this.
A special scheduler is built into Dashing, which parses the job scripts located in the jobs folder and performs the actions specified in them with the necessary periodicity. To create your job file, use generate job sample_job.
This task will be executed every minute and send a random value to all widgets whose data-id is equal to karma. Accordingly, the send_event method (widget_id, json_formatted_data) is used to transfer values.
Tasks are very useful when you need to take some data from the database or call third-party APIs (Dashing implements data aggregation from Twitter).
Another way is to update the data directly via HTTP:
For security purposes, a token is used (it is written in config.ru). We already saw an example of such a query when we updated the value of a text field in a deshborb, which Dashing creates by default.

A large community begins to form around Dashin, on the special pages github.com/Shopify/dashing/wiki/Additional-Widgets and dashing.challengepost.com many ready-made widgets are collected.
I was able to assemble a dashboard for my office. What did I want to do? It should be a countdown to release (or until the end of the iteration, if Agile is used). It is also necessary to monitor the number of visitors currently on the site (we will take data from Google Analytics). At the same time, it would be good to monitor the load on the server, in order to understand in time what needs to be optimized and where to take measures to prevent the site from suddenly collapsing under a wave of visitors or a DDoS attack. And finally, we will follow what is being written about us on social networks: we will display the latest messages from Twitter with the name of our service.
As a result, I collected the following set of widgets:

Of course, the dashboard will be useful and easy on the computer (you can set it as a start page), but still, traditionally, the image of all this beauty is displayed on the TV. On modern TVs, there is even a browser, but, frankly, I don’t have one at my disposal, so I haven’t tried this configuration.
My option is to use Raspberry Pi for output. It is ideally powered via the USB port of the TV (it is almost everywhere now) and is connected via HDMI. The only problem may be connecting to the network: if you do not want extra wires, you can use the USB Wi-Fi module (instructions here ). Unfortunately, Dashing turned out to be quite voracious to resources, so I even had to install a special Chromium assembly - Hexxeh's Chrome and limit the refresh rate of the image.
I summarize. Labor costs one day. Programming is almost unnecessary. Necessary iron - Raspberri Pi, one piece. The result is the coolest dashboard in the office, which everyone now wants to improve. Beauty!
It is clear that on the framework of Dashing the light did not come together. A quick search on GitHub gave some more interesting developments that could be used.

First published in the magazine "Hacker" from 04/2014.
Publication on Issuu.com
Subscribe to "Hacker"


Why do we need Dashboards?
According to Google Translate, the Dashboard is a dashboard. And indeed, on those Dashboards, which will be discussed in the article, you can quickly monitor changes in various parameters - as if on an airplane dashboard. Only instead of the plane we will have a conditional start-up, and instead of height, roll and temperature overboard - the number of visitors online, the status of the various components of the service and the server load.
')
In essence, a dashboard is a screen on which actual data is displayed in real time in some beautiful and visual form, for example, in the form of graphs, numbers or diagrams. Such screens hang on the walls of the offices of many cool companies: for example, search queries that users enter at the moment are displayed on the screen at the Yandex office. In many technical startups on the screen for technical guys show data of various monitoring. I also wanted to do something similar and had already prepared to code for several days - but it turned out that everything I had already done was done before me.
How to build a dashboard?
We will build our Dashboard using the free framework Dashing , developed in the depths of the company Shopify. Pledged architecture implies that the dashboard consists of:
- from the “hands”, that is, the grabber, which with the specified interval collects the necessary data;
- A “brain”, that is, a parser that processes this data in real time;
- "Muzzles" - frontend, to which these data are displayed in a beautiful and visual form.
He can collect and process almost any data, and he is accustomed to take them from anywhere: for example, from our server he can take the load off, ping time, the number of registrations on the service; from social networks - the latest posts on the topic, the number of followers Twitter, the most popular topics reddit; from other services - weather, news in the world, pull requests on the githaba. In general, we can collect and show almost anything we want. And now I will tell you exactly how. Watch your hands - repeat the movement.
All over heroku
Heroku is the perfect platform for free Dashing.
To do this, on the main page of Heroku, click the Sign Up button, on the page that appears, enter the email, in the received email, click on the confirmation link, create a password and click Save. Done! Now we have a small but proud corner in the cloud where you can quickly create elegant web applications.
The page on which we are on, offers to install Heroku Toolbelt - a utility for working with the cloud. We will not deny this to ourselves. If you have, like me, Ubuntu or Debian, then feel free to write to the console:
wget -qO- https://toolbelt.heroku.com/install-ubuntu.sh | sh If Windows or OS X, download from their site exe or pkg and install.
Secondly, we will need a version control system to quickly return everything to its place if we suddenly spoil everything, and to know who to give a blow on the cap if someone else spoils everything. The creators of Heroku recommend Git for this purpose. Let's not refuse - Git is really good. Installing it is easy:
sudo apt-get install git For another operating system, Git also swings from the official site just as easily and installs just as easily. Now we have everything to start.
Install Dashing
First, let's log in to Heroku. To do this, open the command line, write:
heroku login Enter here the email and password specified during registration. Create a folder for the future repository and go to it.
mkdir dashing cd dashing We clone Git-repository Dashing:
git clone https://github.com/Shopify/dashing.git Now you need to install the application, initialize the new Git repository, and commit everything we just cloned into it:
bundle install git init git add . git commit -m "My beautiful dashboard" Create an application in Heroku
heroku apps:create xakepdashboard It is now available at
xakepdashboard.herokuapp.com , but there is nothing in it. But the Heroku utility created a separate branch of the heroku repository. Copy our application there. git push heroku master If the console swears at the absence of the Gemfile.lock file, despite the fact that it is there, open the
.gitignore file gedit .gitignore and remove the line
./Gemfile.lock from thereAfter that push will pass successfully, after which the installation will automatically start. Ah, this beautiful age of smart cars! While the installation is underway, you can drink coffee and send a newsletter to your colleagues that in 20 minutes an incredible beauty and visibility corporate data visualization service will be ready.
First dashboard
Since Dashing is written in Ruby, creating your first dashboard will be easier than ever. Install the appropriate gem (make sure Ruby 1.9+ is installed on the system):
$ gem install dashing Next, we generate a new project:
$ dashing new sweet_dashboard_project Go to the directory sweet_dashboard_project and bundle gems:
$ bundle Now you can run the server:
$ dashing start If everything went as it should, then on the port 3030 a web server started (based on Dashing using Sinatra), so you can safely open localhost: 3030 in the browser.
Any dashboard comes with demo widgets and the necessary files - together they provide a good starting point to make a dashboard for you. On the screen there will be several widgets that can be arbitrarily moved and interchanged. The developers specially selected such a set to demonstrate the variety of data visualization methods: one of the widgets shows a graph of a certain parameter change (for example, processor load), the second one is more suitable for visualizing value and its securities change, the third one visualizes a digital value, but using a circular indicator , similar to a speedometer, in the fourth the plate with a certain statistics is deduced, in one the text is deduced and there is a countdown.
By the way, here is an example of how you can influence the data that is displayed on the Dashboard. Try to type in the console:
curl -d '{ "auth<em>token": "YOUR</em>AUTH_TOKEN", "text": " " }' \http://127.0.0.1:3030/widgets/welcome and in one of the widgets the text will change. About this we'll talk further.
Dashing structure
First you need to understand the simple structure of the application:
- Assets - this folder contains images, fonts, js / coffeescript libraries.
- Dashboards - for each dashboard there is an erb-file that describes the location and parameters of the widgets.
- Jobs - scripts for data collection (for example, calling the external services API).
- Lib - optional helper Ruby files that may be needed.
- Public - static dashboard files (now here are favicon or custom 404th page).
- Widgets - all HTML / CSS / coffee-code for your own widgets.
Below is an example of a simple dashboard consisting of two widgets:
<% content_for(:title) { "Xakep dashboard" } %> <div class="gridster"> <ul> <li data-row="1" data-col="1" data-sizex="1" data-sizey="1"> <div data-id="karma" data-view="Number" data-title="Karma" style="background-color:#96bf48;"></div> </li> <li data-row="1" data-col="1" data-sizex="1" data-sizey="1"> <div data-id="valuation" data-view="Number" data-title="Current Valuation" data-prefix="$"></div> </li> </ul> </div> Each of the widgets has two important parameters: data-id (this is the id of the widget, which is then used when updating files), as well as a data-view (indicating the type of widget, in this case both of the widget are numeric). Using the grid described by the data-row (row) and data-col (column) parameters as a constructor, we collect a dashboard from the necessary widgets (by default, clock, comments, graph, iframe, image, list, meter, number, text are implemented in Dashin ).
Nobody bothers to write your widget (we will not go deep, everything is in the documentation), but at first we will definitely have enough of the standard ones. But with what it is important to understand, so it is with updating the data that will be further visualized. After all, this is the most important thing.
How to update data
Data transfer to widgets is implemented very simply. You only need to specify the widget that you want to use (using its widget-id), and transfer data to it in the form of JSON. There are two ways to do this.
Tasks with the scheduler (Jobs)
A special scheduler is built into Dashing, which parses the job scripts located in the jobs folder and performs the actions specified in them with the necessary periodicity. To create your job file, use generate job sample_job.
SCHEDULER.every '1m', :first_in => 0 do |job| send_event('karma', { current: rand(1000) }) end This task will be executed every minute and send a random value to all widgets whose data-id is equal to karma. Accordingly, the send_event method (widget_id, json_formatted_data) is used to transfer values.
Tasks are very useful when you need to take some data from the database or call third-party APIs (Dashing implements data aggregation from Twitter).
API
Another way is to update the data directly via HTTP:
curl -d '{ "auth_token": "YOUR_AUTH_TOKEN", "current": 100 }' http://localhost:3030/widgets/karma For security purposes, a token is used (it is written in config.ru). We already saw an example of such a query when we updated the value of a text field in a deshborb, which Dashing creates by default.
My office dashboard
A large community begins to form around Dashin, on the special pages github.com/Shopify/dashing/wiki/Additional-Widgets and dashing.challengepost.com many ready-made widgets are collected.
I was able to assemble a dashboard for my office. What did I want to do? It should be a countdown to release (or until the end of the iteration, if Agile is used). It is also necessary to monitor the number of visitors currently on the site (we will take data from Google Analytics). At the same time, it would be good to monitor the load on the server, in order to understand in time what needs to be optimized and where to take measures to prevent the site from suddenly collapsing under a wave of visitors or a DDoS attack. And finally, we will follow what is being written about us on social networks: we will display the latest messages from Twitter with the name of our service.
As a result, I collected the following set of widgets:
- Countdown Countdown widget .
- Visitor monitoring. Google Analytics widget.
- The load on the server. Load Averages widget.
- Project status in the form of a traffic light. We will rewrite the Github status widget for your project .
- Twitter Twitter Search Widget.
How to bring to the TV?
Of course, the dashboard will be useful and easy on the computer (you can set it as a start page), but still, traditionally, the image of all this beauty is displayed on the TV. On modern TVs, there is even a browser, but, frankly, I don’t have one at my disposal, so I haven’t tried this configuration.
My option is to use Raspberry Pi for output. It is ideally powered via the USB port of the TV (it is almost everywhere now) and is connected via HDMI. The only problem may be connecting to the network: if you do not want extra wires, you can use the USB Wi-Fi module (instructions here ). Unfortunately, Dashing turned out to be quite voracious to resources, so I even had to install a special Chromium assembly - Hexxeh's Chrome and limit the refresh rate of the image.
I summarize. Labor costs one day. Programming is almost unnecessary. Necessary iron - Raspberri Pi, one piece. The result is the coolest dashboard in the office, which everyone now wants to improve. Beauty!
Dashing did not go. What else?
It is clear that on the framework of Dashing the light did not come together. A quick search on GitHub gave some more interesting developments that could be used.
- Team Dashboard . A great framework for creating a dashboard, which can be controversial in functionality with Dashing. Team Dashboard is intended primarily for technical teams. So, already out of the box there are ready-made modules for monitoring systems Errbit, New Relic, Pingdom, CI systems (Continous Integration) Jenkins, Travis CI. There are modules for visualizing any data in the form of graphs (using Graphite and Ganglia), a widget for displaying digital data and their changes over time, and so on.
- Grafana . Rich in functionality panel with the display of statistics (and another graph editor). Offered as a beautiful replacement for Graphite.
- Linux Dash . A convenient and simple web panel for remote monitoring of a Linux machine, written in PHP. It shows uptime, load of RAM, free disk space, connected users, installed software, running processes and so on.
- Reportr . Personal dashboard for visualizing a variety of data on daily activity: from RunKeeper's sports activity to the number of commits on GitHub.
- Personal Dashboard & API . Another personal dashboard, indecently simple to implement.
- sDashboard . JS framework for creating deshboards. In fact, it is a jQuery plugin that allows you to visualize various data and events.
- dashku A full-fledged deshboards framework written on Node.js by Asian developers.
First published in the magazine "Hacker" from 04/2014.
Publication on Issuu.com
Subscribe to "Hacker"
Source: https://habr.com/ru/post/225249/
All Articles