Geodesy: on the field on the "python"
Good time, Habr!
A bit of history: in the course of studying programming, I was looking for a real task for myself, but one that would be useful. Found. Saw as a familiar surveyor, at work, considers the volume of land. Very long and tedious ...
Geodetic calculation of volumes:
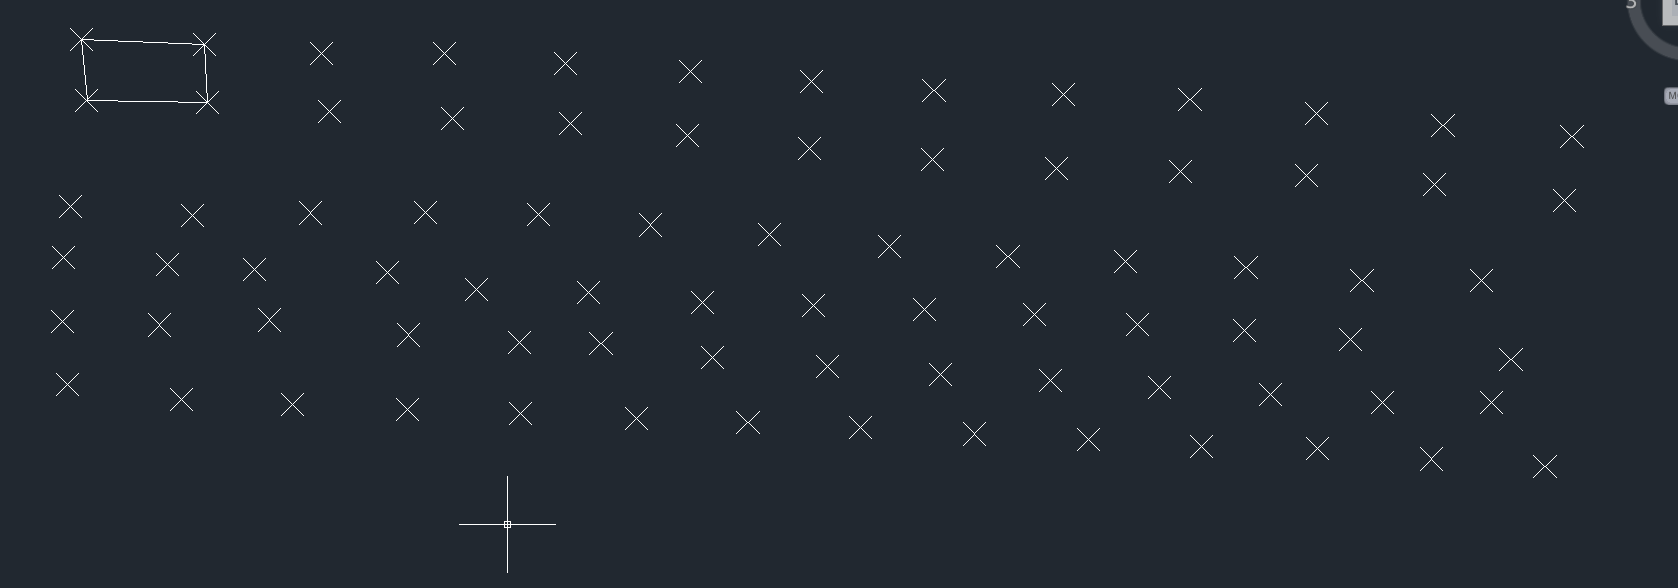
The construction of residential buildings, high-tech premises, roads and railways, as well as in order to determine the volume of building materials and calculate the volume of excavation work, requires the assistance of surveyors. They “shoot” the territory, breaking the entire area into a so-called geogrid , then the points from the device are unloaded into autoCAD and calculate the volume of the entire territory. Below is an example of a geogrid :
')
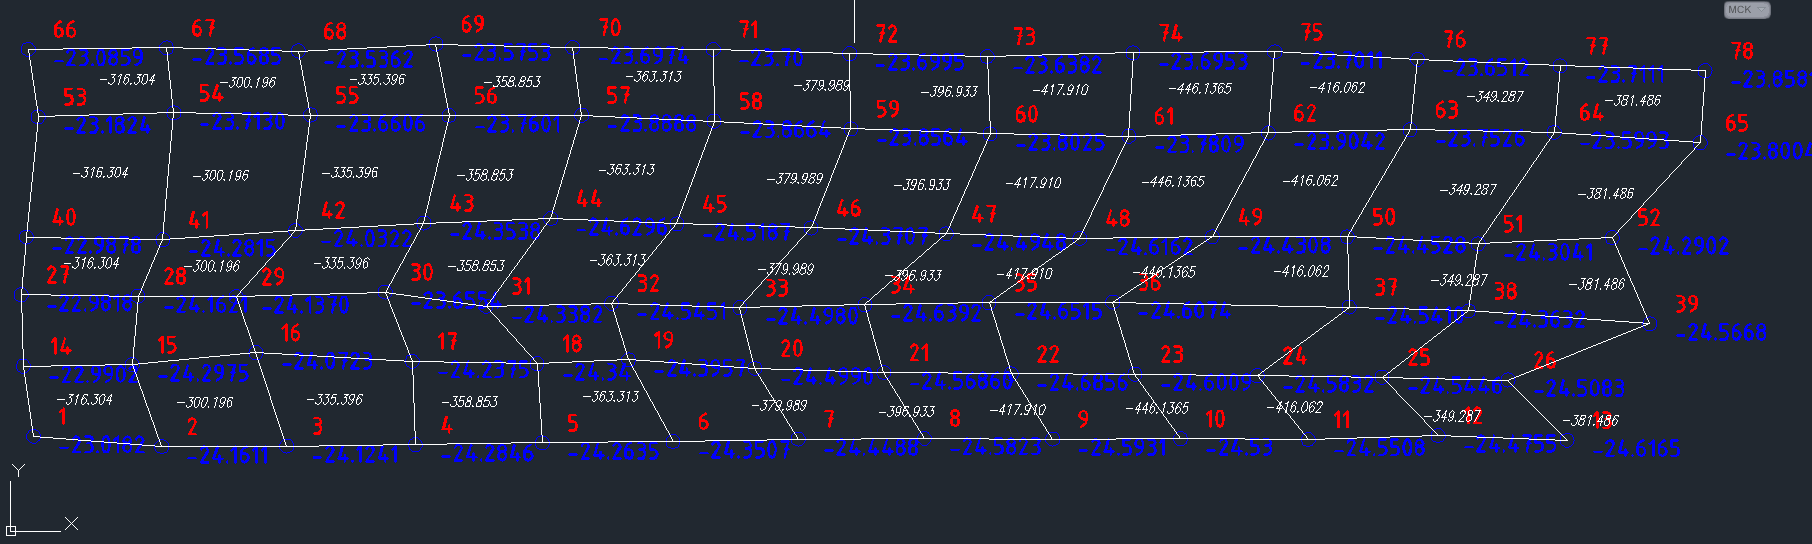
Each point has its coordinates (x, y, z-height) relative to the Baltic Sea. Four points are taken in order as shown in the previous image and the volume of the ground is calculated from the coordinates of these points, this is how all the volumes obtained on the grid are calculated, plus, and as a result we have the volume of the whole territory.
The work is very painstaking, and since I already wrote, I wanted to take on a real project, in exchange for experience. Therefore, I didn’t even consider the option that everything has been before me for a long time.
A few days I was confused on the algorithm for finding neighbors, as a result, it was not exactly what I was waiting for, the algorithm worked as I wanted due to the fact that the grid was not even as in theory, but the curve as a surveyor’s assistant walked around the field and made marks, then I realized that AutoCAD very simply sorts by point creation time. Then, having turned on AutoCAD a bit, I noticed an interesting order of uploading points to an XML file, and found the possibility of assigning each point ID, now we assigned each point a name from the left corner to the right edge and also being understood in the series above, we called all points (this is where it is faster than two days to count the volume of an area of 500x700 meters). Below is an example of such a finished file with points named in order:
In theory, volumes are counted according to Pythagoras, but the figures are completely different and, as practice shows, squares and rectangles are very rare. Therefore, I resorted to the formula of Gerona in my calculations. That is, the principle of software that I wrote is: I read an XML file, collect points, then an array with arrays of four squares, get all the figures that need to calculate the volume, now I check the sides of the figures (vector) and the corners of the rectangle and square before calculating the volume (a great rarity, in the case of our geodesist in particular, that there will be any, and if there is, then I use Pythagoras) and I just take figures like trapezoid, parallelepiped and others for the unknown four gon and consider them according to Heron’s formula, I divide the diagonally figure by two tracks olnika think of their area in the space (consider the height), height, whichever is the highest of the 4 points (as explained to me by my colleague surveyor) and plyusuya area of the two triangles below I based on the total area of the figure get its volume.
Plus, all these volumes and I get in 0.2 seconds the result to which it takes a couple of days, checked on three projects until the data converges, the program turns out even more accurate volume. We continue to test it. Now the other day I decided to tie this code to the user-friendly interface, with PyQt4, my first experience with writing graphics, below I will publish code that applies only to the GUI.
from PyQt4 import QtGui import sys import cvgLeicaXmlReader import cvgMath class myWindow(QtGui.QMainWindow): def __init__(self, parent=None): QtGui.QWidget.__init__(self, parent) self.setWindowTitle('CVG2014') self.setFixedSize(350, 350) self.setWindowIcon(QtGui.QIcon('static/Icon.png')) self.setStyleSheet("QMainWindow {background-image: url(static/background.png);}") self.directory = '' self.file = '' self.labelFilename = QtGui.QLabel('Select .XML file with points', self) self.labelFilename.setFixedWidth(300) self.labelFilename.setFixedHeight(25) self.labelFilename.move(10, 5) self.labelFilename.setStyleSheet("QLabel { background-color: white; \ border: 1px solid grey; \ color: grey;}") self.SB_WidthOfXAxis = QtGui.QSpinBox(self) self.SB_WidthOfXAxis.move(10, 35) self.SB_WidthOfXAxis.setFixedWidth(50) self.SB_WidthOfXAxis.setMaximum(9999) self.labelPointsWidth = QtGui.QLabel('Length of points on X axis', self) self.labelPointsWidth.setFixedWidth(250) self.labelPointsWidth.setFixedHeight(25) self.labelPointsWidth.move(65, 47.5) self.SB_HeightAboveSeaLevel = QtGui.QDoubleSpinBox(self) self.SB_HeightAboveSeaLevel.move(10, 75) self.SB_HeightAboveSeaLevel.setFixedWidth(50) self.SB_HeightAboveSeaLevel.setRange(-9999.99, 9999.99) self.labelPointsSeaLevel = QtGui.QLabel('Height above sea level', self) self.labelPointsSeaLevel.setFixedWidth(250) self.labelPointsSeaLevel.setFixedHeight(25) self.labelPointsSeaLevel.move(65, 87) self.buttonOpenFile = QtGui.QPushButton('...', self) self.buttonOpenFile.setFixedWidth(30) self.buttonOpenFile.setFixedHeight(27) self.buttonOpenFile.move(311, 4) self.buttonOpenFile.clicked.connect(self.getXmlFile) self.buttonGetVolume = QtGui.QPushButton('RUN', self) self.buttonGetVolume.setFixedWidth(52) self.buttonGetVolume.setFixedHeight(35) self.buttonGetVolume.move(9, 115) self.buttonGetVolume.clicked.connect(self.getVolume) self.showVolume = QtGui.QLabel('Get Vol', self) self.showVolume.setFixedWidth(140) self.showVolume.setFixedHeight(32) self.showVolume.move(72, 117) self.showVolume.setStyleSheet("QLabel { background-color: white; \ border: 1px solid grey; \ color: grey;}") def getVolume(self): xml_file = self.getFileName() points = cvgLeicaXmlReader.getPointsFromXmlFile(xml_file) if(xml_file and points): # length_of_points = len(points) QUANTITY_POINTS_AT_X_AXIS = self.SB_WidthOfXAxis.value() STATIC_HEIGHT = self.SB_HeightAboveSeaLevel.value() rows = cvgLeicaXmlReader.getRowsFromPoints(points, QUANTITY_POINTS_AT_X_AXIS) quads = cvgLeicaXmlReader.getAllQuads(rows) volumes = [] if (STATIC_HEIGHT or QUANTITY_POINTS_AT_X_AXIS) != 0: for quadrangle in quads: Quadrangle_type = cvgMath.getTypeQuadrangle(quadrangle) v = cvgMath.getVolumeQuadrangle(quadrangle, Quadrangle_type, STATIC_HEIGHT) volumes.append(v) else: volumes = 0 volumes = 0 if STATIC_HEIGHT == 0 else (round(sum(volumes), 3)) result = '-'+str(volumes) if STATIC_HEIGHT < 0 else str(volumes) result = '0' if result == '-0' else result self.showVolume.setStyleSheet("QLabel { background-color: white; \ border: 1px solid grey; \ color: grey;}") self.showVolume.setText(result) else: self.showVolume.setText('Select the correct file!') self.showVolume.setStyleSheet("QLabel { background-color: white; \ border: 1px solid grey; \ color: red; \ font-weight: bold}") def getFileName(self): return self.file def getXmlFile(self): sender = self.sender() path = QtGui.QFileDialog.getOpenFileName(sender, 'Open Xml file with points', self.directory, 'XML *.xml') fileName = path[path.rfind('/')+1:] self.directory = path[:path.rfind('/')] if(len(path) > 54): start = len(path)-54 pathSlice = path[start:] pathSlice = pathSlice[pathSlice.find('/'):] pathSlice = '..'+pathSlice else: pathSlice = path self.labelFilename.setText(pathSlice) print(len(path)) self.file = path if __name__ == '__main__': app = QtGui.QApplication(sys.argv) win = myWindow() win.show() app.exec_() With other modules, anyone interested, can be found on the githaba
I also downloaded a .rar archive with compiled code in exe for windows.
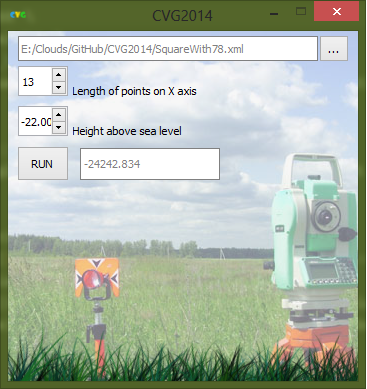
What is required of us: open an XML file with dots (two files for an example are also on a git (2 correct and one broken, for a test)), indicate the number of points along the field width, below indicate the height relative to sea level, and wait RUN button, we get the volume in the field to the right of the launch button.
To be honest, I do not know whether it is possible to use this tool in production. But I have satisfied my desire. Thank you all for your attention.
File with 65 dots (13 dots width)
File with 78 dots (13 dots width)
XML file reader
Module with mathematical calculations
Visual module
Archive with compiled code in Exe
Source: https://habr.com/ru/post/224893/
All Articles