Captain Obvious: How We Invented Google Analytics For Witget

Creating a service that will be used by different clients, each with their own tasks, requirements, level of training, it is difficult to predict exactly which features will be really relevant. Therefore, our young startup Witget.com (designer of website conversion enhancement tools - Vitzhetov), chose the most simple and necessary functions for the primary implementation. Among them: editing the parameters of the vitgeta (text, color, size), display settings (frequency and conditions) and the like. And now, being in the beta testing stage, we have already begun to listen as much as possible to our first customers, solving their specific tasks and considering requests.
One of such unexpectedly “emerging” tasks was the integration of our service with Google Analytics.
We, naive, thought that we would make excellent internal statistics, where the site owner would see how many times each page was shown, how many times it was clicked / filled in the form / watched the video, how many times it was closed or ignored.
Such statistics suggests the ability to show a vitget conversion: for example, the number of completed contact collection forms to the number of their impressions, select the most effective widgets for display, do A / B testing.
Statistics, in perfect condition, have our hands, of course, until we reach them. Although we started “catching” events almost immediately after launching the service, accumulating statistics. But the output of information in a readable form was postponed every time to “after this remarkable functional.”
It was an unexpected discovery for our team that we did not receive a single request from customers to “complete internal statistics”! On the contrary, we are increasingly being asked to integrate with Google Analytics.
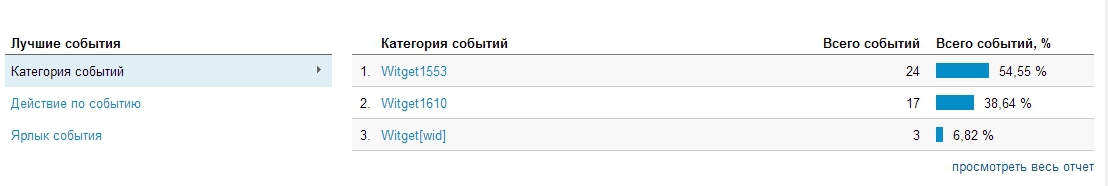
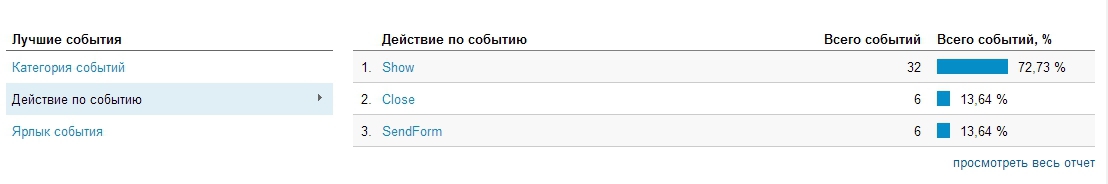
No sooner said than done! Now the Google counter installed on the page of the vittset gives the following result:
- The ID of the threadset is recorded in the “Event Category”:
- In the “Actions”, the events of the display are shown, such as showing, closing, filling the form and everything your heart desires:
- In addition to events, virtual pages are generated:
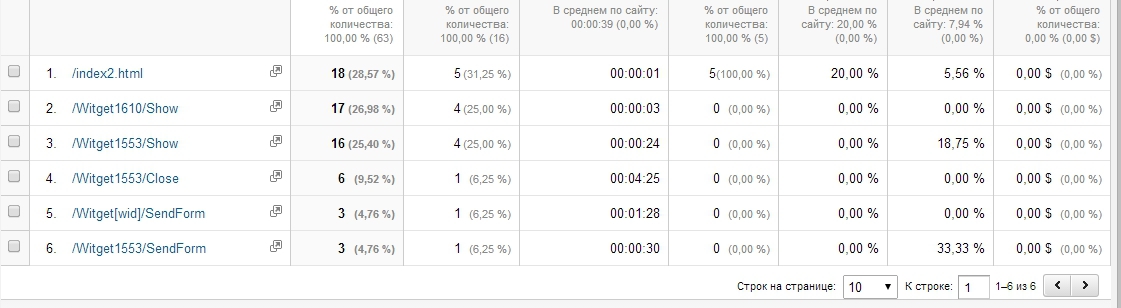
- Virtual pages allow you to build sales funnels and view a user’s visit card:

Thanks to the integration of Witget with Google Analytics, it became possible to track the full statistics of use of widgets: from the key phrase that a user came to the site to before the fact of making a purchase!
The following very simple, but nonetheless characteristic case was used to analyze the effectiveness of the form that pops up when the user tries to leave the site.

The experiment was conducted on the May holidays, the source of traffic - contextual advertising. In the period from May 1 to May 5, 2,024 visitors came to the client's site, 70% of them were new. The usual for this online store conversion to a callback order from the site has been preserved - about 0.07%. But to them were added applications from the callback “Order a callback” - 9 pieces in 5 days. Conclusion - the conversion to calls ordered from the site has grown. Given that the whiteller appeared only when the user exited, that is, without this whip, the visitor most likely would have been simply “lost”.
Total we have:
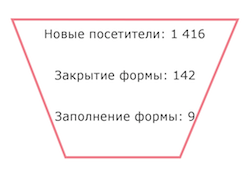
Thanks to the integration of Witget with Google Analytics, such a funnel can be schematically constructed in a similar form (the figures below are not from this example):
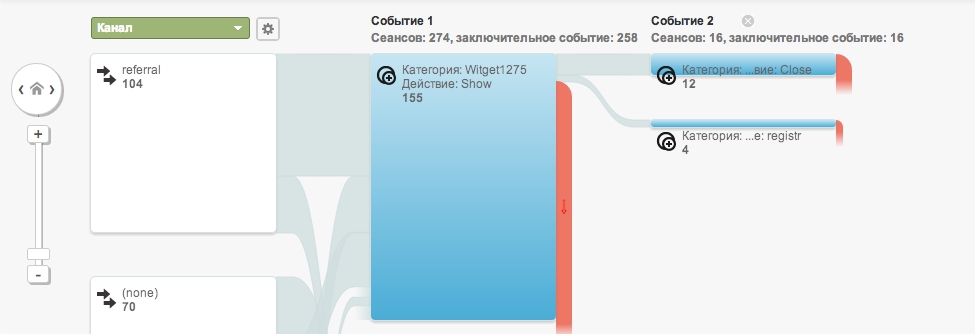
You can find this finished report in the Analytics menu “Reports - Behavior - Event - Event Map”.
Voila! All the powerful tools from Google became available for a detailed analysis of the effectiveness of Vitzheta on the client's website.
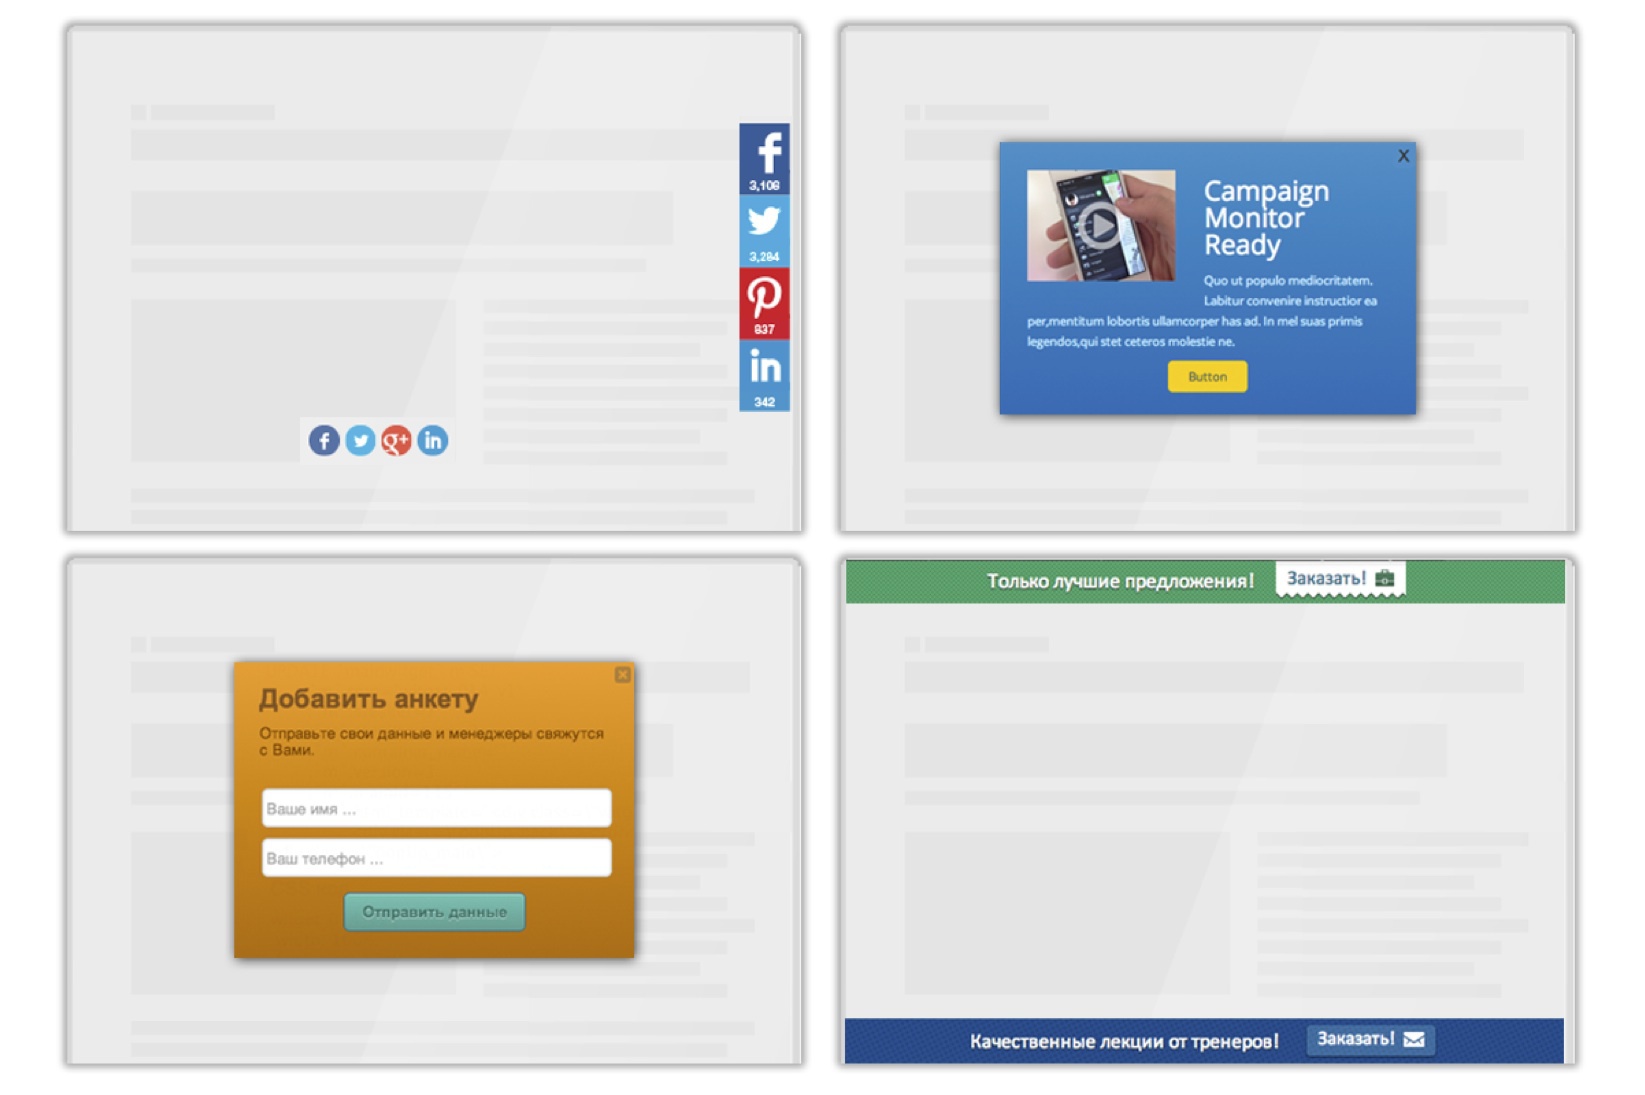
Specificity of the Witget.com service does not allow, unfortunately, to implement the functionality of Google Analytics for absolutely all of the vitjet templates contained in the gallery by one update. But already now in our gallery appeared patterns of vitzhetov, the events for which are "considered" in analytics:

Of course, we cannot do without internal analytics of the effectiveness of specific vitzhet when working on the functionality of the autobroker and A / B testing. But this is still in the plans for “after this wonderful functional” ...

')
Source: https://habr.com/ru/post/224251/
All Articles