YARG - open-source library for generating reports
Virtually every developer who creates information systems faces the need to generate various reports and print forms. This is typical for most applications developed on our platform . For example, in the system I am working on at the moment, there are 264. In order not to write the logic of generating reports from scratch each time, we developed a special library (under the cat we will explain why the existing ones did not fit us). It is called YARG - Yet Another Report Generator.
YARG allows you to:
This library is used in the CUBA platform as a basis for the report engine. We have been developing it since 2010, but just recently decided to make it open, and uploaded its code to GitHub with the Apache 2.0 license.
This article is meant to draw community attention to it.
The library is based on a simple idea of separating the data sample and displaying the data into a report (data layer & presentation layer). Data sampling is described by various scripts, and the data display is configured directly in the template documents. At the same time, in order to create a template, no special tools are required, it is enough to have Open Office or Microsoft Office at hand.
The report consists of the so-called bands. A strip is both a dataset and a region in a template where this data is displayed (connects the data layer and presentation layer).
')
Consider first an example in the style of Hello World.
Imagine that we have a company and we need to display a list of all employees of the company, indicating the position of the employee.
We create a report bar with the name Staff in which we indicate that the data is loaded with a SQL query.
Java code
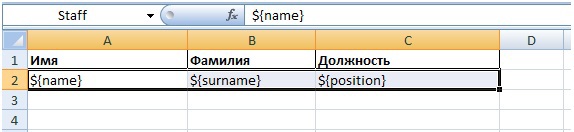
Next, we create an xls-template in which we mark the named Staff region and arrange aliases in the cells.
Examples are more complicated below.
A few years ago, we had a need for mass reporting in one of our projects. It was necessary to create reports in the XLS and DOC format, as well as convert the result from DOC and XLS to PDF. We needed the library:
At first, we tried to use JasperReports, but, firstly, it does not know how to create DOC reports (there is a paid library for this), secondly, its ability to generate XLS reports is very limited (it’s impossible to use graphs, formulas, cell formats) and, thirdly, the creation of templates requires certain skills and special tools, and to describe the data load, you need to write Java code. There were also many libraries concentrating on a particular format, but we did not find a single library.
Therefore, we decided to create a mechanism that allows us to describe reports uniformly, regardless of the type of template and the method of data loading.
To work with XLS, even then there were many different libraries (POI-HSSF, JXLS, etc.) and it was decided to use Apache POI, as the most popular at that time. But to work with DOC files of this diversity was not observed. There were quite a few options: use UNO Runtime - API for integration with the Open Office server or work with DOC files through COM objects. The POI-HWPF project was in its infancy at that time (it is not far from now). We decided to use the integration with Open Office, because we saw a lot of positive feedback from people who have successfully integrated with Open Office in completely different languages (Python, Ruby, C #).
If with POI-HSSF everything was more or less simple (except for the complete lack of the ability to work with graphs), then with the UNO Runtime we had to face many problems.
For a long time, we used only XLS and DOC templates, but then it was decided to support also XLSX and DOCX. The choice fell on the library DOCX4J, which by that time gained popularity.
An important advantage of this library for us is that it provides low-level access to the structure of the document (actually operating with XML). On the one hand, this somewhat complicated the code and logic, and on the other, it opened up almost limitless possibilities for managing the document, since any operations on it were now possible.
Even more serious advantage was the ability to refuse to run Open Office to generate DOCX reports.
Imagine that we have a bookstore. Let's try with the help of our library to make a report that displays in XLS a list of stores and a list of books sold in each of the stores.
Imagine also that we (store owners) do not know the Java programming language at all, but fortunately our system administrator is familiar with SQL, and we even have a database containing information about all sales.
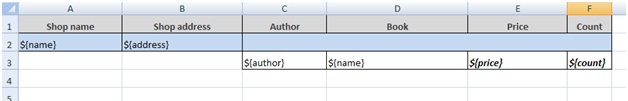
First, let's create a report template in xls format. Immediately mark the report bands using named regions.
Then we describe the loading of data using SQL.
Now we have to describe the report using XML.
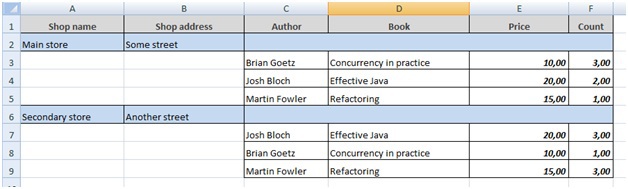
Running the report from the command line, we get the following document.
In this report, we see that one lane can refer to another. The Book band refers to the Shop bar, so for each store we select a list of books sold in it. Book Bar is nested in Shop.
Now imagine that our store received a large order and we need to invoice the customer. Let's try to create a report in which a DOCX document is used as a template, and the result is converted to PDF. Data loading for a variety of describe Groovy-script.
You may notice that the Groovy script returns a list of associative arrays as a result (more precisely, List <Map <String, Object> ). Thus, each element of the list is a string with named data (the key is the name of the parameter, the value is the parameter).
Now create an invoice template. In the table above we put the name and address of the client, as well as the date of the invoice.
Next, create a table with a list of goods for which the invoice. In order for table 2 to be linked to the list of products, we insert a special marker (## band = Items) into the first cell.

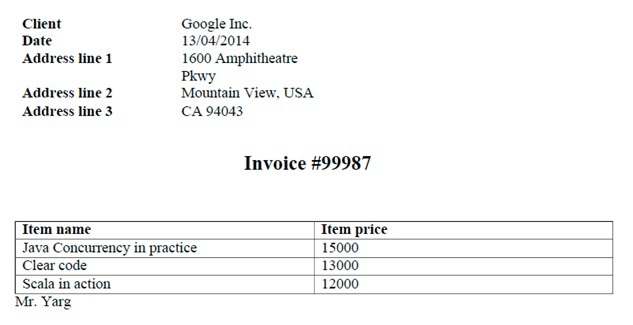
Running the report, we will see the following.
The library was originally designed for expansion and integration into various applications. An example of such integration is the use of YARG in the CUBA platform. We use Spring as an IoC framework. Let's see how YARG can be built into Spring.
The main bean in this description is reporting_lib_Reporting. It provides access to the main functionality of the library - the creation of reports. For normal operation, it is necessary to define a factory of formatters (working with different types of documents - DOCX, XLSX, DOC, etc.) and a factory of loaders (loading data). Also, if you are going to use DOC reports, you must set the reporting_lib_OfficeIntegration bin, which is responsible for integrating with Open Office (with which the DOC and ODT reports are processed).
It should be noted that to add, for example, a new loader, you do not need to redefine any library classes; it is enough to add it to the description of the dataLoaders property in the reporting_lib_LoaderFactory bean. What we basically did was by adding the jpql data loader ( <entry key = "jpql" value-ref = "reporting_lib_JpqlDataLoader" /> ).
For more serious changes, you can inherit library classes or create your own from scratch, implementing the provided interfaces. Virtually all library functionality is connected through interfaces and is easily extended.
Another feature of the YARG library is that it can be used as a standalone application for generating reports. Thus, having the JRE installed on your computer, you can generate reports from the command line. For example, you have a server application in PHP and you want to generate XLS reports. You just need to create an XLS-template, XML-description of the report and then you can generate a report using a simple console command.
Command example:
To conclude, here are some UI screenshots provided by the CUBA platform for creating reports on the YARG engine:
And an example of a report with graphs:
YARG allows you to:
- Generate a report in a template format or convert the result to PDF;
- Create report templates in the usual and common formats: DOC, ODT, XLS, DOCX, XLSX, HTML;
- Create complex XLS and XLSX templates: with nested data areas, graphs, formulas, etc .;
- Use images and HTML markup in reports;
- Store report structure in XML format;
- Run the standalone application for generating reports, which makes it possible to use the library outside the Java ecosystem (for example, to generate reports in PHP);
- Integrate with IoC frameworks (Spring, Guice).
This library is used in the CUBA platform as a basis for the report engine. We have been developing it since 2010, but just recently decided to make it open, and uploaded its code to GitHub with the Apache 2.0 license.
This article is meant to draw community attention to it.
The library is based on a simple idea of separating the data sample and displaying the data into a report (data layer & presentation layer). Data sampling is described by various scripts, and the data display is configured directly in the template documents. At the same time, in order to create a template, no special tools are required, it is enough to have Open Office or Microsoft Office at hand.
The report consists of the so-called bands. A strip is both a dataset and a region in a template where this data is displayed (connects the data layer and presentation layer).
')
Consider first an example in the style of Hello World.
Very simple example
Imagine that we have a company and we need to display a list of all employees of the company, indicating the position of the employee.
We create a report bar with the name Staff in which we indicate that the data is loaded with a SQL query.
select name, surname, position from staff Java code
ReportBuilder reportBuilder = new ReportBuilder(); ReportTemplateBuilder reportTemplateBuilder = new ReportTemplateBuilder() .documentPath("/home/haulmont/templates/staff.xls") .documentName("staff.xls") .outputType(ReportOutputType.xls) .readFileFromPath(); reportBuilder.template(reportTemplateBuilder.build()); BandBuilder bandBuilder = new BandBuilder(); ReportBand staff= bandBuilder.name("Staff") .query("Staff", "select name, surname, position from staff", "sql") .build(); reportBuilder.band(staff); Report report = reportBuilder.build(); Reporting reporting = new Reporting(); reporting.setFormatterFactory(new DefaultFormatterFactory()); reporting.setLoaderFactory( new DefaultLoaderFactory().setSqlDataLoader(new SqlDataLoader(datasource))); ReportOutputDocument reportOutputDocument = reporting.runReport( new RunParams(report), new FileOutputStream("/home/haulmont/reports/staff.xls")); Next, we create an xls-template in which we mark the named Staff region and arrange aliases in the cells.
Examples are more complicated below.
A bit of history
A few years ago, we had a need for mass reporting in one of our projects. It was necessary to create reports in the XLS and DOC format, as well as convert the result from DOC and XLS to PDF. We needed the library:
- allowed to create reports (at least report templates) for regular users;
- supported downloading data from various sources;
- supported various template formats (XLS, DOC, HTML);
- supported the conversion of reports to PDF;
- was extensible (allowed the rapid addition of new ways to load data and new template formats);
- easy to integrate into various IoC containers.
At first, we tried to use JasperReports, but, firstly, it does not know how to create DOC reports (there is a paid library for this), secondly, its ability to generate XLS reports is very limited (it’s impossible to use graphs, formulas, cell formats) and, thirdly, the creation of templates requires certain skills and special tools, and to describe the data load, you need to write Java code. There were also many libraries concentrating on a particular format, but we did not find a single library.
Therefore, we decided to create a mechanism that allows us to describe reports uniformly, regardless of the type of template and the method of data loading.
The first steps
To work with XLS, even then there were many different libraries (POI-HSSF, JXLS, etc.) and it was decided to use Apache POI, as the most popular at that time. But to work with DOC files of this diversity was not observed. There were quite a few options: use UNO Runtime - API for integration with the Open Office server or work with DOC files through COM objects. The POI-HWPF project was in its infancy at that time (it is not far from now). We decided to use the integration with Open Office, because we saw a lot of positive feedback from people who have successfully integrated with Open Office in completely different languages (Python, Ruby, C #).
If with POI-HSSF everything was more or less simple (except for the complete lack of the ability to work with graphs), then with the UNO Runtime we had to face many problems.
- There is no distinct API for working with tables. For example, to copy a table row, you need to use the system clipboard (selecting a line, copying and pasting it in the right place).
- For each report generation, the Open Office process is spawned (and destroyed after printing). Initially, we used the bootstrapconnector library to spawn processes, but soon we were convinced that in many cases it left the process alive (in a hung state) or did not attempt to complete the process at all, which led to the collapse of the system over time. We had to rewrite the logic of launching and destroying Open Office processes, taking advantage of the experience of the guys who wrote jodconverter.
- UNO Runtime (and the Open Office server itself) has thread-safety problems, which can cause the server to hang or suddenly stop due to an internal error under load. This led to the fact that I had to do a mechanism for re-launching reports (if the report was not printed, try printing it again). This naturally affects the speed of this type of reports.
Docx4j
For a long time, we used only XLS and DOC templates, but then it was decided to support also XLSX and DOCX. The choice fell on the library DOCX4J, which by that time gained popularity.
An important advantage of this library for us is that it provides low-level access to the structure of the document (actually operating with XML). On the one hand, this somewhat complicated the code and logic, and on the other, it opened up almost limitless possibilities for managing the document, since any operations on it were now possible.
Even more serious advantage was the ability to refuse to run Open Office to generate DOCX reports.
The example is more complicated
Imagine that we have a bookstore. Let's try with the help of our library to make a report that displays in XLS a list of stores and a list of books sold in each of the stores.
Imagine also that we (store owners) do not know the Java programming language at all, but fortunately our system administrator is familiar with SQL, and we even have a database containing information about all sales.
First, let's create a report template in xls format. Immediately mark the report bands using named regions.
Then we describe the loading of data using SQL.
select shop.id as "id", shop.name as "name", shop.address as "address" from store shop select book.author as "author", book.name as "name", book.price as "price", count(*) as "count" from book book where book.store_id = ${Shop.id} group by book.author, book.name, book.price Now we have to describe the report using XML.
<?xml version="1.0" encoding="UTF-8"?> <report name="report"> <templates> <template code="DEFAULT" documentName="bookstore.xls" documentPath="./test/sample/bookstore/bookstore.xls" outputType="xls" outputNamePattern="bookstore.xls"/> </templates> <rootBand name="Root" orientation="H"> <bands> <band name="Header" orientation="H"/> <band name="Shop" orientation="H"> <bands> <band name="Book" orientation="H"> <queries> <query name="Book" type="sql"> <script> select book.author as "author", book.name as "name", book.price as "price", count(*) as "count" from book where book.store_id = ${Shop.id} group by book.author, book.name, book.price </script> </query> </queries> </band> </bands> <queries> <query name="Shop" type="sql"> <script> select shop.id as "id", shop.name as "name", shop.address as "address" from store shop </script> </query> </queries> </band> </bands> <queries/> </rootBand> </report> Running the report from the command line, we get the following document.
In this report, we see that one lane can refer to another. The Book band refers to the Shop bar, so for each store we select a list of books sold in it. Book Bar is nested in Shop.
Another example
Now imagine that our store received a large order and we need to invoice the customer. Let's try to create a report in which a DOCX document is used as a template, and the result is converted to PDF. Data loading for a variety of describe Groovy-script.
<?xml version="1.0" encoding="UTF-8"?> <report name="report"> <templates> <template code="DEFAULT" documentName="invoice.docx" documentPath="./test/sample/invoice/invoice.docx" outputType="pdf" outputNamePattern="invoice.pdf"/> </templates> <formats> <format name="Main.date" format="dd/MM/yyyy"/> <format name="Main.signature" format="${html}"/> </formats> <rootBand name="Root" orientation="H"> <bands> <band name="Main" orientation="H"> <queries> <query name="Main" type="groovy"> <script> return [ [ 'invoiceNumber':99987, 'client' : 'Google Inc.', 'date' : new Date(), 'addLine1': '1600 Amphitheatre Pkwy', 'addLine2': 'Mountain View, USA', 'addLine3':'CA 94043', 'signature':<![CDATA['<html><body><b><font color="red">Mr. Yarg</font></b></body></html>']]> ]] </script> </query> </queries> </band> <band name="Items" orientation="H"> <queries> <query name="Main" type="groovy"> <script> return [ ['name':'Java Concurrency in practice', 'price' : 15000], ['name':'Clear code', 'price' : 13000], ['name':'Scala in action', 'price' : 12000] ] </script> </query> </queries> </band> </bands> <queries/> </rootBand> </report> You may notice that the Groovy script returns a list of associative arrays as a result (more precisely, List <Map <String, Object> ). Thus, each element of the list is a string with named data (the key is the name of the parameter, the value is the parameter).
Now create an invoice template. In the table above we put the name and address of the client, as well as the date of the invoice.
Next, create a table with a list of goods for which the invoice. In order for table 2 to be linked to the list of products, we insert a special marker (## band = Items) into the first cell.
Running the report, we will see the following.
Integration and extension of functionality
The library was originally designed for expansion and integration into various applications. An example of such integration is the use of YARG in the CUBA platform. We use Spring as an IoC framework. Let's see how YARG can be built into Spring.
<bean id="reporting_lib_Scripting" class="com.haulmont.reports.libintegration.ReportingScriptingImpl"/> <bean id="reporting_lib_GroovyDataLoader" class="com.haulmont.yarg.loaders.impl.GroovyDataLoader"> <constructor-arg ref="reporting_lib_Scripting"/> </bean> <bean id="reporting_lib_SqlDataLoader" class="com.haulmont.yarg.loaders.impl.SqlDataLoader"> <constructor-arg ref="dataSource"/> </bean> <bean id="reporting_lib_JpqlDataLoader" class="com.haulmont.reports.libintegration.JpqlDataDataLoader"/> <bean id="reporting_lib_OfficeIntegration" class="com.haulmont.reports.libintegration.CubaOfficeIntegration"> <constructor-arg value="${cuba.reporting.openoffice.path?:/}"/> <constructor-arg> <list> <value>8100</value> <value>8101</value> <value>8102</value> <value>8103</value> </list> </constructor-arg> <property name="displayDeviceAvailable"> <value>${cuba.reporting.displayDeviceAvailable?:false}</value> </property> <property name="timeoutInSeconds"> <value>${cuba.reporting.openoffice.docFormatterTimeout?:20}</value> </property> </bean> <bean id="reporting_lib_FormatterFactory" class="com.haulmont.yarg.formatters.factory.DefaultFormatterFactory"> <property name="officeIntegration" ref="reporting_lib_OfficeIntegration"/> </bean> <bean id="reporting_lib_LoaderFactory" class="com.haulmont.yarg.loaders.factory.DefaultLoaderFactory"> <property name="dataLoaders"> <map> <entry key="sql" value-ref="reporting_lib_SqlDataLoader"/> <entry key="groovy" value-ref="reporting_lib_GroovyDataLoader"/> <entry key="jpql" value-ref="reporting_lib_JpqlDataLoader"/> </map> </property> </bean> <bean id="reporting_lib_Reporting" class="com.haulmont.yarg.reporting.Reporting"> <property name="formatterFactory" ref="reporting_lib_FormatterFactory"/> <property name="loaderFactory" ref="reporting_lib_LoaderFactory"/> </bean> The main bean in this description is reporting_lib_Reporting. It provides access to the main functionality of the library - the creation of reports. For normal operation, it is necessary to define a factory of formatters (working with different types of documents - DOCX, XLSX, DOC, etc.) and a factory of loaders (loading data). Also, if you are going to use DOC reports, you must set the reporting_lib_OfficeIntegration bin, which is responsible for integrating with Open Office (with which the DOC and ODT reports are processed).
It should be noted that to add, for example, a new loader, you do not need to redefine any library classes; it is enough to add it to the description of the dataLoaders property in the reporting_lib_LoaderFactory bean. What we basically did was by adding the jpql data loader ( <entry key = "jpql" value-ref = "reporting_lib_JpqlDataLoader" /> ).
For more serious changes, you can inherit library classes or create your own from scratch, implementing the provided interfaces. Virtually all library functionality is connected through interfaces and is easily extended.
Standalone mode
Another feature of the YARG library is that it can be used as a standalone application for generating reports. Thus, having the JRE installed on your computer, you can generate reports from the command line. For example, you have a server application in PHP and you want to generate XLS reports. You just need to create an XLS-template, XML-description of the report and then you can generate a report using a simple console command.
Command example:
yarg -rp ~/report.xml -op ~/result.xls “-Pparam1=20/04/2014” Conclusion
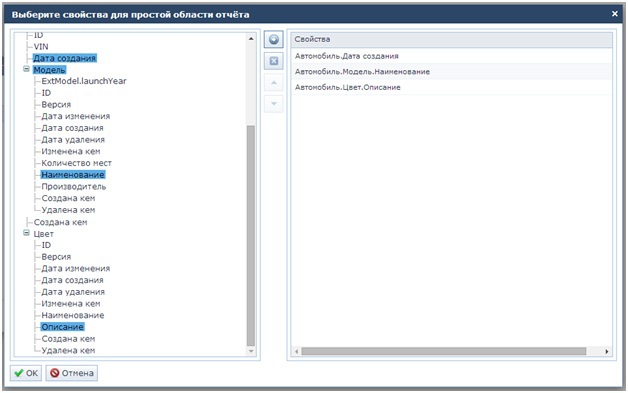
To conclude, here are some UI screenshots provided by the CUBA platform for creating reports on the YARG engine:
Fragments of the report editor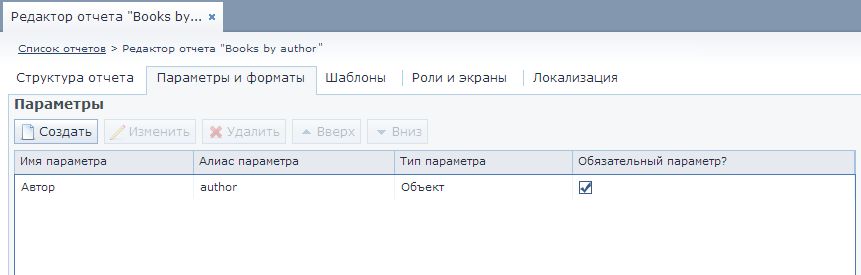

Report Creation Wizard


And an example of a report with graphs:
Report with graphs
Report template with graph and chart:
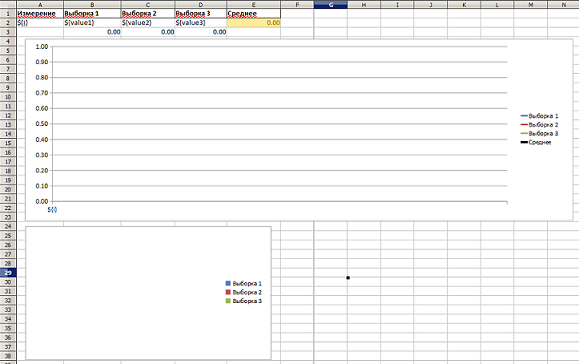
The ready report with the schedule and the chart

The ready report with the schedule and the chart
Source: https://habr.com/ru/post/224125/
All Articles