The basic principles of setting up the Garbage Collection from scratch
In this article I would not want to focus on the principle of the garbage collector - this is beautifully and clearly described here: habrahabr.ru/post/112676 . I want to go more to the practical bases and quantitative characteristics of setting up the Garbage Collection in the JVM - and try to understand how effective this can be.
Consider the following indicators:
')
As a rule, the listed characteristics are compromise and the improvement of one of them leads to costs for the rest. For most applications, all three characteristics are important, but often one or two are more important to the application — this will be the starting point for customization.
Consider three basic fundamental rules for understanding GC customization:
Consider an example of a simple application (which, for example, can emulate a web application, during which the database is accessed and the return result is accumulated), in which the makeObjects () method is accessed in several threads, during which a loop is continuously formed an object occupying a certain volume in the heap, then any calculations take place with it - a delay is made, the reference to the object does not flow away from the method, and upon its completion the GC can understand that this object is to be cleaned.
The experiment lasts for some time, then to assess the effectiveness we will use the total delay time caused by the garbage collector. The delay is necessary so that after the final marking of objects for deletion there is no reference to the object being cleaned. The fact that there is jvm, which can mark and clear objects without causing a “stop-the-world” pause and how various types of GCs function - described in detail here habrahabr.ru/post/148322 - we do not consider this option.
We will run the experiment on:
For which by default the mode is enabled - server and UseParallelGC (multi-stream operation of the small garbage collection phase)
To estimate the total amount of pause, the garbage collector can be run in the mode:
And summarize the delay in the gc.log:
Where real = 0.01 secs is the real time spent on the build.
Or, you can use the VisualVm utility, with the VisualGC plugin installed, in which you can visually observe the memory distribution in different GC areas (Eden, Survivor1, Survivor2, Old) and see statistics on the launch and duration of garbage collection.
To begin with, we have to start the application with the largest possible memory size than the application really needs. If we do not initially know how much our application will occupy in memory - you can run the application without specifying -Xmx and -Xms and HotSpot VM will choose the size of the memory itself. If at the start of the application we get OutOfMemory (Java heap space or PermGen space), then we can iteratively increase the amount of available memory (-Xmx or -XX: PermSize) until the errors go away.
The next step is to calculate the size of the long-lived live data - the size of the old and permanent heap areas after the full garbage collection phase. This size is an approximate amount of memory necessary for the functioning of the application. As a rule, the size of the necessary memory for the application -Xms and -Xmx is 3-4 times larger than the amount of live data. So, for the log mentioned above, the value of the old region after the full garbage collection phase is 349363K. Then the suggested value is -Xmx and -Xms ~ 1400 MB. -XX: PermSize and -XX: MaxPermSize - 1.5 times more than PermGenSize after the full garbage collection phase - 13324K ~ 20 MB. The size of the young generation is assumed to be 1-1.5 of the size of the live data ~ 525 MB. Then we get the jvm launch line with the following parameters:
In VisualVm we get the following picture:
In just 30 seconds, the experiment produced 54 assemblies — 31 small and 23 full assemblies — with a total stopping time of 3.227c. This amount of delay may not meet the necessary requirements - see if we can improve the situation without changing the application code.
The following parameters must be measured and taken into account when setting the response time:
The time required for the implementation of the phase of small garbage collection directly depends on the number of objects in the young generation, the smaller its size - the shorter the duration, but the frequency increases, since the area starts to fill more often. Let's try to reduce the time of each small assembly, reducing the size of the young generation, while maintaining the size of the old generation. Approximately, we can estimate that every second we have to clear 50 young people * 8 objects * 1MB ~ 400MB in young generation. Run with parameters:
In VisualVm we get the following picture:

We could not influence the total time of small garbage collection - 1,533s - the frequency of small assemblies increased, but the total time worsened - 3,661 due to the fact that the filling rate of the old generation increased and the frequency of the full garbage collection call increased. To overcome this - try to increase the size of the old generation - run jvm with the parameters:
The total pause has now improved and is 2.637 s and the total value required for the application of memory has decreased, thus iteratively finding the right balance between old and young generation for distributing the lifetime of objects in a particular application.
If the delay time still does not suit us - you can go to the concurrent garbage collector by turning on the -XX option: + UseConcMarkSweepGC is an algorithm that will try to perform the main work of marking objects for deletion in a separate stream in parallel to the application threads.
ConcMarkSweep GC requires more careful tuning, - one of the main goals is to reduce the number of stop-the-world pauses in the absence of sufficient space in the old generation for the location of objects - because this phase takes on average more time than the full garbage collection phase with throughCc. As a result, the duration of the worst case of garbage collection may increase, it is necessary to avoid frequent overflows of the old generation. As a rule, when switching to ConcMarkSweep GC, it is recommended to increase the size of the old generation by 20-30% - run jvm with the parameters:

The total pause was reduced to 1,923 with.
Below the graph, you can see the distribution of the application's memory by the number of transitions between the Eden, Survivor1 and Survivor2 stages before they get into Old Generation. The fact is that one of the ways to reduce the number of overflows of the old generation in the ConcMarkSweep GC is to prevent the direct flow of objects from the young generation directly to the old - bypassing the survivor area.
To track the distribution of objects in stages, you can run jvm with the -XX: + PrintTenuringDistribution option.
In gc.log we can observe:
The total size of survivor objects is 40900584, the CMS defaults to using the 50% barrier to occupancy of the survivor area. Thus we obtain the size of the region ~ 80 MB. When you run jvm, it is specified by the -XX: SurvivorRatio parameter, which is determined from the formula:
Get
Wanting to leave the size of eden space the same - we get:

The distribution is better, but the total time has not changed much due to the specifics of the application, the fact is that after frequent small garbage collections, the size of the surviving objects is always larger than the available size of survivor areas, so in our case we can donate the correct distribution to suit eden size space:
As a result, we were able to reduce the size of the total pause from 3.227 seconds to 1.481 seconds by 30 s of the experiment, while slightly increasing the total memory consumption. Whether it is a lot or a little depends on the specific specifics, in particular, given the tendency to reduce the cost of physical memory and the principle of maximizing used memory, it is still important to find a balance between different areas of the GC and this process is more creative than scientific.
Quantitative characteristics of the evaluation of the effectiveness of GC
Consider the following indicators:
- Bandwidth A measure that determines the ability of an application to operate at peak load, regardless of the pauses during the build and the size of the required memory.
- Response time Measure GC, which determines the ability of the application to cope with the number of stops and fluctuations in the work of GC
- Size of memory in use Size of memory that is necessary for effective GC operation
')
As a rule, the listed characteristics are compromise and the improvement of one of them leads to costs for the rest. For most applications, all three characteristics are important, but often one or two are more important to the application — this will be the starting point for customization.
Basic GC Customization
Consider three basic fundamental rules for understanding GC customization:
- It is necessary to strive to ensure that the maximum number of objects is cleared when running a small GC (minor grabage collection). This principle reduces the number and frequency of the full garbage collection — whose work is the main reason for the large delays in the application.
- The more memory is allocated to the application, the better the garbage collection works and the better the quantitative characteristics of throughput and response time are achieved.
- Only 2 of 3 quantitative characteristics — bandwidth, response time, the size of the allocated memory — can be effectively configured; effective value of the size of the required memory is understood as minimizing it
Consider an example of a simple application (which, for example, can emulate a web application, during which the database is accessed and the return result is accumulated), in which the makeObjects () method is accessed in several threads, during which a loop is continuously formed an object occupying a certain volume in the heap, then any calculations take place with it - a delay is made, the reference to the object does not flow away from the method, and upon its completion the GC can understand that this object is to be cleaned.
package ru.skuptsov; import java.util.ArrayList; import java.util.List; import java.util.concurrent.ExecutorService; import java.util.concurrent.Executors; public class MemoryConsumer implements Runnable { private static final int OBJECT_SIZE = 1024 * 1024; private static final int OBJECTS_NUMBER = 8; private static final int ADD_PROCESS_TIME = 1000; private static final int NUMBER_OF_REQUEST_THREADS = 50; private static final long EXPERIMENT_TIME = 30000; private static volatile boolean stop = false; public static void main(String[] args) throws InterruptedException { start(); Thread.sleep(EXPERIMENT_TIME); stop(); } private static void start() { ExecutorService execService = Executors.newCachedThreadPool(); for (int i = 0; i < NUMBER_OF_REQUEST_THREADS; i++) execService.execute(new MemoryConsumer()); } private static void stop() { stop = true; } @Override public void run() { while (true && !stop) { makeObjects(); } } private void makeObjects() { List<byte[]> objectList = new ArrayList<byte[]>(); for (int i = 0; i < OBJECTS_NUMBER; i++) { objectList.add(new byte[OBJECT_SIZE]); } try { Thread.sleep(ADD_PROCESS_TIME); } catch (InterruptedException e) { e.printStackTrace(); } } } The experiment lasts for some time, then to assess the effectiveness we will use the total delay time caused by the garbage collector. The delay is necessary so that after the final marking of objects for deletion there is no reference to the object being cleaned. The fact that there is jvm, which can mark and clear objects without causing a “stop-the-world” pause and how various types of GCs function - described in detail here habrahabr.ru/post/148322 - we do not consider this option.
We will run the experiment on:
C:\>java -XX:+PrintCommandLineFlags -version -XX:MaxHeapSize=4290607104 -XX:ParallelGCThreads=8 -XX:+PrintCommandLineFlags -XX:-UseLargePagesIndividualAllocation -XX:+UseParallelGC java version "1.6.0_16" Java(TM) SE Runtime Environment (build 1.6.0_16-b01) Java HotSpot(TM) 64-Bit Server VM (build 14.2-b01, mixed mode) For which by default the mode is enabled - server and UseParallelGC (multi-stream operation of the small garbage collection phase)
To estimate the total amount of pause, the garbage collector can be run in the mode:
java -XX:+PrintGCTimeStamps -XX:+PrintGCDetails -verbose:gc -Xloggc:gc.log ru.skuptsov.MemoryConsumer And summarize the delay in the gc.log:
0.167: [Full GC [PSYoungGen: 21792K->13324K(152896K)] [PSOldGen: 341095K->349363K(349568K)] 362888K->362687K(502464K) [PSPermGen: 2581K->2581K(21248K)], 0.0079385 secs] [Times: user=0.01 sys=0.00, real=0.01 secs] Where real = 0.01 secs is the real time spent on the build.
Or, you can use the VisualVm utility, with the VisualGC plugin installed, in which you can visually observe the memory distribution in different GC areas (Eden, Survivor1, Survivor2, Old) and see statistics on the launch and duration of garbage collection.
Determining the size of the required memory
To begin with, we have to start the application with the largest possible memory size than the application really needs. If we do not initially know how much our application will occupy in memory - you can run the application without specifying -Xmx and -Xms and HotSpot VM will choose the size of the memory itself. If at the start of the application we get OutOfMemory (Java heap space or PermGen space), then we can iteratively increase the amount of available memory (-Xmx or -XX: PermSize) until the errors go away.
The next step is to calculate the size of the long-lived live data - the size of the old and permanent heap areas after the full garbage collection phase. This size is an approximate amount of memory necessary for the functioning of the application. As a rule, the size of the necessary memory for the application -Xms and -Xmx is 3-4 times larger than the amount of live data. So, for the log mentioned above, the value of the old region after the full garbage collection phase is 349363K. Then the suggested value is -Xmx and -Xms ~ 1400 MB. -XX: PermSize and -XX: MaxPermSize - 1.5 times more than PermGenSize after the full garbage collection phase - 13324K ~ 20 MB. The size of the young generation is assumed to be 1-1.5 of the size of the live data ~ 525 MB. Then we get the jvm launch line with the following parameters:
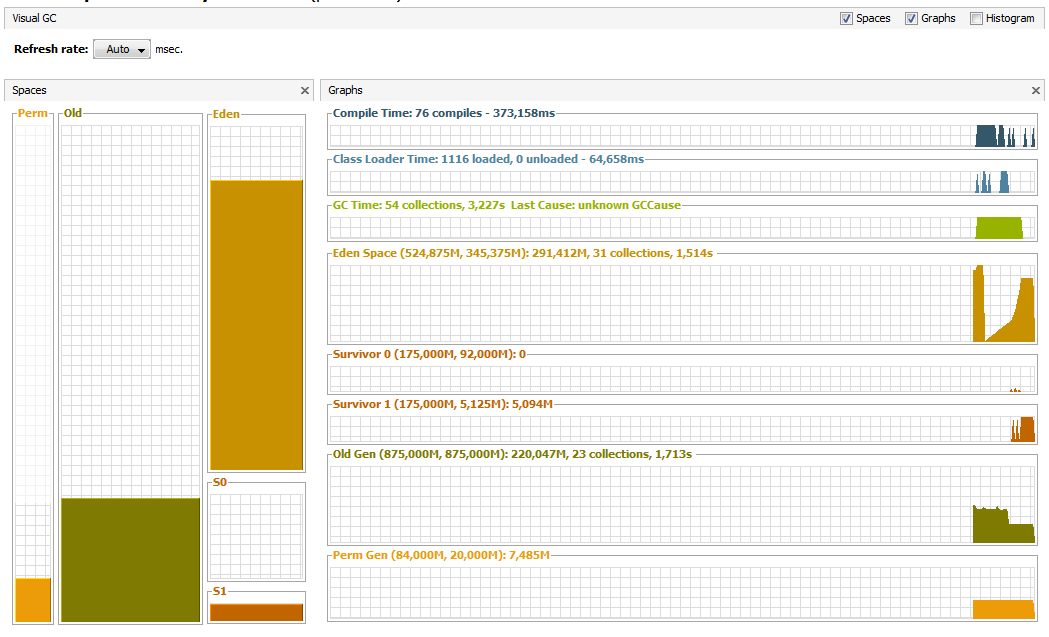
java -Xms1400m -Xmx1400m -Xmn525m -XX:PermSize=20m ru.skuptsov.MemoryConsumer In VisualVm we get the following picture:

In just 30 seconds, the experiment produced 54 assemblies — 31 small and 23 full assemblies — with a total stopping time of 3.227c. This amount of delay may not meet the necessary requirements - see if we can improve the situation without changing the application code.
Setting the allowed response time
The following parameters must be measured and taken into account when setting the response time:
- Measuring the duration of a small garbage collection
- Small garbage collection frequency measurement
- Measuring the duration of the worst case complete garbage collection
- Measure the frequency of the worst case complete garbage collection
Adjustment of the size of young and old generation
The time required for the implementation of the phase of small garbage collection directly depends on the number of objects in the young generation, the smaller its size - the shorter the duration, but the frequency increases, since the area starts to fill more often. Let's try to reduce the time of each small assembly, reducing the size of the young generation, while maintaining the size of the old generation. Approximately, we can estimate that every second we have to clear 50 young people * 8 objects * 1MB ~ 400MB in young generation. Run with parameters:
java -Xms1275m -Xmx1275m -Xmn400m -XX:PermSize=20m ru.skuptsov.MemoryConsumer In VisualVm we get the following picture:

We could not influence the total time of small garbage collection - 1,533s - the frequency of small assemblies increased, but the total time worsened - 3,661 due to the fact that the filling rate of the old generation increased and the frequency of the full garbage collection call increased. To overcome this - try to increase the size of the old generation - run jvm with the parameters:
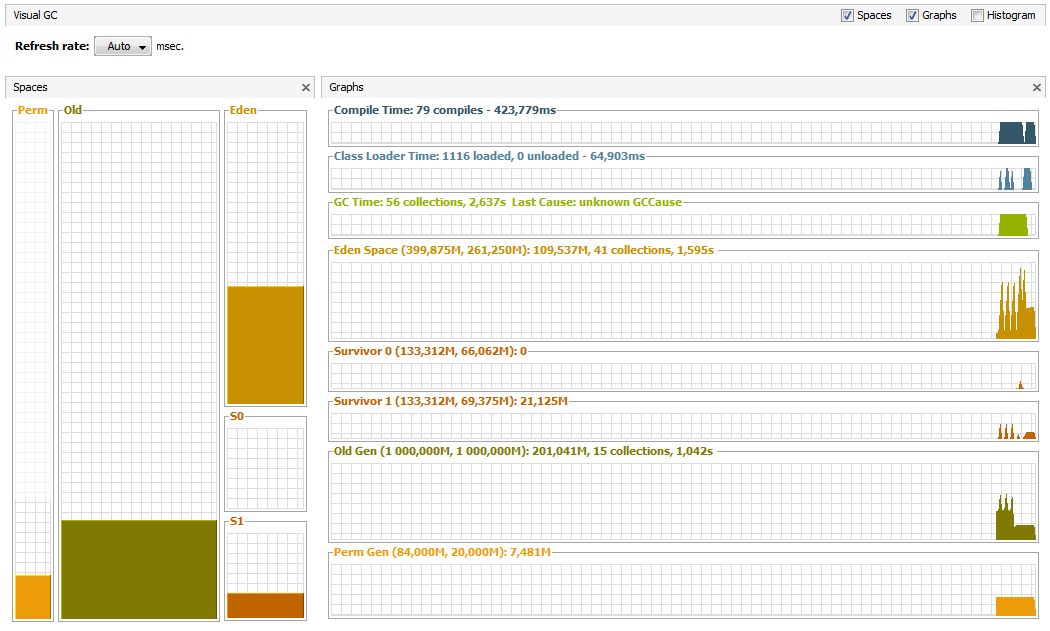
java -Xms1400m -Xmx1400m -Xmn400m -XX:PermSize=20m ru.skuptsov.MemoryConsumer 
The total pause has now improved and is 2.637 s and the total value required for the application of memory has decreased, thus iteratively finding the right balance between old and young generation for distributing the lifetime of objects in a particular application.
If the delay time still does not suit us - you can go to the concurrent garbage collector by turning on the -XX option: + UseConcMarkSweepGC is an algorithm that will try to perform the main work of marking objects for deletion in a separate stream in parallel to the application threads.
Configuring Concurrent garbage collector
ConcMarkSweep GC requires more careful tuning, - one of the main goals is to reduce the number of stop-the-world pauses in the absence of sufficient space in the old generation for the location of objects - because this phase takes on average more time than the full garbage collection phase with throughCc. As a result, the duration of the worst case of garbage collection may increase, it is necessary to avoid frequent overflows of the old generation. As a rule, when switching to ConcMarkSweep GC, it is recommended to increase the size of the old generation by 20-30% - run jvm with the parameters:
java -Xms1680m -Xmx1680m -Xmn400m -XX:+UseConcMarkSweepGC -XX:PermSize=20m ru.skuptsov.MemoryConsumer 
The total pause was reduced to 1,923 with.
Survivor size adjustment
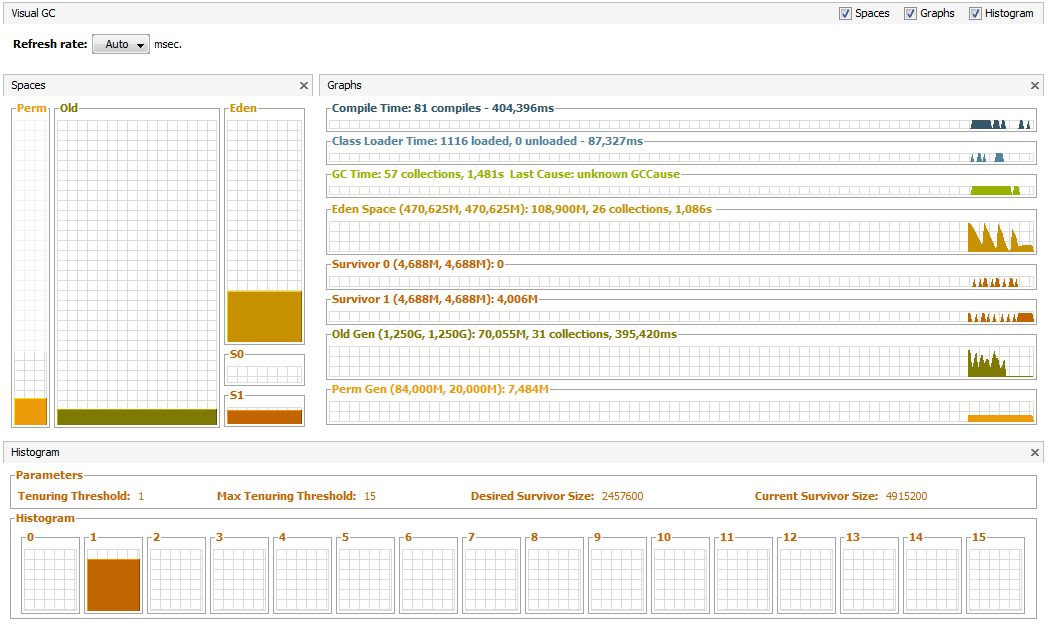
Below the graph, you can see the distribution of the application's memory by the number of transitions between the Eden, Survivor1 and Survivor2 stages before they get into Old Generation. The fact is that one of the ways to reduce the number of overflows of the old generation in the ConcMarkSweep GC is to prevent the direct flow of objects from the young generation directly to the old - bypassing the survivor area.
To track the distribution of objects in stages, you can run jvm with the -XX: + PrintTenuringDistribution option.
In gc.log we can observe:
Desired survivor size 20971520 bytes, new threshold 1 (max 4) - age 1: 40900584 bytes, 40900584 total The total size of survivor objects is 40900584, the CMS defaults to using the 50% barrier to occupancy of the survivor area. Thus we obtain the size of the region ~ 80 MB. When you run jvm, it is specified by the -XX: SurvivorRatio parameter, which is determined from the formula:
survivor space size = -Xmn<value>/(-XX:SurvivorRatio=<ratio> + 2) Get
java -Xms1680m -Xmx1680m -Xmn400m -XX:SurvivorRatio=3 -XX:+UseConcMarkSweepGC -XX:PermSize=20m ru.skuptsov.MemoryConsumer Wanting to leave the size of eden space the same - we get:
java -Xms1760m -Xmx1760m -Xmn480m -XX:SurvivorRatio=5 -XX:+UseConcMarkSweepGC -XX:PermSize=20m ru.skuptsov.MemoryConsumer The distribution is better, but the total time has not changed much due to the specifics of the application, the fact is that after frequent small garbage collections, the size of the surviving objects is always larger than the available size of survivor areas, so in our case we can donate the correct distribution to suit eden size space:
java -Xms1760m -Xmx1760m -Xmn480m -XX:SurvivorRatio=100 -XX:+UseConcMarkSweepGC -XX:PermSize=20m ru.skuptsov.MemoryConsumer Total
As a result, we were able to reduce the size of the total pause from 3.227 seconds to 1.481 seconds by 30 s of the experiment, while slightly increasing the total memory consumption. Whether it is a lot or a little depends on the specific specifics, in particular, given the tendency to reduce the cost of physical memory and the principle of maximizing used memory, it is still important to find a balance between different areas of the GC and this process is more creative than scientific.
Source: https://habr.com/ru/post/223401/
All Articles