Radioactivity meter (radiometer) with Glonass receiver and data transmission via Wi-Fi
The article describes a homemade device for measuring radioactivity, determining the coordinates of GLONASS \ GPS and having a channel of exchange via Wi-Fi. Also described are the internal microprocessor software and an external program (Visual Basic) for receiving, displaying data and writing them to log files.
')
For the last few years I have been engaged in the construction and practical manufacturing of various home automation, control and monitoring of environmental parameters devices during my free time. Now I have a lot of free time and I got the opportunity to describe what was done.
My devices are connected to the home network via Wi-Fi, in the home network there is a silent fanless control machine with a solid-state disk. This machine performs the functions of the system core, it runs data acquisition programs from a variety of sensors and an external device control program.
The task that I wanted to solve with a radiometer, I formulated like this: “I want to have a device that will measure radiation in a general sense”. The device must show the level of natural background radiation, respond to changes in this background, have a measurement range of at least the applied sensor and be able to transfer data to an external recorder. It would be nice to have a search function in the device: when you can move the device near the “hot spot” and find it by changing the readings of the built-in indicators. It would be nice to have the autonomy of food for a while, for example, walk around the dacha and check if everything is in order.
The first question to decide is which sensor to apply. Studying materials on the measurement of radioactivity gave me an understanding that the optimal sensor for my task is an ordinary Geiger-Muller sensor. Traditionally, these devices are called “Geiger-Muller counters”, although in reality they do not consider anything, but give impulses to each particle that could start the avalanche breakdown process in the measuring chamber. Therefore, I use the term "sensor". There are a lot of them, for different purposes. I wanted my device to be sensitive enough to beta radiation, not just gamma. Widespread and cheap (in the range of 200 - 1000 r) SBM20 are insensitive to beta radiation, they do not have a window that is transparent to beta particles. The SBM20 is primarily sensitive to gamma radiation, and to a fairly powerful one. It is clear why they were made for military purposes. The use of such a sensor in the radiometer requires a large time of data accumulation for more or less adequate measurement of the natural background. For the SBM20, this time usually takes 46 seconds, while the number of accumulated pulses is equal to the current gamma background value in micro X-rays per hour. But I wanted more sensitivity to beta radiation. I did not count on a cataclysm, I was interested in the everyday dimension of small values. If you want to be ready for a cataclysm, you can search and buy some DP5V from storage, replace three capacitors with good film capacitors and get a military-style device, in a green box, foolproof, suitable for measuring radiation up to 200 roentgens per hour in extreme conditions.
I will also note that there are other methods for detecting charged particles, for example, on the basis of scintillation crystals and photomultiplier tubes. These measurement methods make it possible to measure the distribution of the power spectrum of a radiation flux, but for my purpose it is redundant and very expensive.
So, I need a Geiger-Muller counter with beta sensitivity. Fortunately, these sensors are manufactured in Russia. I chose the Beta sensors. They are produced by NPF Consensus . A very kind and customer attitude of the plant employees played a certain role in the decision to buy just such a sensor. I tormented them with stupid Dummy questions and received quite adequate answers to them. To buy a sensor, I had to go to Zaprudnya. It is about 100 km on Dmitrovka, almost reaching Dubna. A desire to see new places also played a role in the decision making about the trip :)
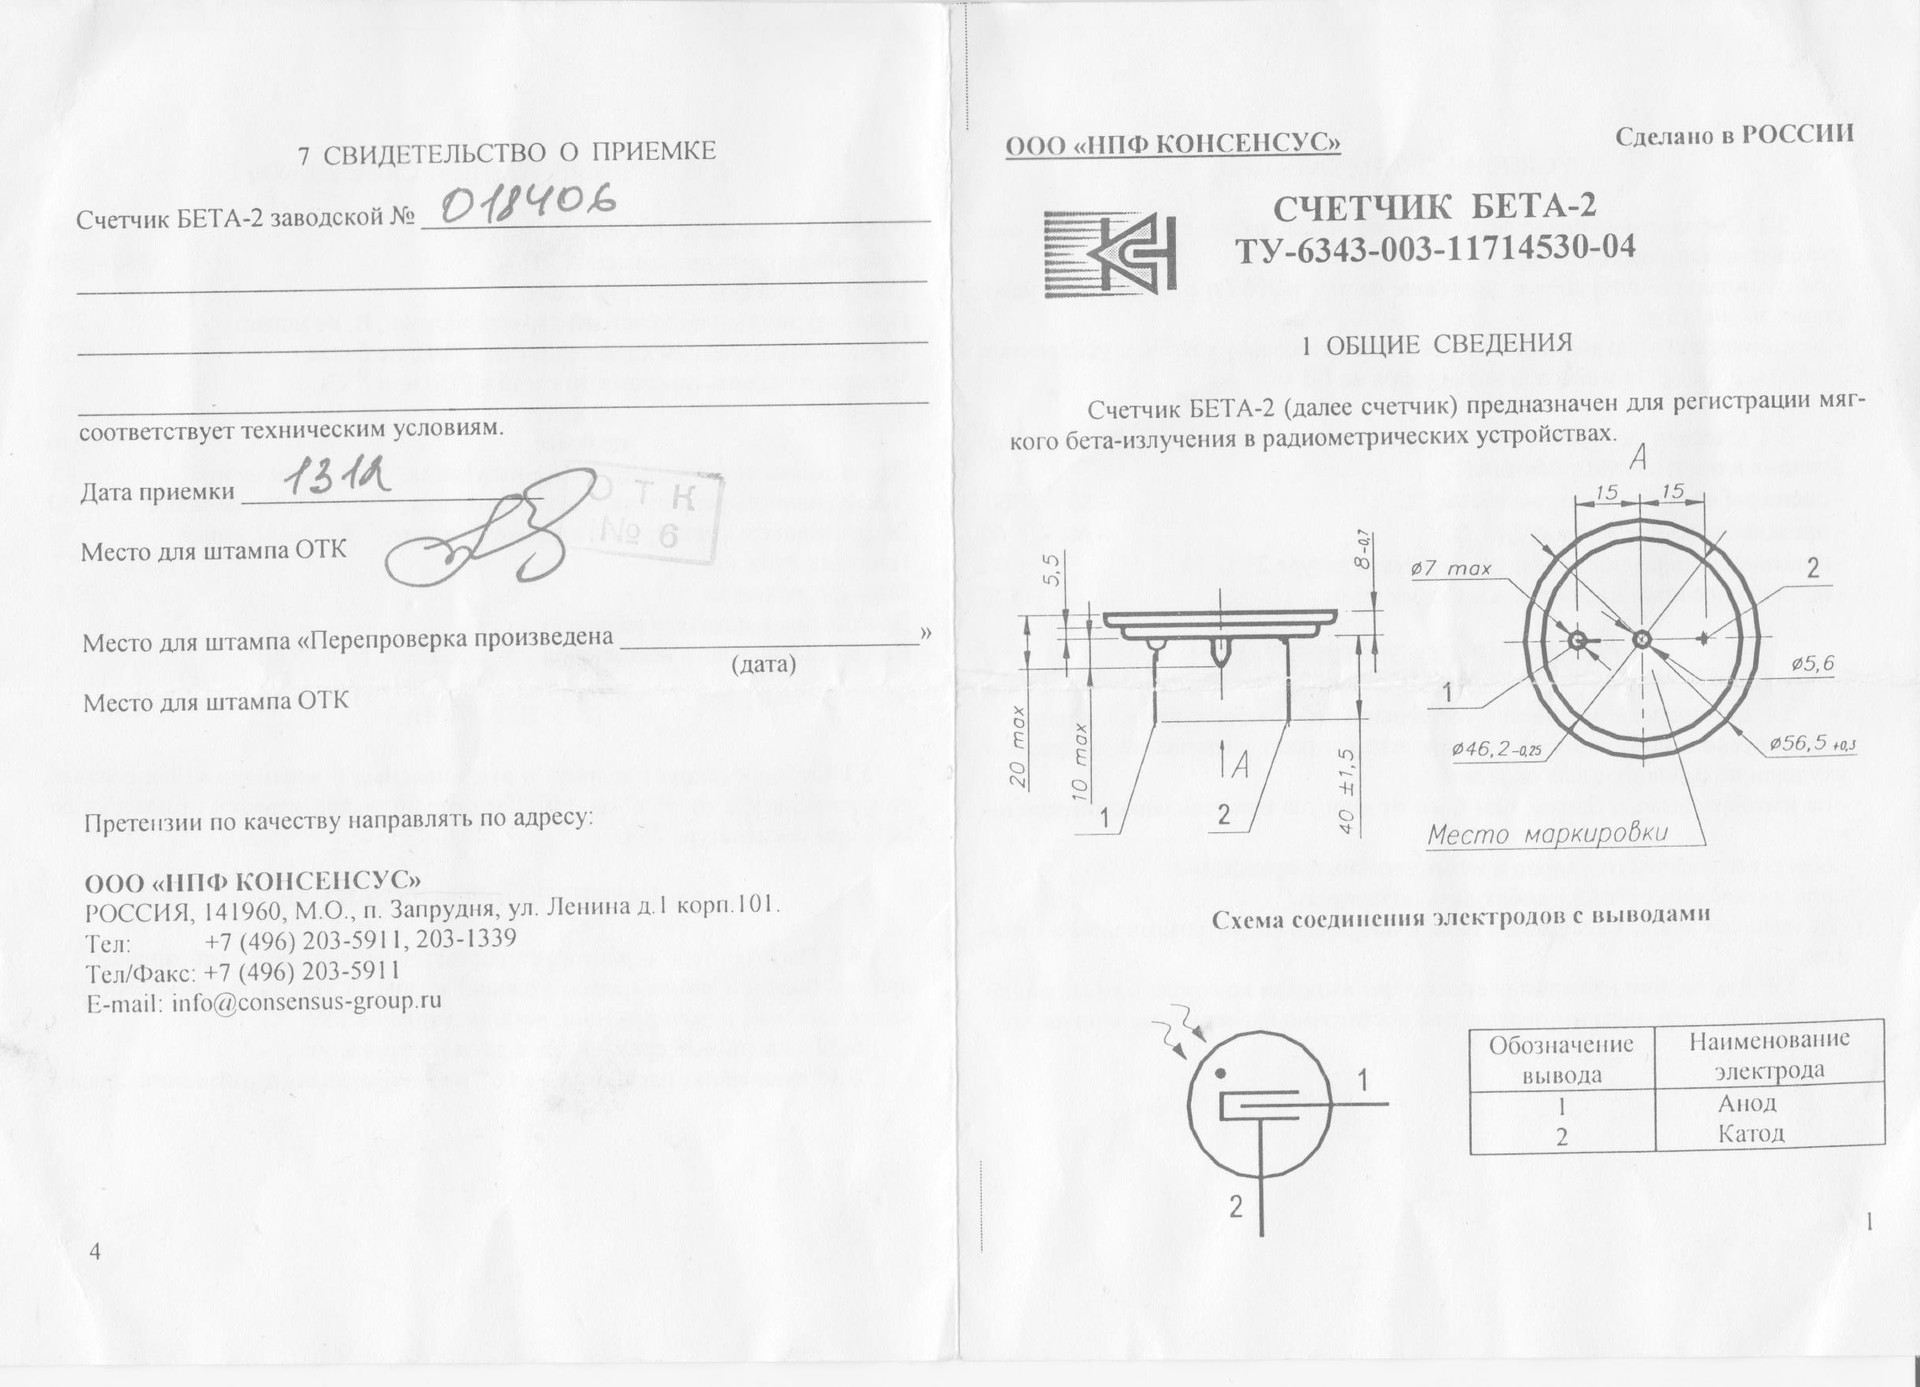
The BETA-2 sensor I have chosen has a mica window with an area of 13.8 cm2 and is sensitive to beta radiation.
To work he needs 400v. An important sensor parameter is recovery time. The essence of the sensor operation is the ionization of the gas in the chamber during the passage of a charged particle and the subsequent avalanche breakdown, then the additives in the gas come into play and quench the discharge. The sensor after quenching the discharge takes some time to restore sensitivity. This time (the term "dead time") is indicated in the characteristics and for specifically Beta-2 is 140 microseconds minimum. Converting to frequency gives us the maximum pulse frequency from the sensor in the region of 8 kHz.
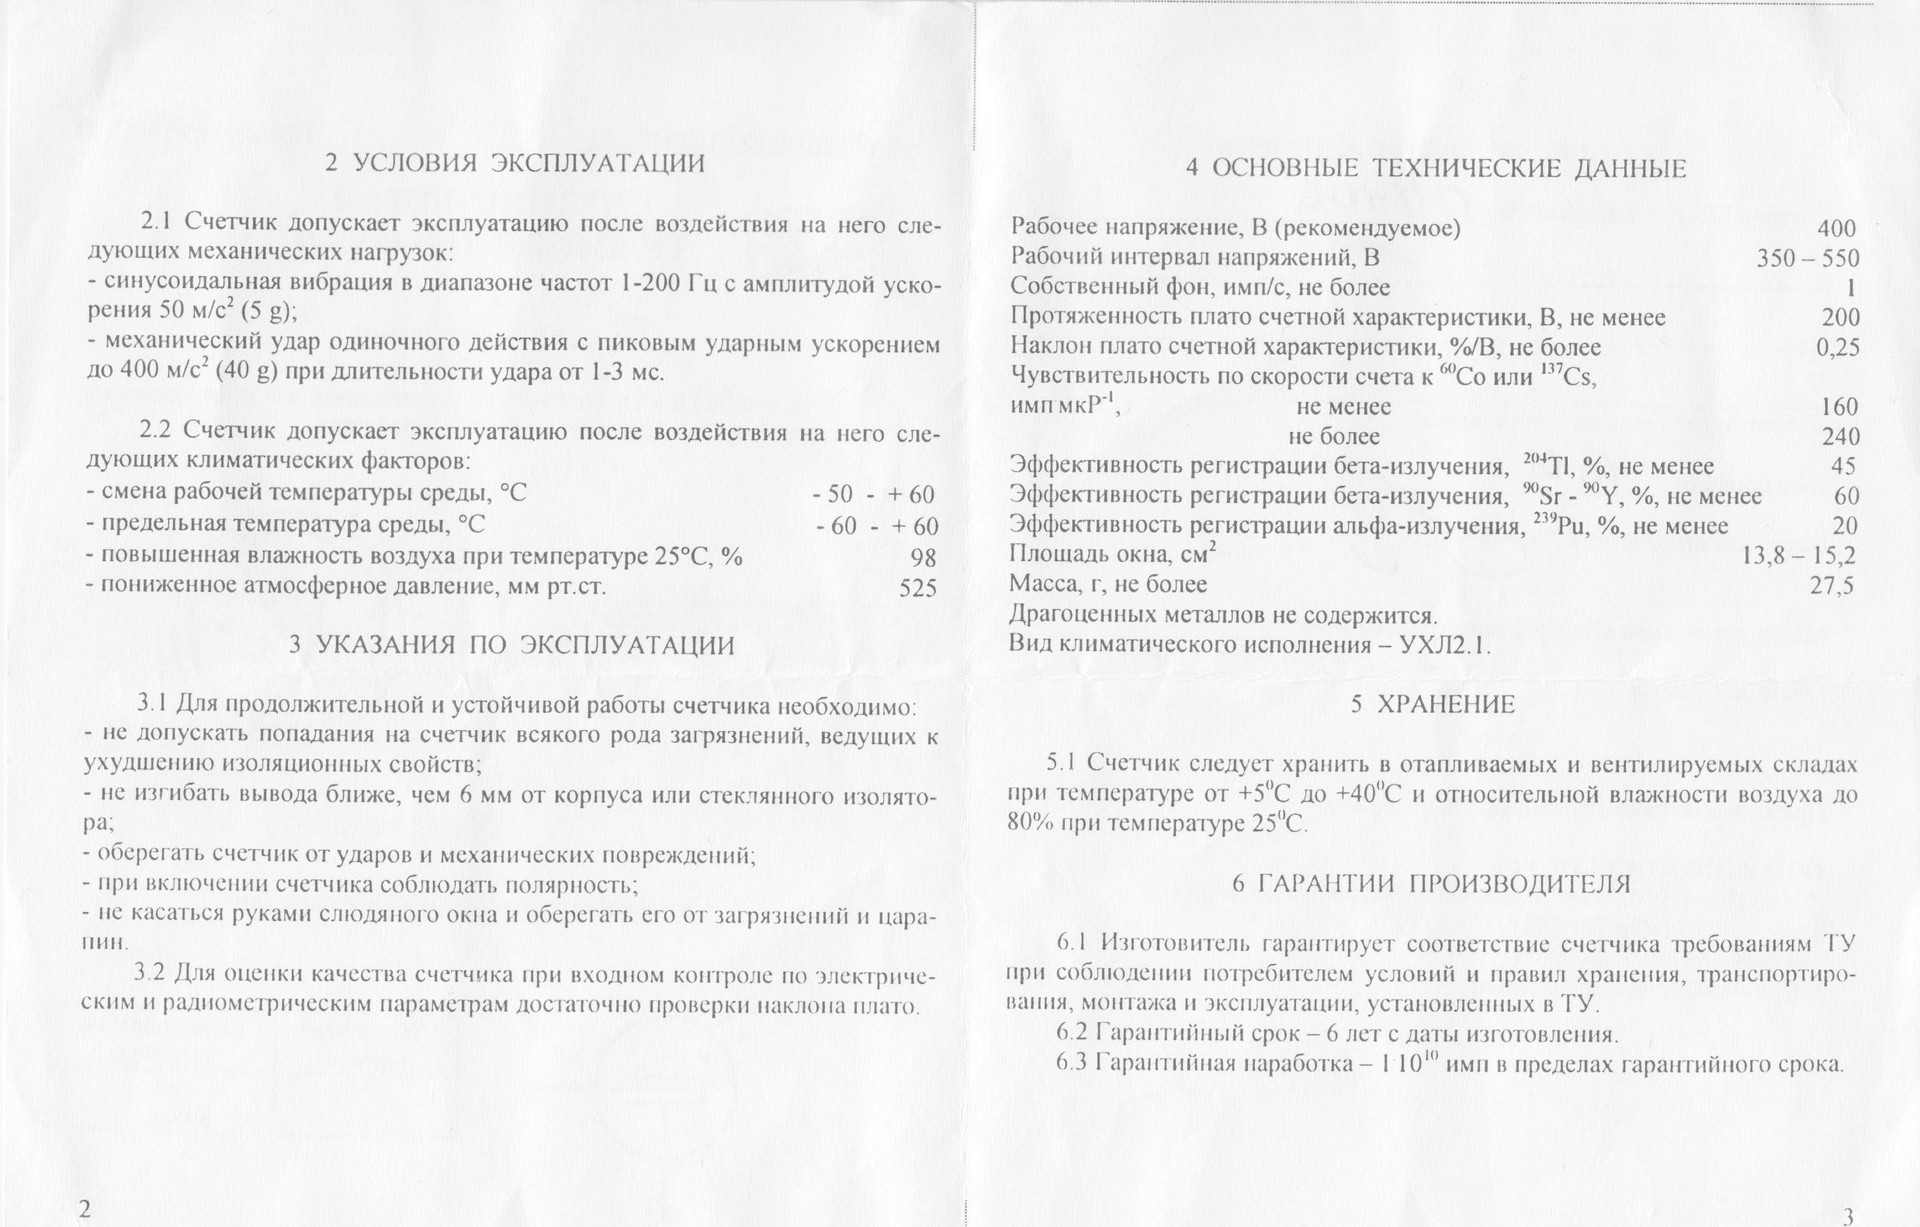
Passport scan:
There are two methods for retrieving data from a Geiger-Muller counter. The first is that a resistor in the region of 10 mega ohms is put in series with the anode and a negative pulse is fed through a capacitor with a unit of picofarad and an operating voltage of about 500 volts to the recording circuits. The pulse is suitable for direct control of the chip's CMOS input.
The second is that a resistor is placed in the cathode circuit and a positive pulse is produced on it, which is fed to the base of the transistor. With this inclusion is not required high-voltage capacitor.
The standard method recommended by the manufacturer is to remove the signal from the anode. NPF Consensus experts could not answer why such inclusion is correct. I received the answer later from the author of the PN400 power converter — he believes that a large cathode surrounds the anode and plays the role of a screen for the anode, and such switching on reduces interference and the number of false positives.
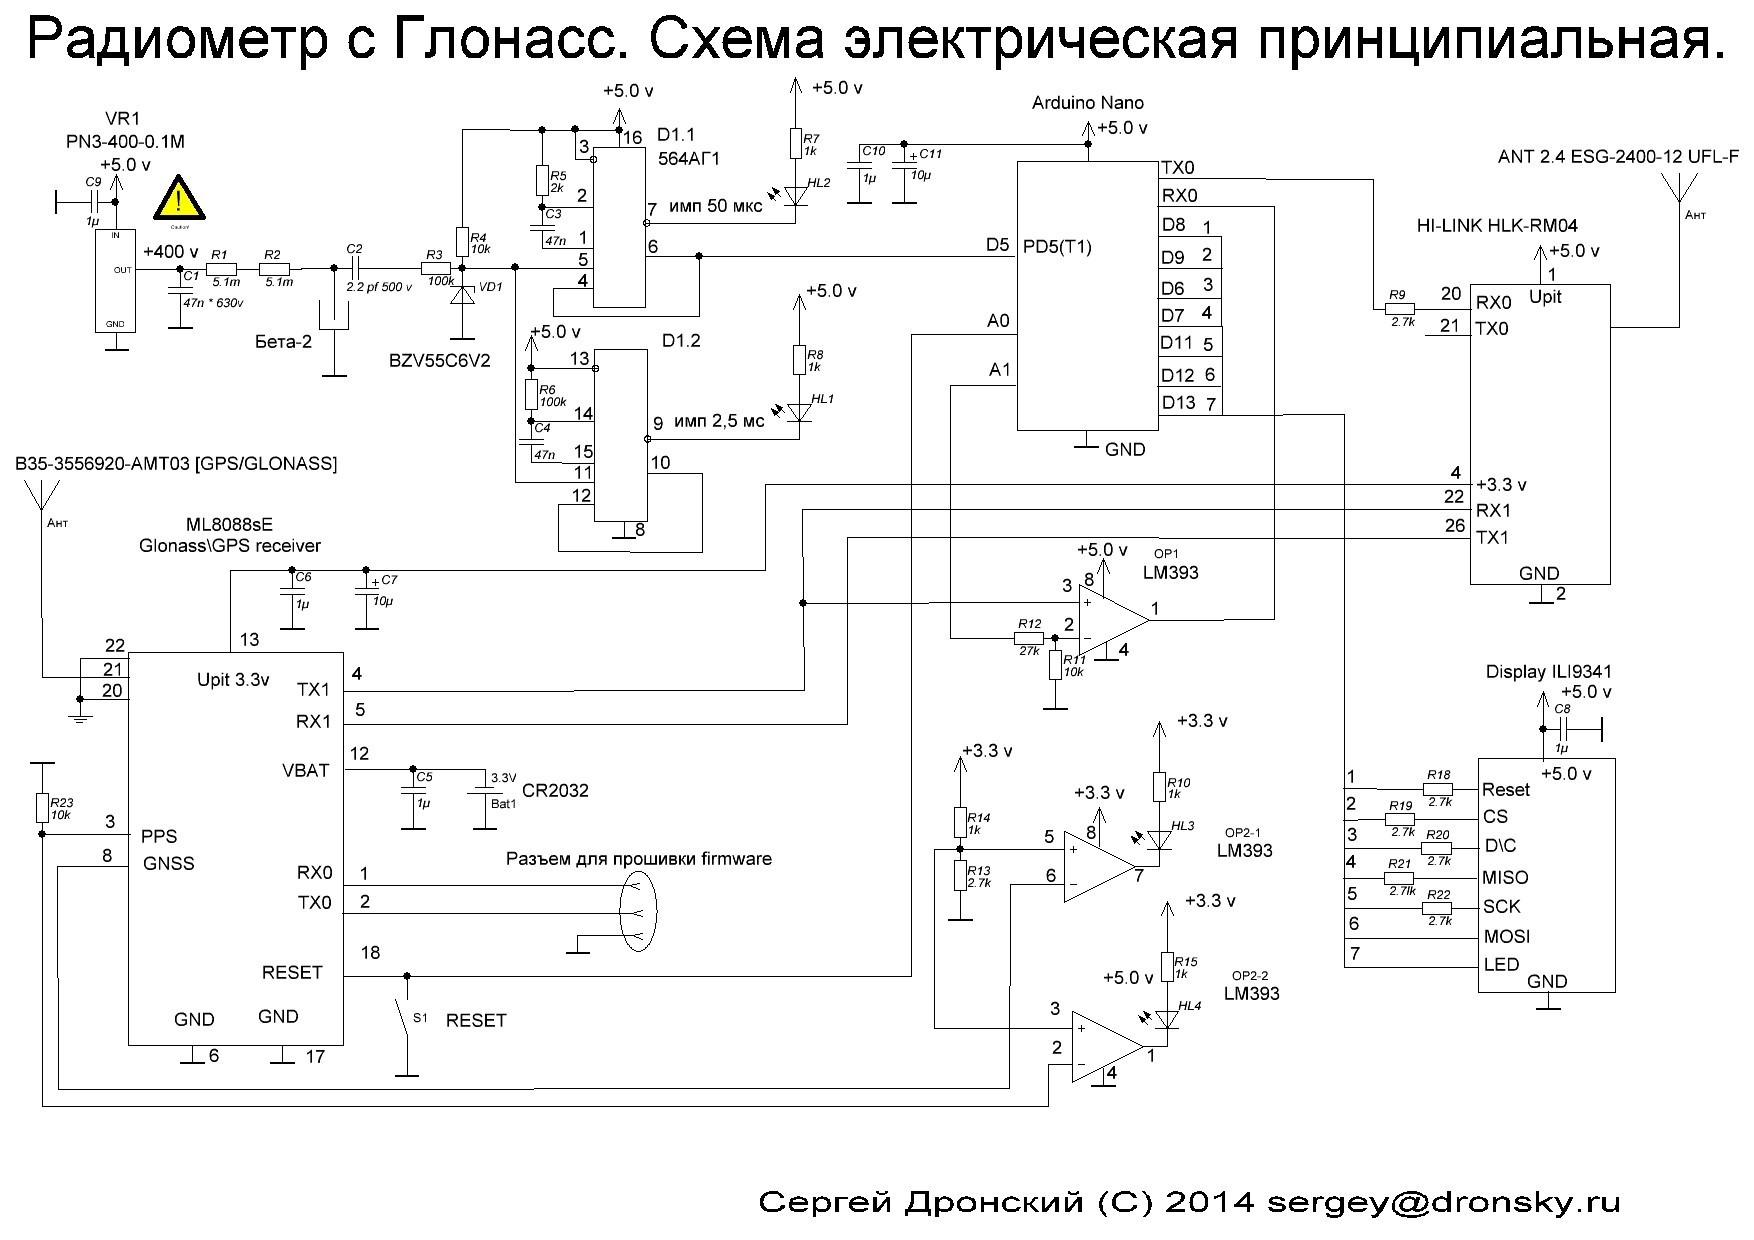
Schematic diagram of the radiometer
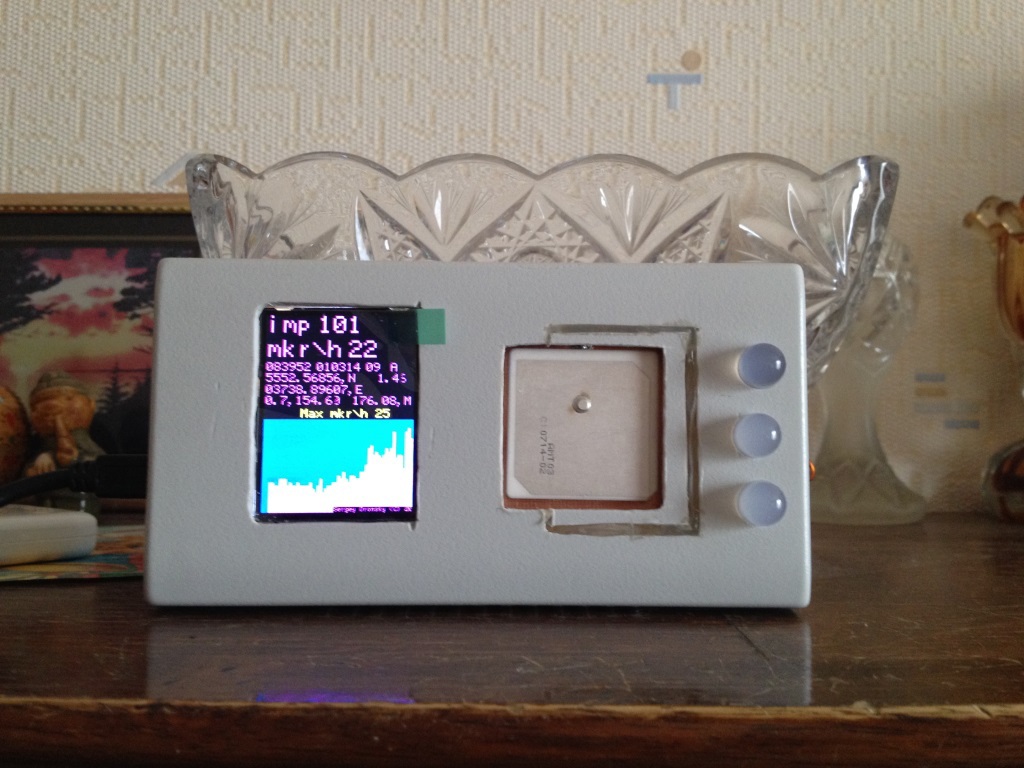
Construction photos:

The signal from the sensor through the forming protective circuit can be directly fed to the inputs of the microprocessor. But I decided to put an additional forming element on the dual 564AG1 one-shot one. The first one-shot creates a pulse of 50 μs duration, and the second –2.5 ms to feed to the LED. The LED serves as a trigger indicator and allows you to search for a hot spot by the intensity of the blinking diode. Initially, I wanted to put two counters - one for beta, the other for gamma. Therefore, a two-channel timer was used and an HL2 led indicator was supplied to the output of the first channel of the single vibrator.

After launching the first channel, I was convinced that Beta-2 responds well to the natural background (1), the cost of the second sensor is still high (2) and I also wanted to install a navigation sensor (3). Of these three reasons, the decision to change the plan appeared, not to put a second gamma sensor, but to put a navigation sensor.
Therefore, the SMD LED remained in place, the timing chains of the second channel AG1 were changed (the resistor was increased from 2 to 100 k) and the output of the second channel was output to a large bright red matte LED on the front panel. A 50 μs pulse is clearly visible, but a 2.5 ms pulse is seen perfectly:

This hardware solution will also work if Arduino Nano fails, allowing you to navigate the environment by the frequency of the LED blinking.
I didn’t make sound accompaniment because the main application of the device is the measurement of background activity.
As a radiometer processor, I chose the Arduino Nano. The reasons for this choice are the price (200 rubles from China), small size, a huge number of ready-made solutions and already existing experience of using such boards in homemade products. The main question was - is there enough processor speed to process the pulses that quickly follow each other? From the study of similar devices and descriptions of programs, it became clear that the supply of pulses from the counter to the input of the processor and the programming of the interrupt requires a high speed of the processor and serious programming efforts. However, fortunately, the applied processor has three timers-counters, two of which can be switched to the external pulse counting mode from the outer leg of the processor. This radically simplifies the task. It is enough to zero the counter at the beginning of the measurement cycle and at the end read the number of pulses. The account is performed at the hardware level, without requiring the attention of the processor. The resource of the processor can be used to exchange data and draw the screen of the device.
The algorithm for recalculating the number of accumulated pulses for a certain time is based on the passport characteristic of the counter:
Sensitivity to 60 Co imp / μR: 160 ÷ 240
Those. to calculate the x-ray per hour, you need to know the number of pulses, the time interval and the sensitivity of the counter. The calculation formula for sensitivity 200 looks like this:
R = CT / DELTA_T * 18
Where CT is the number of pulses per DELTA_T interval in seconds, and R is the current value of radiation in micro X-rays per hour.
Those interested can derive the formula on their own, it is not difficult :)
Measurement of radioactivity is the measurement of the parameters of a stationary random process. The random process is characterized by expectation and root-mean-square deviation. The smaller the standard deviation, the more accurately we measured the parameters of the random process. RMS decreases to stationary value with increasing number of pulses. Those. the more accurately we want the result, the longer we have to measure.
From a practical point of view, this means that for measuring the background and small fluctuations of this background, the measurement time should be long — a couple of minutes. If we want to use the device to search for a “hot spot” - it is desirable to minimize time.
To meet both requirements, I made an adaptive measurement algorithm. To this end, during the pulse counting process, the sketch checks the contents of the counter during each pass and if it is more than a predetermined setpoint (100), then an early exit from the cycle occurs. If there is no excess, then the counting of pulses goes before the time expires in 120 seconds. Thus, in the background measurement mode, the measurement takes 120 seconds, which gives the standard deviation 1.3.
Screenshot of the Radiometer program, measurement of background values:
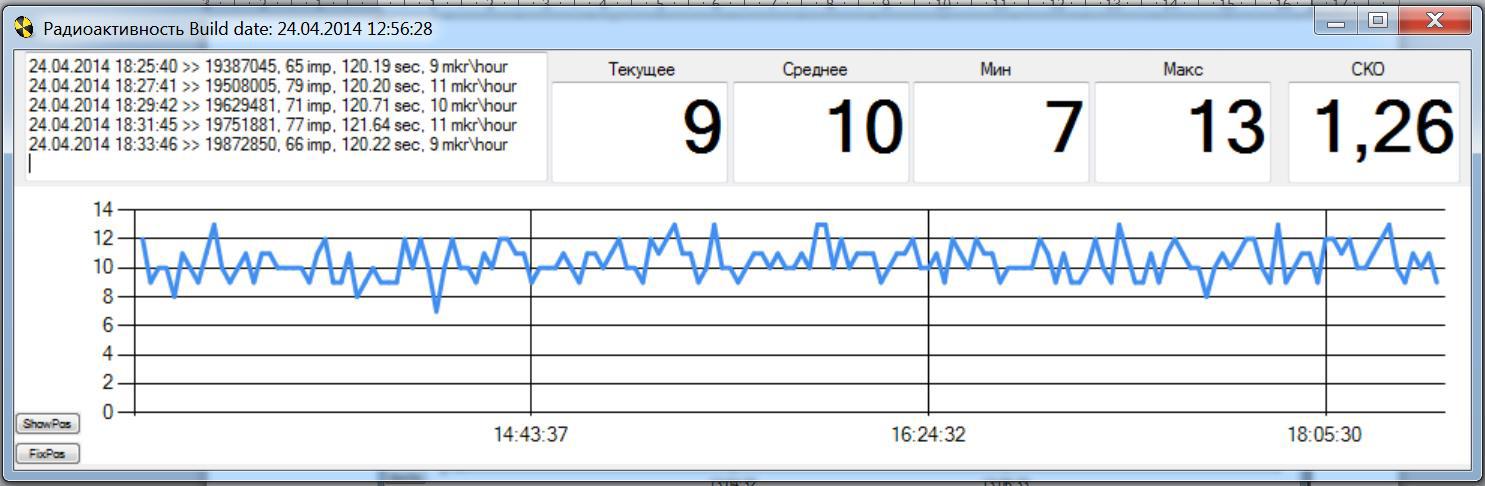
If the situation changes dramatically, the score ends much earlier and the readings of both the built-in display and the external receiver are updated much faster. The setting “100” is selected from the observation of the background measurements, in 2 minutes the number of pulses is usually in the range of 50-80. When measuring the compass activity, the counting cycle is about 10 seconds, the standard deviation is 17.6:
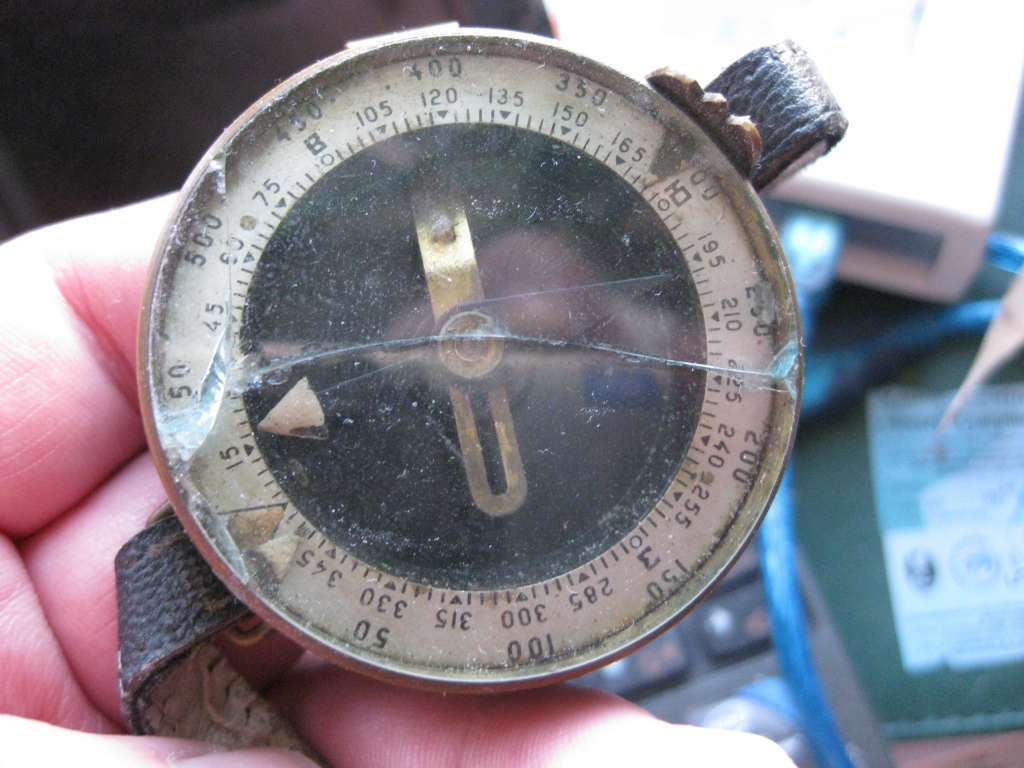
Screenshot Radiometer, measurement of the radioactivity of the old compass:

Here is this compass:
Here is a photo of the usual situation, the measured background is 11 μR \ h, which is close to normal for Moscow.
To power a Geiger-Muller counter, a 400 volt source is required.
I used the ready-made converter PN3-400-0.1M, purchased for 750 p. These transducers can be purchased through ebay (search for “Geiger counter power supply module 1VV 400V high voltage” or for “Adjustable telescope”).
I didn’t want to wait and I found the author of the product (it turned out to be Moscow region), he recommended one of his representatives in Moscow to me and he was brought to the nearest metro station for cash. There were no problems with the product, it worked right away and did not cause any questions.
I used a rather large housing for the instrument: the Gainta 413, measuring 150 by 80 by 30, bought in Brown Bear. At first I thought about two Geiger-Muller counters - one for beta, the second for gamma. It would be possible in one measurement cycle to obtain data immediately on both gamma and beta separately. Space for the second counter was provided above the first. However, after launching the system, I saw that with a single sensor, the radiometer does what I want - it cheerfully responds to background radiation, to an old compass, to crystal objects, to thorium welding electrodes, and to a bag of potassium fertilizers. Therefore, I refused to install the second sensor on the gamut and switched to a backup plan - the placement of Glonass / GPS navigator. Practical use was thought of as follows: I found a “hot spot” (for example at the dacha), wrote down the coordinates, and handed it over to the MOE for decontamination. In reality, it was just interesting to try to tinker with the new technology.
Beta particles are characterized by low penetrating power. Even a sheet of paper - a serious obstacle, not to mention the body thickness of about 5 mm. In order to use all the features of the Beta 2 sensor, I have provided an opening round flap to give Beta radiation direct access to the sensor. The round hole in the body is made with a circular saw on wood. The cover is made based on the launcher of domestic intercontinental ballistic missiles. On the reverse side are attached flat limiters from the debris of a stationery knife, reduced to a rectangular shape on the sharpener. A magnet from the terminal client kit is used to fix the lid. In this terminal client such magnets are used as legs. When working with a magnet, we must remember that the Curie point of this alloy is less than 80 degrees Celsius and overheating will lead to the loss of properties.
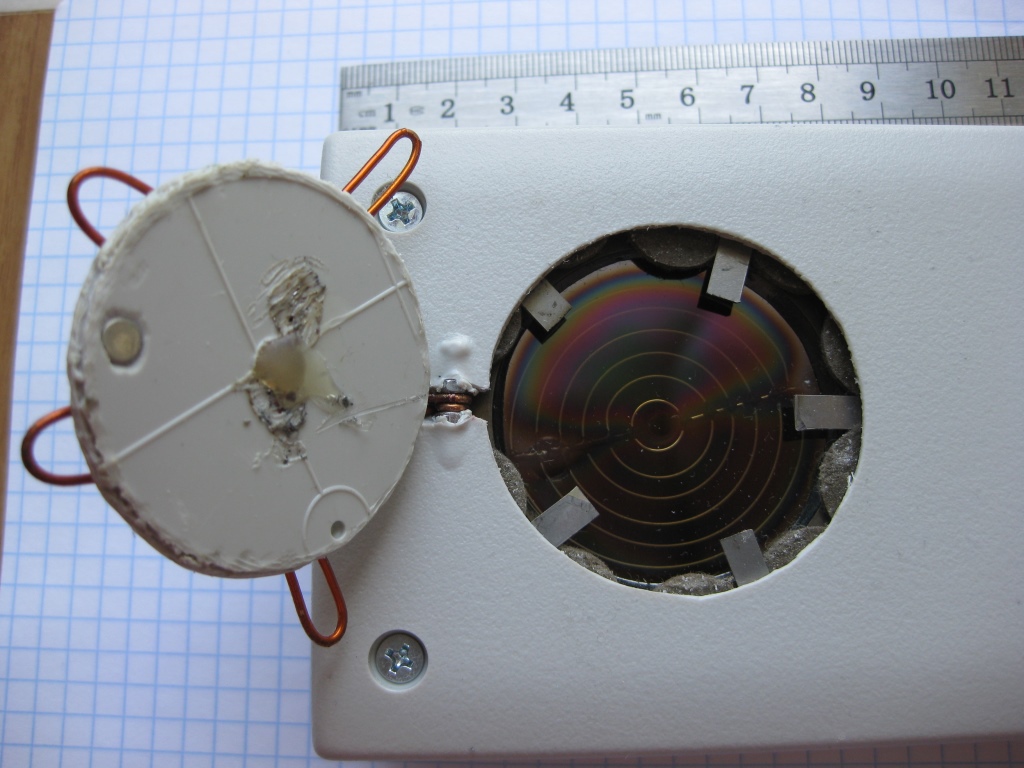
The device of the lower part of the body with an opening cover for the passage of beta particles:


The Beta-2 sensor is placed on the bottom plate in the hole slightly larger than the diameter of the meter. Under the counter, self-adhesive felt circles are installed, performing the role of spacers between the bottom surface of the sensor and the housing. The mica sensor window is very thin and requires careful handling. During final assembly after debugging, I aligned the sensor with the hole in the case and fixed the sensor with hot glue.
You need to open the window if you need to measure activity or search for a weak beta emitter.
For example: an old compass with a glowing in the dark composition. With the lid closed - 70 microroentgen per hour. With the lid open - 200 microroentgen per hour.

Measurements of the radioactivity of crystal glassware:

Navigation module
At first I found a receiver based on UBLOX7m on ebay GPS \ Glonass. This device looks like this:
It is simple to connect - just feed it (+ 3.3V) and connect the 3.3 v connector via the serial. I used an FT232 based converter:
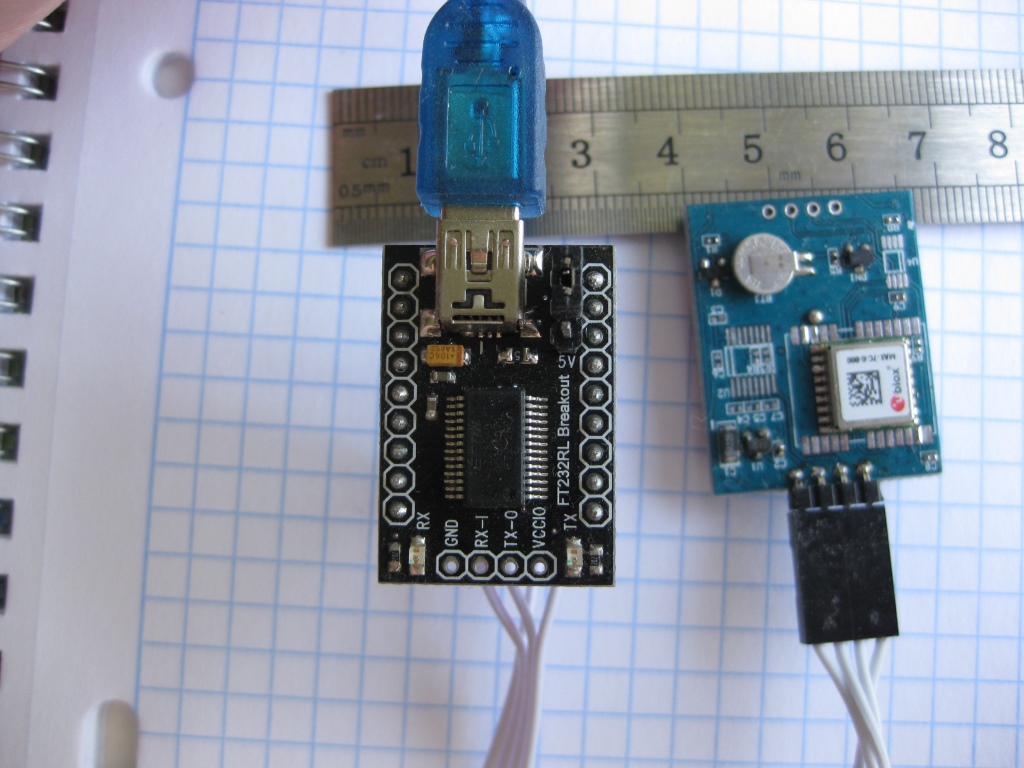

The branded program allows you to play with the module - get the coordinates of the place, look at the satellites, etc.
Screenshot of the ublox program:
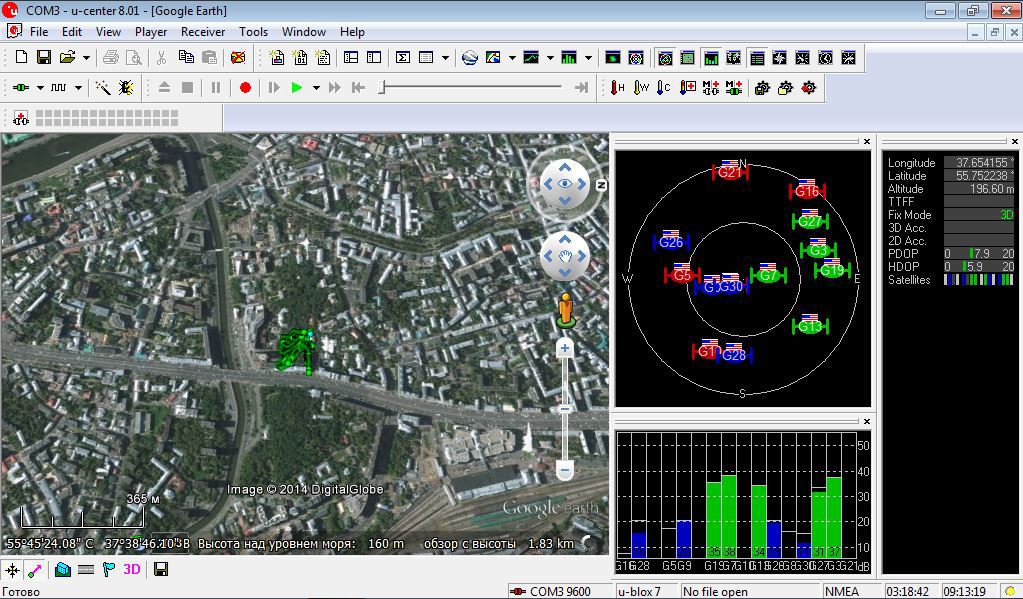
Unfortunately, the module, although it can work with the Glonass constellation, but in a truncated version. First, the module is single channel - i.e. he can only work with one constellation at a specific time. Switching the constellation requires reloading the module. Secondly, when the constellation Glonass is turned on, the module stops working with data from the satellite of the differential correction.
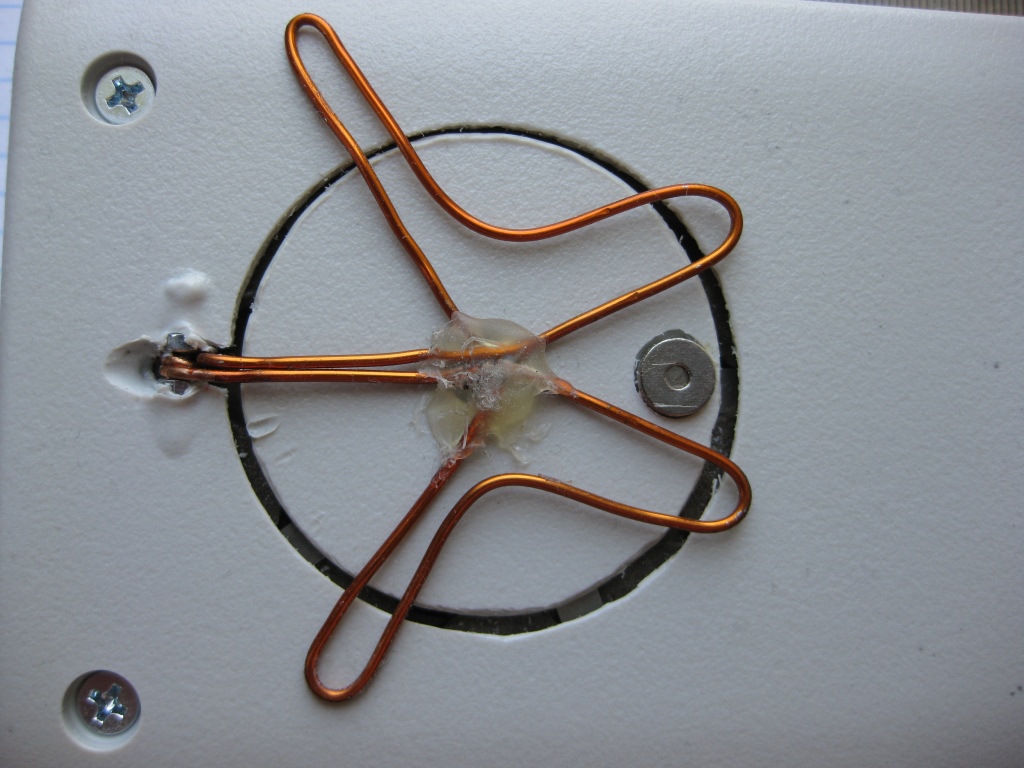
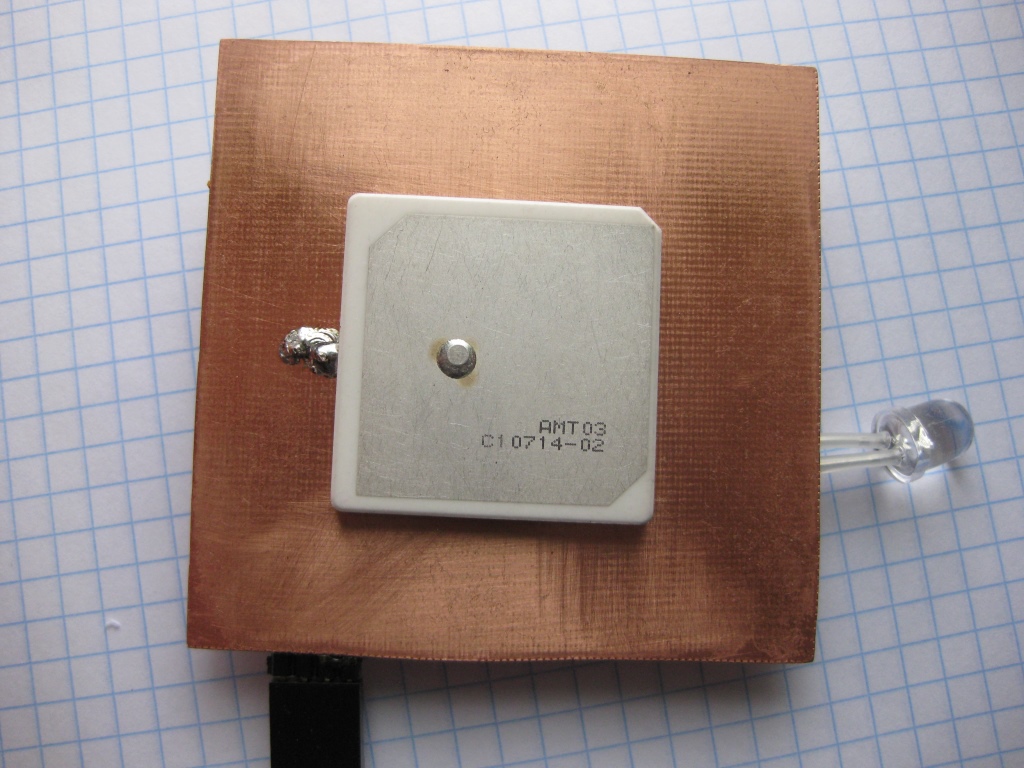
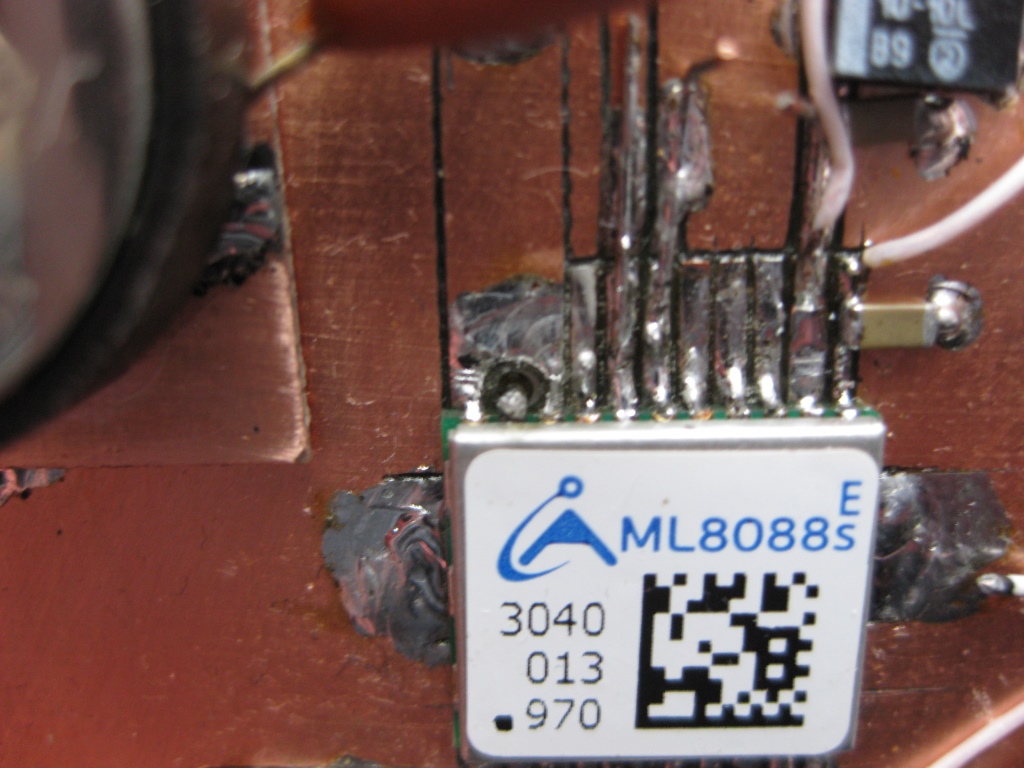
I wanted the module to work simultaneously with Glonass and GPS. There are such modules, in particular, ML8088 of the St. Petersburg firm Navia. Unfortunately, I did not find a ready-to-use module suitable for installation in a homemade device. There are ready-made devices on the ML8088, but they were not suitable for my device either in price or size. And I decided to make my own module :). I bought a B35-3556920-AMT03 [GPS / GLONASS] antenna and a ML8088s module in DESSY.RU . The antenna needs a dual-system - the Glonass and GPS have slightly different carrier frequencies.
According to the instructions of the manufacturer of the antenna, it should be installed on a conductive base measuring 7 to 7 cm in the center. It was very successful - a 7 by 7 cm square was precisely placed in my body. When designing the glonass module, I had to decide how to connect the antenna to the input of the ML8088 module. The manual should use a microstrip or coplanar line with an impedance of 50 ohms. Such a line requires reasonably accurate conductor strips on the PCB. Make it my favorite method of cutting tracks on the board with a stationery knife is difficult. Having carefully considered the situation, I decided to do without a microstrip line at all and connect the antenna directly to the receiver input. The manual says - the shorter the transmission line from the antenna to the input, the better. So, zero length is optimal. It was necessary to develop a fee, respectively, from the installation of the antenna. However, when the size of the board is 7 by 7 cm, the displacement of the micromodule does not cause any problems.
This design required a certain sequence of installation elements. First, it was necessary to glue the antenna, then adjust the ML8088 so that the antenna leg goes into the recess of pin 21 and grab the ML8088 in that position. Then mark the position of the conclusions ML8088, remove the micromodule, cut through the tracks. And solder the legs of the chip, taking breaks for cooling. Unfortunately, I was mistaken and did not tamper with the deepening of the antenna output before soldering the antenna. The soldering did not work out, the system caught a couple of satellites after an hour of work ... Having considered the situation, I decided to remove the antenna, chew the output and solder the antenna back. The difficulty is that it is necessary to simultaneously detach the antenna from the base and unsolder the output. But I was lucky - I put the diagnosis “not drunk” correctly and the antenna bounced off the leg as soon as I a little bit unstuck the antenna from the base. Then everything turned out well - the output was tangled, the antenna was soldered and the system worked as it should.
When diluting the antenna connection, it is imperative to consider the requirement from the documentation - the antenna ground must be connected to pins 20 and 22 and more to not have contact with the common ground. This is necessary to prevent the formation of earth loops and reduce noise immunity. Conclusions 20 and 22 of the ML8088 are connected to the ground inside the micromodule.
It turned out that in the factory supply in the ML8088sE there is a firmware firmware that does not support the slow blinking of the output “there is a solution”. I signed with the manufacturer and received a new firmware and detailed instructions for flashing. I did it all.
I want to thank Vladimir Osadchy (technical director of Navia ), who kindly and patiently answered my questions.
It was not possible to convert the signal "there is a solution to the navigation problem (GNSS)". This is a signal that flashes at a half-heart rate if the module has solved the navigation task and the data issued by it is correct. The signal amplitude is 1.8 volts and the load capacity of this output is about 2 ma. But the scheme from the manual (ML8088sE inclusion AppNote 1_1.pdf) did not work.
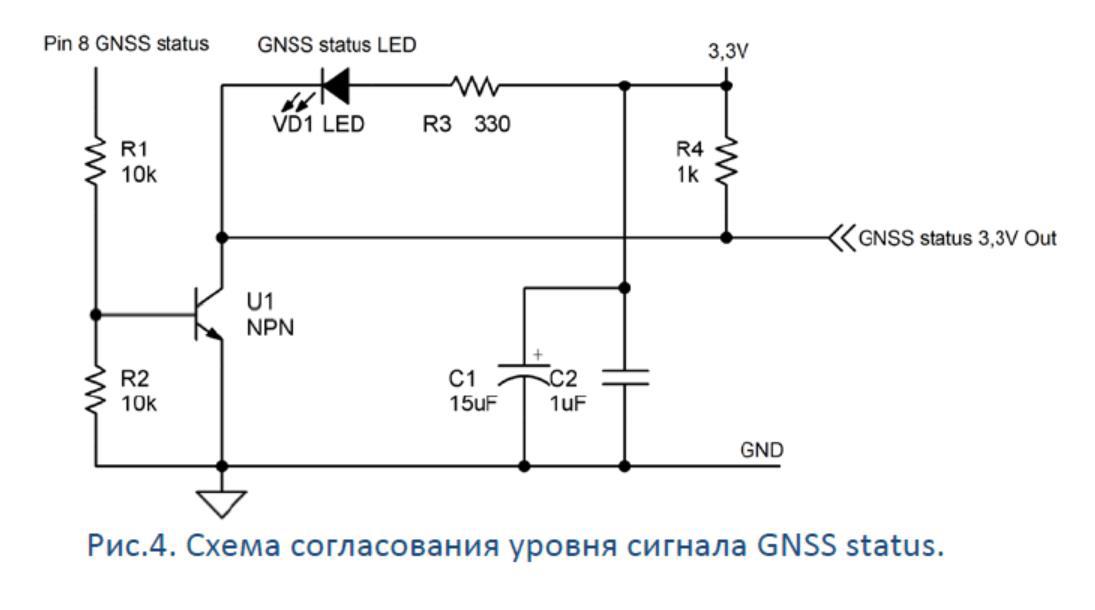
It seems that there was not enough load capacity to achieve a confident opening of the transistor. The effect was strange - if the system started incorrectly - a sufficient signal was generated at this output to control the conversion circuit and the control LED blinked happily with Morse code. And when the system started correctly, the signal amplitude was smaller and the transistor did not open. According to the developer, the signal should be enough. He brought an oscilloscope from the balcony and made sure that there is a signal, but the level is low, only 0.4 volts ... Vladimir Osadchy called a specific model of the transistor, which works exactly for him, but I went my own way and applied another LM393 junk comparator :). The second channel of this comparator I used to indicate the PPS signal. Along the way, I changed the parameters of the 1PPS signal, made a 200 μs long signal.Now I have a comfortable unobtrusive display of the functioning of the system with a short smile :).
The final version of the Glonass / GPS module looks like this:

and placed in the case: The

upper non-attached connector is designed to fill the firmware into the module.
Yellow rectangle of soft plastic - spacer, abutted against Beta-2 when closing the case.
The ML8088sE module has two exchange channels for the serial port. Navigation data comes one at a time, debug information or firmware follow through the second. By default, the channels are tuned to the speed of 115200. I switched them to 57600. I had to do so because of the speed limitations of the second Wi-Fi channel of the HI-LINK HLK-RM04 module. Details about it below.
I used an external backup battery like CR2032. With it, the start of the module is much faster, since everything necessary for a quick calculation of the positions of the satellites and from capture to tracking mode is already in memory. In this mode, a module reset is usually not required. Reset is needed when you first turn on or if the module did not start correctly. If the module did not start correctly, the LED of the presence of the solution will repeat a certain code cyclically. A reset causes the module to return to normal. In my case, a reset was required after soldering parts. I implemented two independent mechanisms for resetting the module. The first is a regular button, recessed in the case, so as not to interfere and not to accidentally press it. The second is software. At startup, the sketch waits for five seconds, then begins to receive data from the ML8088sE.If there is no data for the timeout interval, the sketch resets the module with a negative pulse from the A0 pin. It is important - when starting the module, it is necessary that the reset pin be in the high-impedance third state. Therefore, after issuing the reset command, I put the output A0 in input mode. The button and the output of Arduino are connected in the "mounting or" mode.
My device communicates with the outside world through the “HI-LINK HLK-RM04 Serial Port-Ethernet-Wi-Fi Adapter Module” module , which is essentially a mini-router with great capabilities. I use it in converter mode, serial port to Wi-Fi. The device has two ports, one can work at speeds up to 115200, the second - up to 57600. Glonass navigator is connected to the second port and therefore the ML8088 exchange rate had to be reduced to 57600. Unfortunately, this module comes from China without an internal antenna and tuned to an external the antenna. The photo in the store has an internal chip antenna. I had to buy external ANT 2.4 ESG-2400-12 UFL-F antennas in DESSY.RU and demand from DX a commensurate price reduction. Similar antennasThere is also in DX, it is probably worth buying them immediately when ordering a Wi-Fi module. I tried to connect to the module two different whip antennas from some router and PCI card — it works, but the signal level is about 10 dB lower compared to a flat antenna. Plus it is much more convenient when placed inside the case.
The Wi-Fi module has a 3.3 volt output from the internal stabilizer. It is enough to power the Glonass module ML8088sE.
The first channel is used to work with Arduino. The data generated in the Arduino program (from the radiometer) is transmitted to the first channel of the Wi-Fi module and transmitted to the home network. They can be received by any program like PUTTY, which can be connected to the specified IP address and port. Navigator is connected to the second serial port. The data from the navigator also goes to the serial port of Arduino, the program processes the data from the navigator and displays it on the screen.
I researched the issue of using the software serial of the port, but I decided that it would not work reliably and would require programming with great effort. So I came up with a hardware hack :).
First, let me remind you how the transmission of information on the serial port. The serial signal is transmitted by negative drops from +5 to 0. In the initial, inactive state, the signal has a high level (+ 5V). Inside the Arduino Nano, the signal from the FT232 output is transmitted to the serial input of the ATMEGA328P via a protective resistor of 1 kilo. Here is a piece of the concept:

The top diagram shows the connection of the RX and TX pins inside the Arduino board. The RX Atmega328P pin is directly connected to the pin of the Arduino connector and at the same time via a 1k resistor to the TX pin of the USB serial FT232RL. This makes it possible to transmit the serial date to the connector's pin and the signal will go directly to the desired microprocessor output and be processed correctly if the output of the FT232 is high. This condition is met when the computer does not send anything to Arduino, or Arduino works autonomously without being connected to the computer. In this case, the Atmega328P serial input turns out to be actually pulled to 5 volts through a 1 com resistor, as shown in the bottom diagram. In order not to interfere with the normal transmission of data from a computer via FT232 - you must use the transmitter with an open collector and output it to the closed state,when it is necessary to ensure the regular work of the channel series I just had a number of dual-channel comparators of type LM393, having an open collector type output.
The signal from the serial port of the Glonass module is transmitted through a comparator with an open collector type output. When the processor is reset, output A1 rises to the third state. The comparator's inverting input is actually connected to ground through resistor R11. At the non-inverting input of the comparator there is a positive voltage in the range from 0.4 to 3.3 volts. The output of the comparator is in a fully closed state and does not affect the work of Arduino in any way. The exchange of the microprocessor with the computer, loading the sketch into the memory - everything happens as usual. After starting the sketch, output A1 is switched to exit mode and a high level of +5 volts is set on it. The voltage at the inverting input becomes 1.65 V (half of 3.3V). The comparator begins to work as a repeater series of the signal from the Glonass module.The sketch reads data from the standard serial of the port and processes incoming data. When you start downloading a sketch to Arduino, first FT232 generates a processor reset, output A1 goes to the third state, and the output of the comparator goes to the closed state and ceases to affect the Arduino input series. Data transfer from the Glonass module is terminated and the sketch is loaded in a regular manner.
The LM393 comparator is used simply because there were a lot of them in the box on the table, where they got after dismantling from the gas sensor modules. Naturally, for the implementation of such a hack, you can use another logical element with an open collector type output or a control input to transfer the output to the third state.
This method of connecting information flows is called “installation OR”.
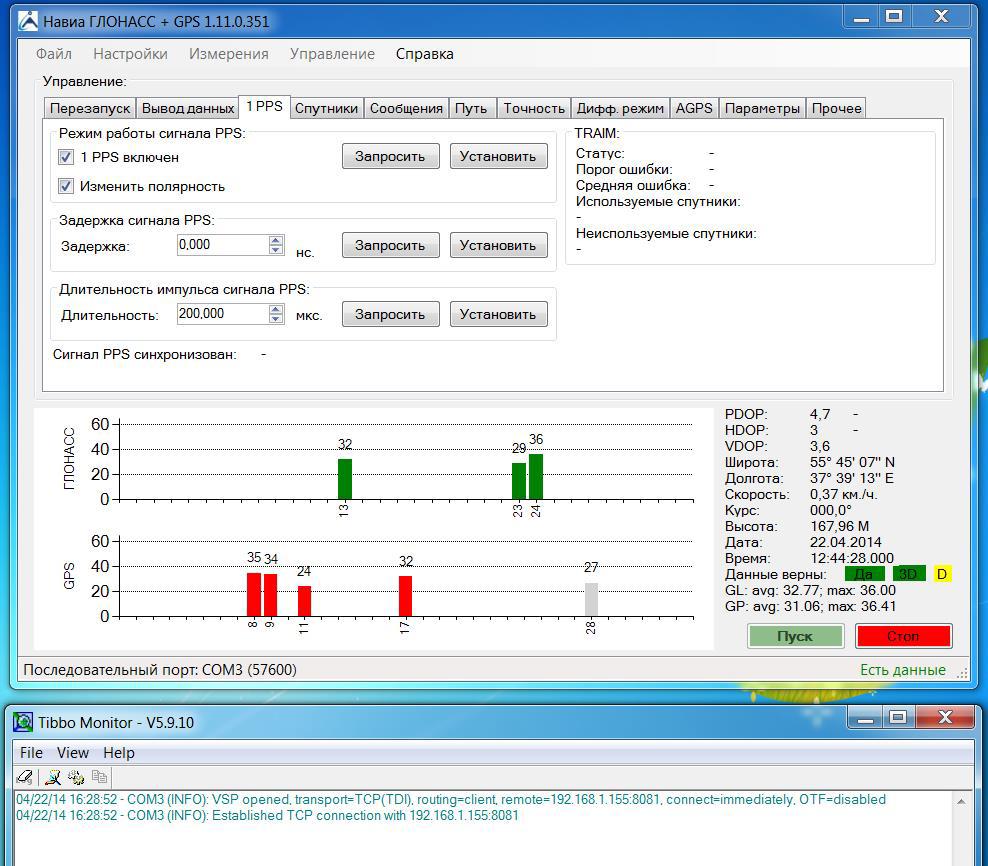
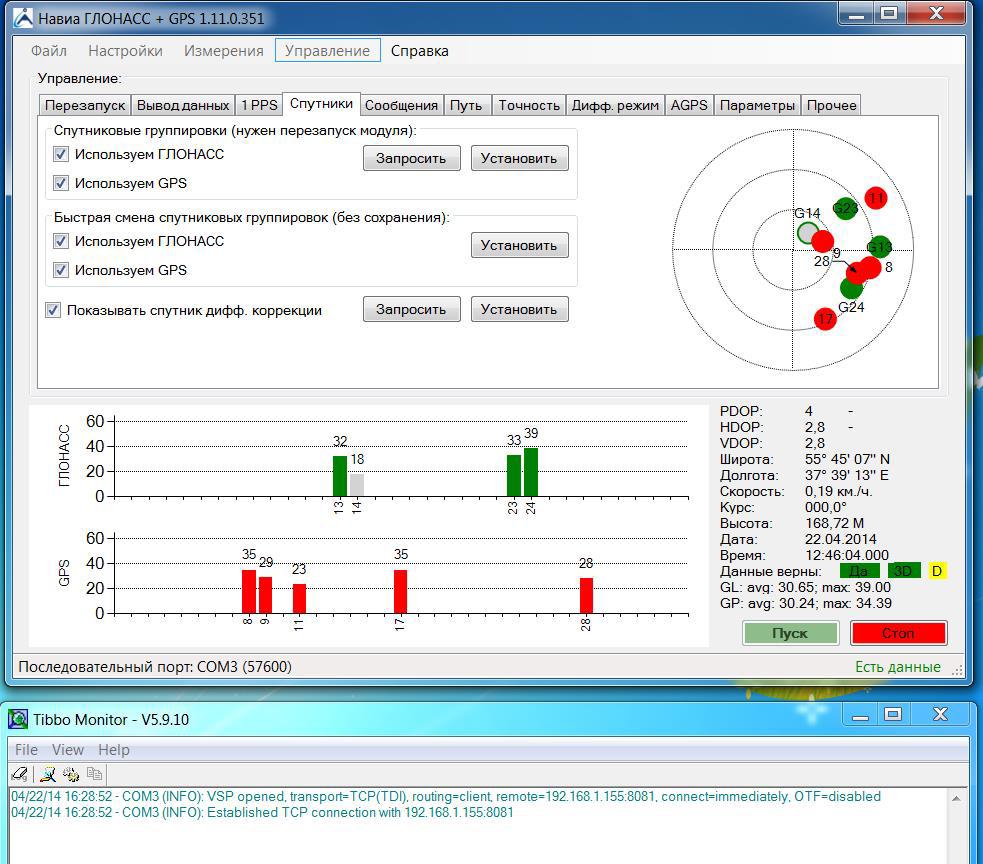
The second channel of the Wi-Fi channel of the module is used for full communication with the ML8088 module for the Navia program supplied by Navia. The program can communicate with the module connected to the serial port. I used the Tibbo program to organize a virtual serial port. Tibbo, unlike similar programs, automatically starts and organizes the channel without the need for manual intervention. I also tried the Virtual serial port driver from HWGroup . It works, but it requires manual manipulations after starting the computer>, this is inconvenient.
Here are a couple of screenshots:
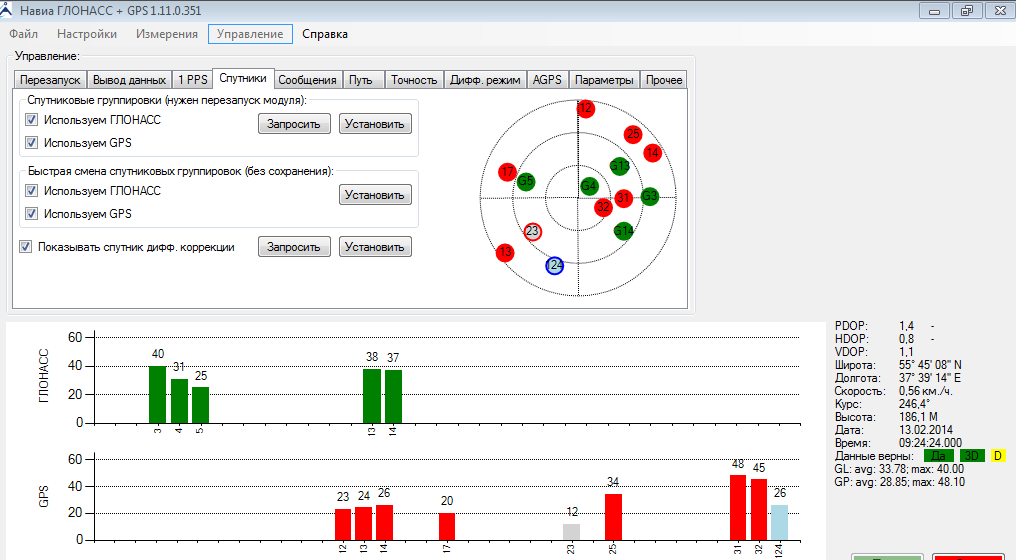
Another screenshot, interesting by the presence of a differential correction satellite, it is in the blue circle:
I run this complex in a virtual machine running VMware workstation.
From the screenshots you can see that TIBBO has established a connection with 192.168.1.155:8081 and presented it as virtual serial port COM3. In Navia GLONASS, the communication port COM3 is set and the entire farm automatically takes off steadily when the virtual computer starts.
Perhaps the authors of Navia GLONASS will be interested in finalizing the program so that it can communicate directly not only with the serial port, but also with the TCPIP channel. Display
applied to the deviceIt was bought on the dilkstrime for about 300 p. The display uses a controller ILI9341, of which almost everything is known, there are libraries and extensive experience of use. The only subtlety - the display is powered by +5 volts, and the inputs are designed for 3.3v. If you connect directly with Arduino nano - it will not work, but it will not burn either. I used the simplest converter 5 -> 3.3 -connected resistors 2.7 K. The MOSI signal does not require a resistor - it goes from the display to the processor. The LED signal also does not require conversion.
The standard TFT v2 library with minor modifications was used to work with the display. In the standard library, the output of the symbol illuminates the necessary points, but does not erase non-illuminated ones. The first time after erasing the screen, everything will be correct, and the second and subsequent ones will not. Matrix points will only be turned on, but not turned off, and in a dozen iterations on the screen you will get a rectangle completely lit up with the symbol color. I added a piece to the library code that outputs the background color to unused points in the symbol.
I also had to change the pieces of code responsible for jerking the legs of RESET and CS. The library is designed to use D4 and D5 pins, and I needed them to work with timers. Therefore, the display pins are connected to pins D8 (Reset) and D9 (CS) and the following changes are made to the code:
The full text of the program and the modified libraries can be found here.
In the final version of the device, only the T1 counter is engaged, counting the pulses from the D5 pin. Conclusion D4 remained untapped.
Since the device is designed for use in the 24 by 7 mode, I took measures against the screen burn-out effect. All elements displayed on the screen change color randomly and move around the screen a bit too randomly. I can not say that it is very necessary for proper operation, but programming was fun :)
The device is powered through the mini usb connector on the Arduino. The internal battery was not provided for, and to ensure the ability to work autonomously - for example, to check the garden area, a 4000 mAh power bank was purchased. Measurements showed that the actual capacity is about 3000 mah, but this capacity is enough for the radiometer to work for more than 10 hours. Walk around the cottage is enough in abundance.
To receive and process data, use the Radiometer program, written in Visual Basic in the Visual StudioExpress 2012 environment.
The program receives data from the radiometer in the background stream, displays the received data in the form of text and graphics:
The program has a mechanism for reconnecting in case of a signal failure. If the channel has fallen and there is no data after the specified timeout has expired, the program will close the channel, clean the “tails” and open the channel again. And it will do so until the connection is restored. In the case of a radiometer, the timeout is set to 3 minutes. The normal data arrival interval is 2 minutes. The program correctly performs and disconnects - switching on the transmitting module, Wi-Fi access point or any connected equipment along the data flow path.
The channel opening and closing events are written to the log. Also marked the event start and stop the program.
Data and events are separately written to two separate text files.
When the timer is triggered, once every 10 minutes, the program for recording statistics in a log file is executed.
Upon the arrival of data from the channel, they are placed in a buffer and, when certain conditions are reached, this buffer is sent to the input data processing program. In this program, the condition is that the last bytes of the string are equal to vbCrLf (i.e., Hex (0D0A), they are also the characters "carriage return", "return string").
The processing routine checks the input string for formal validity using a regular expression mechanism. If the line has an invalid format - this is left a mark in the log file. If the string has a valid format, the program splits the string into elements using a regular expression mechanism, resulting in an array of elements.
Further processing consists in entering the necessary elements into arrays of the “FIFO queue” type (QUEUE).
The QUEUE array calculates the maximum, minimum, average, and the standard deviation. To calculate the maximum, minimum and average, the ready-made methods of the object are used. The calculation of the standard deviation is done by outputting the elements of the queue to the array and processing this array. As far as I was able to understand from the documentation, you can make your own method, but it did not happen with a swoop and I left it for the future :).
The length of the queue is chosen to be 2400 elements, which, given the data arrival interval of two minutes, gives a background image of radioactivity approximately 80 hours ago.
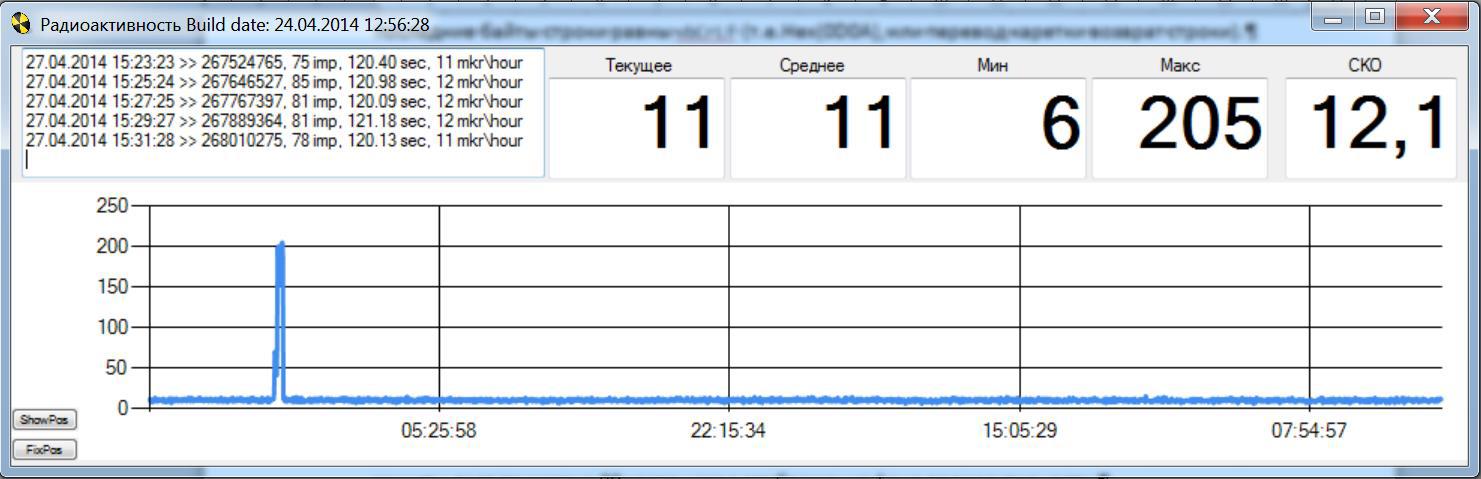
The peak on the graph is the result of a compass offering.
The program can be downloaded here.
Description of the sketch in Arduino.
Block –sketch scheme:
Run the program
Display initialization
Initialization of timer T1, transfer it to the pulse counting mode from an external input.
Initialization of the serial exchange at a speed of 57600
Sketch basic loop
Counter reset
Memorizing start time
Receive data from the serial port, search message 1 ("$ GPRMC")
Receive data from the serial of the port, search for message 2 ("$ GPGGA")
Receive data from the serial port, search message 3 ("$ GPVTG")
Parsing and displaying data from GLONASS \ GPS
Displays the current state of the T1 counter
Check the condition of the end of the cycle - the time has expired or the counter counted more than 100 pulses
Fixing meter and timer readings
Calculation of radioactivity
Display output
Output to the series channel
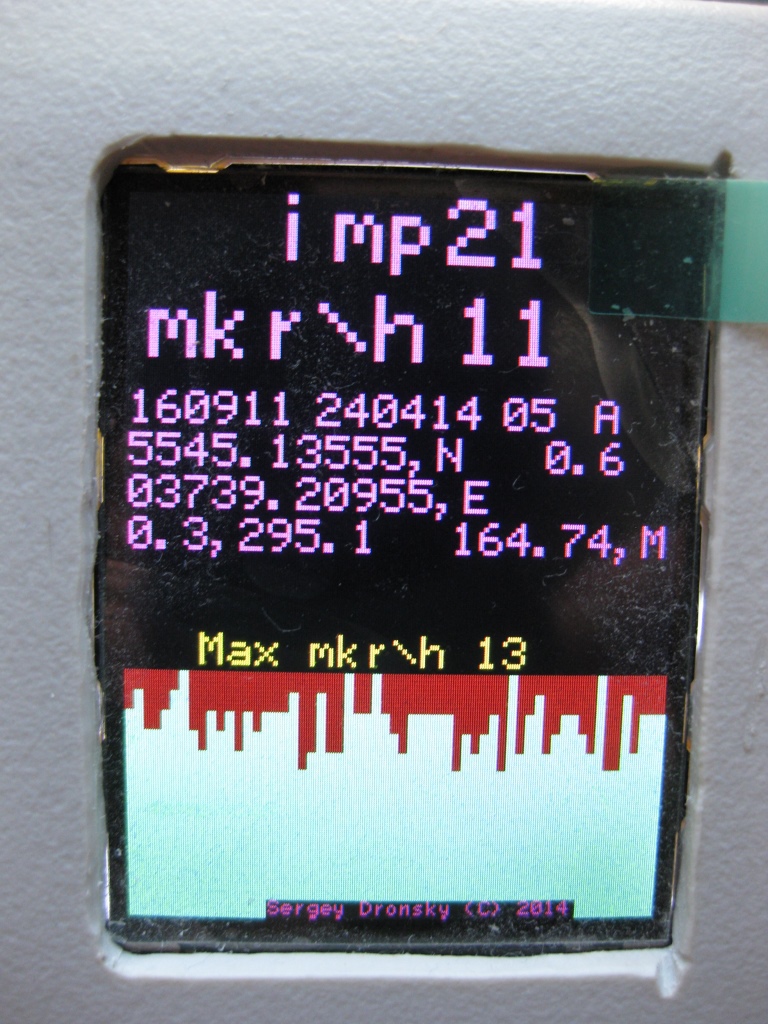
Description of the output to the built-in display.
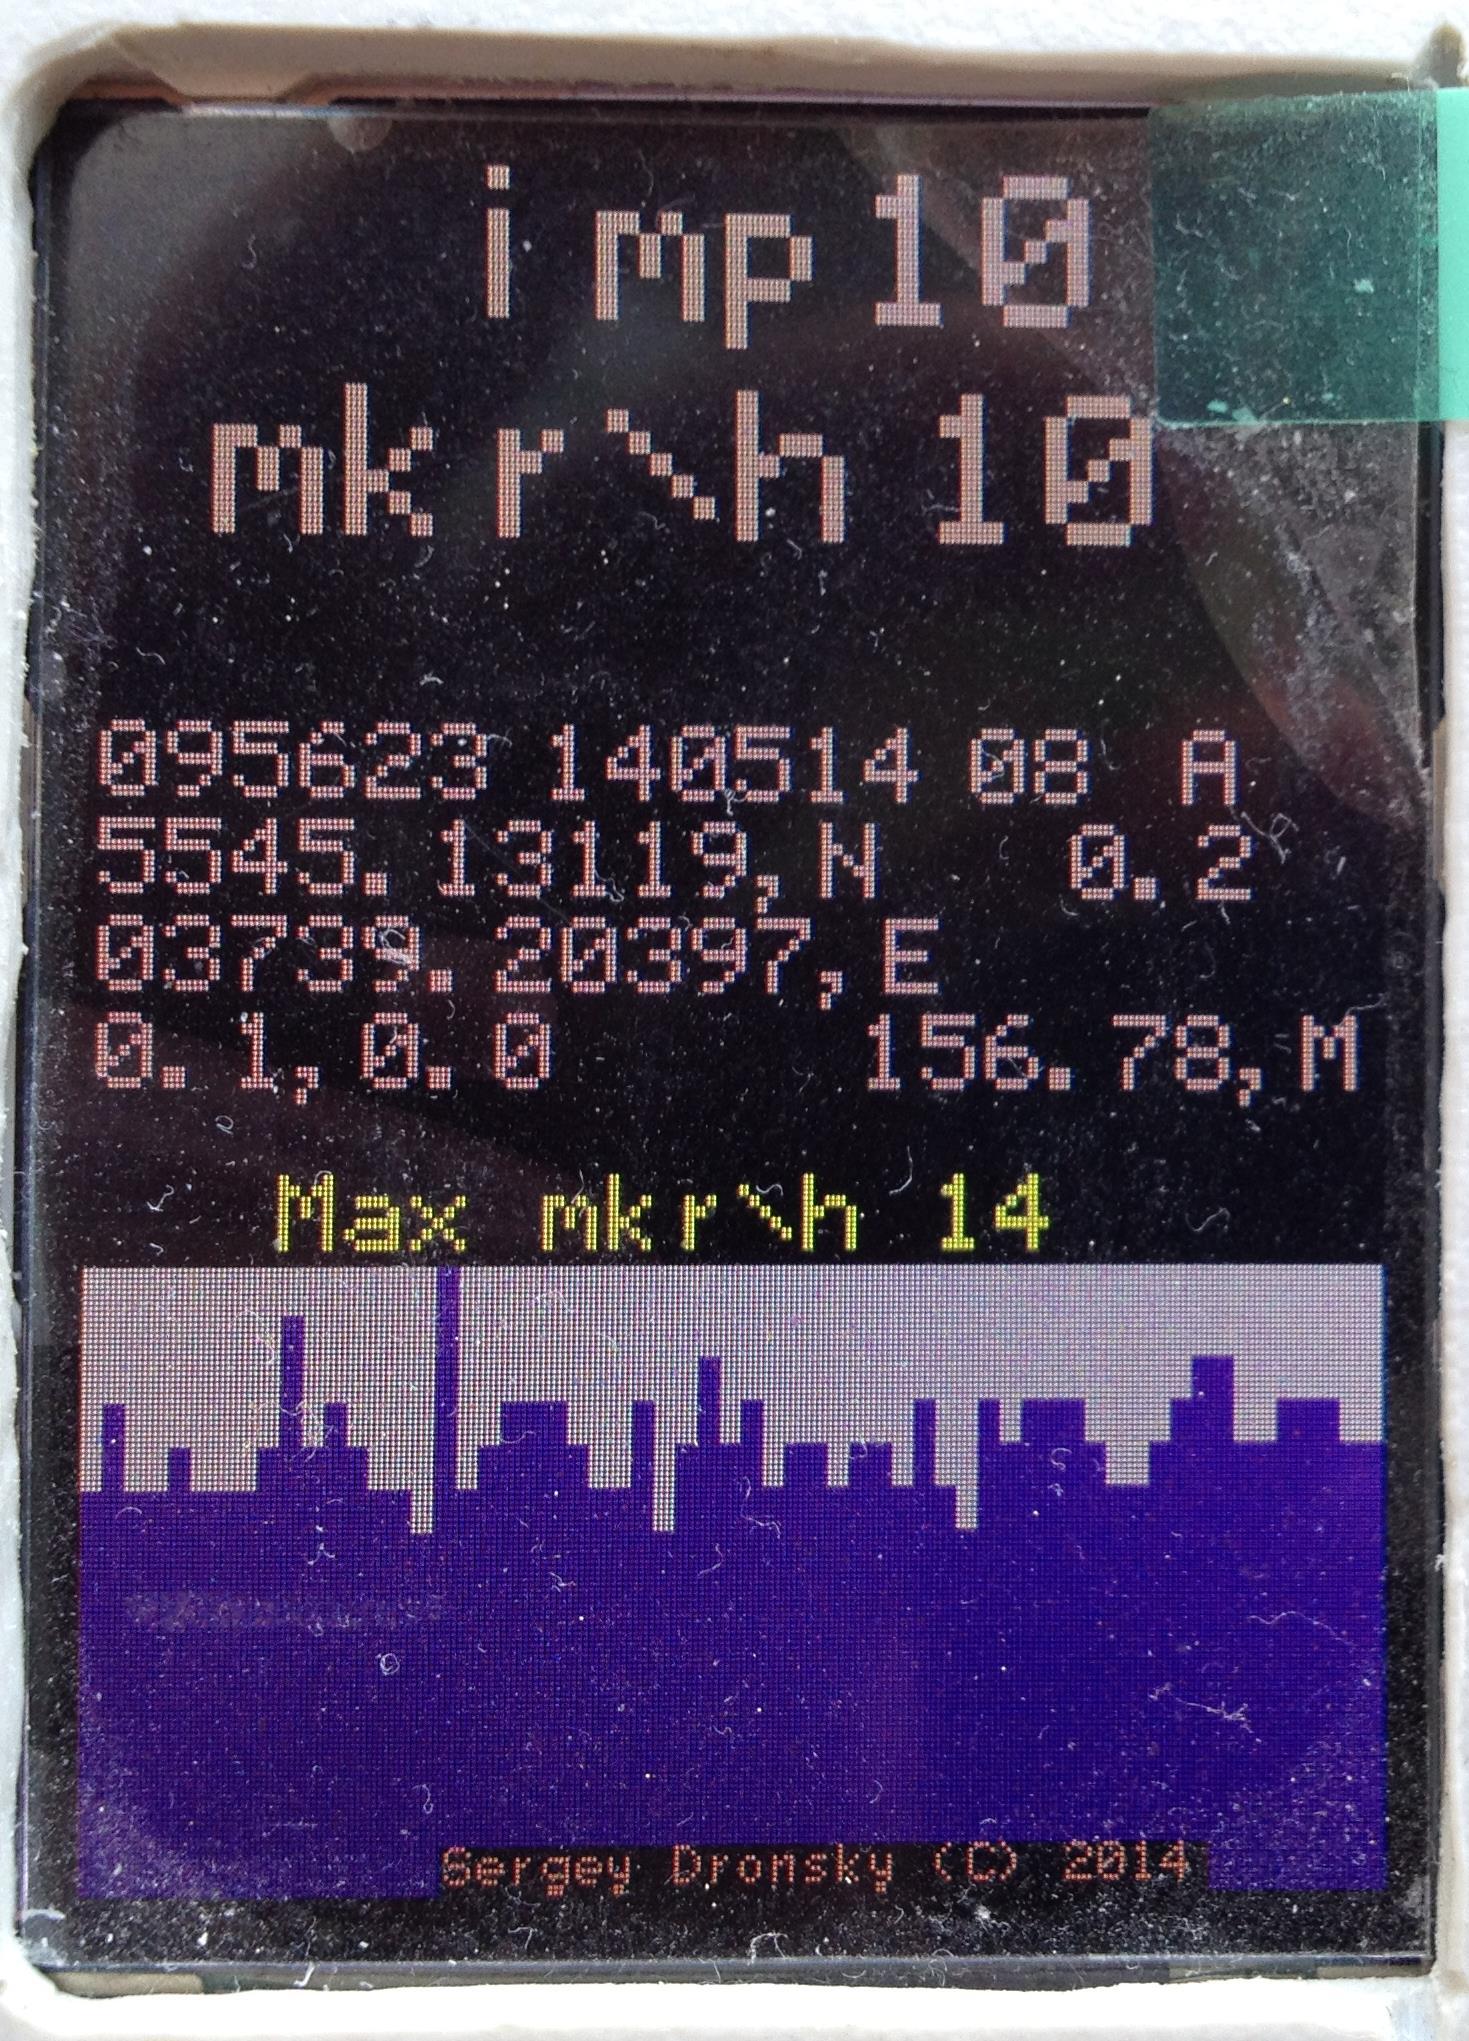
The first line shows the number of registered pulses in the process of measuring radioactivity. The number changes about once a second.
The second line shows the calculated value of radioactivity in the previous cycle.
Next is a block of four lines. This is the output of information from the Glonass \ GPS module.
The first line - UTC time, date, number of satellites, the data from which were used in the solution calculation, a sign of the solution (letter A or V)
095623 140514 08 A - 9:56:23 UTC 05/14/2014 8 satellites and there is a solution.
The second line is the latitude and speed in km / h.
5545.13119 N means 55 degrees 45.13119 minutes north latitude
Third row longitude
03739.20397 E means 37 degrees 39.20397 minutes east
The fourth is the speed in miles per hour, the angle of movement in degrees and the height in meters.
The output of GLONASS \ GPS data is made simply - parts of the character strings are simply output without any conversion.
Next, the maximum value of the radioactivity at the time of observation is displayed.
A running graph shows the change in radioactivity over time. The graph automatically adjusts to the maximum value in the ring buffer. When you bring a compass, we get the following picture:

I will be glad to answer questions.
')
For the last few years I have been engaged in the construction and practical manufacturing of various home automation, control and monitoring of environmental parameters devices during my free time. Now I have a lot of free time and I got the opportunity to describe what was done.
My devices are connected to the home network via Wi-Fi, in the home network there is a silent fanless control machine with a solid-state disk. This machine performs the functions of the system core, it runs data acquisition programs from a variety of sensors and an external device control program.
The task that I wanted to solve with a radiometer, I formulated like this: “I want to have a device that will measure radiation in a general sense”. The device must show the level of natural background radiation, respond to changes in this background, have a measurement range of at least the applied sensor and be able to transfer data to an external recorder. It would be nice to have a search function in the device: when you can move the device near the “hot spot” and find it by changing the readings of the built-in indicators. It would be nice to have the autonomy of food for a while, for example, walk around the dacha and check if everything is in order.
The first question to decide is which sensor to apply. Studying materials on the measurement of radioactivity gave me an understanding that the optimal sensor for my task is an ordinary Geiger-Muller sensor. Traditionally, these devices are called “Geiger-Muller counters”, although in reality they do not consider anything, but give impulses to each particle that could start the avalanche breakdown process in the measuring chamber. Therefore, I use the term "sensor". There are a lot of them, for different purposes. I wanted my device to be sensitive enough to beta radiation, not just gamma. Widespread and cheap (in the range of 200 - 1000 r) SBM20 are insensitive to beta radiation, they do not have a window that is transparent to beta particles. The SBM20 is primarily sensitive to gamma radiation, and to a fairly powerful one. It is clear why they were made for military purposes. The use of such a sensor in the radiometer requires a large time of data accumulation for more or less adequate measurement of the natural background. For the SBM20, this time usually takes 46 seconds, while the number of accumulated pulses is equal to the current gamma background value in micro X-rays per hour. But I wanted more sensitivity to beta radiation. I did not count on a cataclysm, I was interested in the everyday dimension of small values. If you want to be ready for a cataclysm, you can search and buy some DP5V from storage, replace three capacitors with good film capacitors and get a military-style device, in a green box, foolproof, suitable for measuring radiation up to 200 roentgens per hour in extreme conditions.
I will also note that there are other methods for detecting charged particles, for example, on the basis of scintillation crystals and photomultiplier tubes. These measurement methods make it possible to measure the distribution of the power spectrum of a radiation flux, but for my purpose it is redundant and very expensive.
So, I need a Geiger-Muller counter with beta sensitivity. Fortunately, these sensors are manufactured in Russia. I chose the Beta sensors. They are produced by NPF Consensus . A very kind and customer attitude of the plant employees played a certain role in the decision to buy just such a sensor. I tormented them with stupid Dummy questions and received quite adequate answers to them. To buy a sensor, I had to go to Zaprudnya. It is about 100 km on Dmitrovka, almost reaching Dubna. A desire to see new places also played a role in the decision making about the trip :)
The BETA-2 sensor I have chosen has a mica window with an area of 13.8 cm2 and is sensitive to beta radiation.
To work he needs 400v. An important sensor parameter is recovery time. The essence of the sensor operation is the ionization of the gas in the chamber during the passage of a charged particle and the subsequent avalanche breakdown, then the additives in the gas come into play and quench the discharge. The sensor after quenching the discharge takes some time to restore sensitivity. This time (the term "dead time") is indicated in the characteristics and for specifically Beta-2 is 140 microseconds minimum. Converting to frequency gives us the maximum pulse frequency from the sensor in the region of 8 kHz.
Passport scan:
There are two methods for retrieving data from a Geiger-Muller counter. The first is that a resistor in the region of 10 mega ohms is put in series with the anode and a negative pulse is fed through a capacitor with a unit of picofarad and an operating voltage of about 500 volts to the recording circuits. The pulse is suitable for direct control of the chip's CMOS input.
The second is that a resistor is placed in the cathode circuit and a positive pulse is produced on it, which is fed to the base of the transistor. With this inclusion is not required high-voltage capacitor.
The standard method recommended by the manufacturer is to remove the signal from the anode. NPF Consensus experts could not answer why such inclusion is correct. I received the answer later from the author of the PN400 power converter — he believes that a large cathode surrounds the anode and plays the role of a screen for the anode, and such switching on reduces interference and the number of false positives.
Schematic diagram of the radiometer
Construction photos:
The signal from the sensor through the forming protective circuit can be directly fed to the inputs of the microprocessor. But I decided to put an additional forming element on the dual 564AG1 one-shot one. The first one-shot creates a pulse of 50 μs duration, and the second –2.5 ms to feed to the LED. The LED serves as a trigger indicator and allows you to search for a hot spot by the intensity of the blinking diode. Initially, I wanted to put two counters - one for beta, the other for gamma. Therefore, a two-channel timer was used and an HL2 led indicator was supplied to the output of the first channel of the single vibrator.
After launching the first channel, I was convinced that Beta-2 responds well to the natural background (1), the cost of the second sensor is still high (2) and I also wanted to install a navigation sensor (3). Of these three reasons, the decision to change the plan appeared, not to put a second gamma sensor, but to put a navigation sensor.
Therefore, the SMD LED remained in place, the timing chains of the second channel AG1 were changed (the resistor was increased from 2 to 100 k) and the output of the second channel was output to a large bright red matte LED on the front panel. A 50 μs pulse is clearly visible, but a 2.5 ms pulse is seen perfectly:
This hardware solution will also work if Arduino Nano fails, allowing you to navigate the environment by the frequency of the LED blinking.
I didn’t make sound accompaniment because the main application of the device is the measurement of background activity.
As a radiometer processor, I chose the Arduino Nano. The reasons for this choice are the price (200 rubles from China), small size, a huge number of ready-made solutions and already existing experience of using such boards in homemade products. The main question was - is there enough processor speed to process the pulses that quickly follow each other? From the study of similar devices and descriptions of programs, it became clear that the supply of pulses from the counter to the input of the processor and the programming of the interrupt requires a high speed of the processor and serious programming efforts. However, fortunately, the applied processor has three timers-counters, two of which can be switched to the external pulse counting mode from the outer leg of the processor. This radically simplifies the task. It is enough to zero the counter at the beginning of the measurement cycle and at the end read the number of pulses. The account is performed at the hardware level, without requiring the attention of the processor. The resource of the processor can be used to exchange data and draw the screen of the device.
The algorithm for recalculating the number of accumulated pulses for a certain time is based on the passport characteristic of the counter:
Sensitivity to 60 Co imp / μR: 160 ÷ 240
Those. to calculate the x-ray per hour, you need to know the number of pulses, the time interval and the sensitivity of the counter. The calculation formula for sensitivity 200 looks like this:
R = CT / DELTA_T * 18
Where CT is the number of pulses per DELTA_T interval in seconds, and R is the current value of radiation in micro X-rays per hour.
Those interested can derive the formula on their own, it is not difficult :)
Measurement of radioactivity is the measurement of the parameters of a stationary random process. The random process is characterized by expectation and root-mean-square deviation. The smaller the standard deviation, the more accurately we measured the parameters of the random process. RMS decreases to stationary value with increasing number of pulses. Those. the more accurately we want the result, the longer we have to measure.
From a practical point of view, this means that for measuring the background and small fluctuations of this background, the measurement time should be long — a couple of minutes. If we want to use the device to search for a “hot spot” - it is desirable to minimize time.
To meet both requirements, I made an adaptive measurement algorithm. To this end, during the pulse counting process, the sketch checks the contents of the counter during each pass and if it is more than a predetermined setpoint (100), then an early exit from the cycle occurs. If there is no excess, then the counting of pulses goes before the time expires in 120 seconds. Thus, in the background measurement mode, the measurement takes 120 seconds, which gives the standard deviation 1.3.
Screenshot of the Radiometer program, measurement of background values:
If the situation changes dramatically, the score ends much earlier and the readings of both the built-in display and the external receiver are updated much faster. The setting “100” is selected from the observation of the background measurements, in 2 minutes the number of pulses is usually in the range of 50-80. When measuring the compass activity, the counting cycle is about 10 seconds, the standard deviation is 17.6:
Screenshot Radiometer, measurement of the radioactivity of the old compass:
Here is this compass:
Here is a photo of the usual situation, the measured background is 11 μR \ h, which is close to normal for Moscow.
To power a Geiger-Muller counter, a 400 volt source is required.
I used the ready-made converter PN3-400-0.1M, purchased for 750 p. These transducers can be purchased through ebay (search for “Geiger counter power supply module 1VV 400V high voltage” or for “Adjustable telescope”).
I didn’t want to wait and I found the author of the product (it turned out to be Moscow region), he recommended one of his representatives in Moscow to me and he was brought to the nearest metro station for cash. There were no problems with the product, it worked right away and did not cause any questions.
I used a rather large housing for the instrument: the Gainta 413, measuring 150 by 80 by 30, bought in Brown Bear. At first I thought about two Geiger-Muller counters - one for beta, the second for gamma. It would be possible in one measurement cycle to obtain data immediately on both gamma and beta separately. Space for the second counter was provided above the first. However, after launching the system, I saw that with a single sensor, the radiometer does what I want - it cheerfully responds to background radiation, to an old compass, to crystal objects, to thorium welding electrodes, and to a bag of potassium fertilizers. Therefore, I refused to install the second sensor on the gamut and switched to a backup plan - the placement of Glonass / GPS navigator. Practical use was thought of as follows: I found a “hot spot” (for example at the dacha), wrote down the coordinates, and handed it over to the MOE for decontamination. In reality, it was just interesting to try to tinker with the new technology.
Beta particles are characterized by low penetrating power. Even a sheet of paper - a serious obstacle, not to mention the body thickness of about 5 mm. In order to use all the features of the Beta 2 sensor, I have provided an opening round flap to give Beta radiation direct access to the sensor. The round hole in the body is made with a circular saw on wood. The cover is made based on the launcher of domestic intercontinental ballistic missiles. On the reverse side are attached flat limiters from the debris of a stationery knife, reduced to a rectangular shape on the sharpener. A magnet from the terminal client kit is used to fix the lid. In this terminal client such magnets are used as legs. When working with a magnet, we must remember that the Curie point of this alloy is less than 80 degrees Celsius and overheating will lead to the loss of properties.
The device of the lower part of the body with an opening cover for the passage of beta particles:
The Beta-2 sensor is placed on the bottom plate in the hole slightly larger than the diameter of the meter. Under the counter, self-adhesive felt circles are installed, performing the role of spacers between the bottom surface of the sensor and the housing. The mica sensor window is very thin and requires careful handling. During final assembly after debugging, I aligned the sensor with the hole in the case and fixed the sensor with hot glue.
You need to open the window if you need to measure activity or search for a weak beta emitter.
For example: an old compass with a glowing in the dark composition. With the lid closed - 70 microroentgen per hour. With the lid open - 200 microroentgen per hour.
Measurements of the radioactivity of crystal glassware:
Navigation module
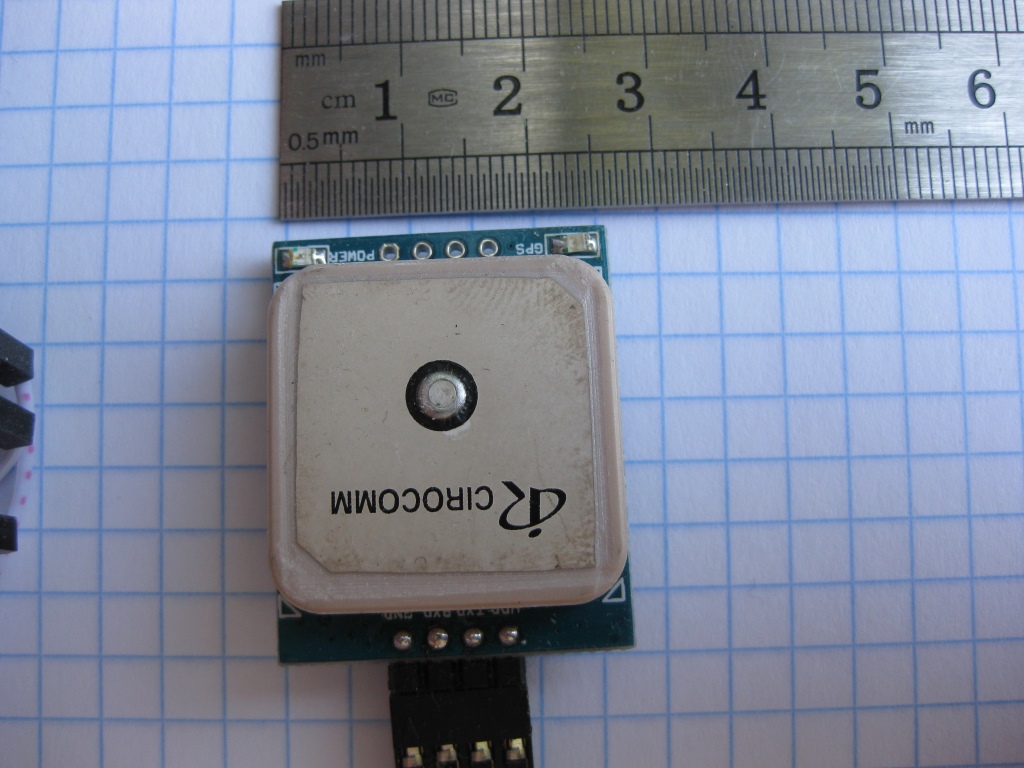
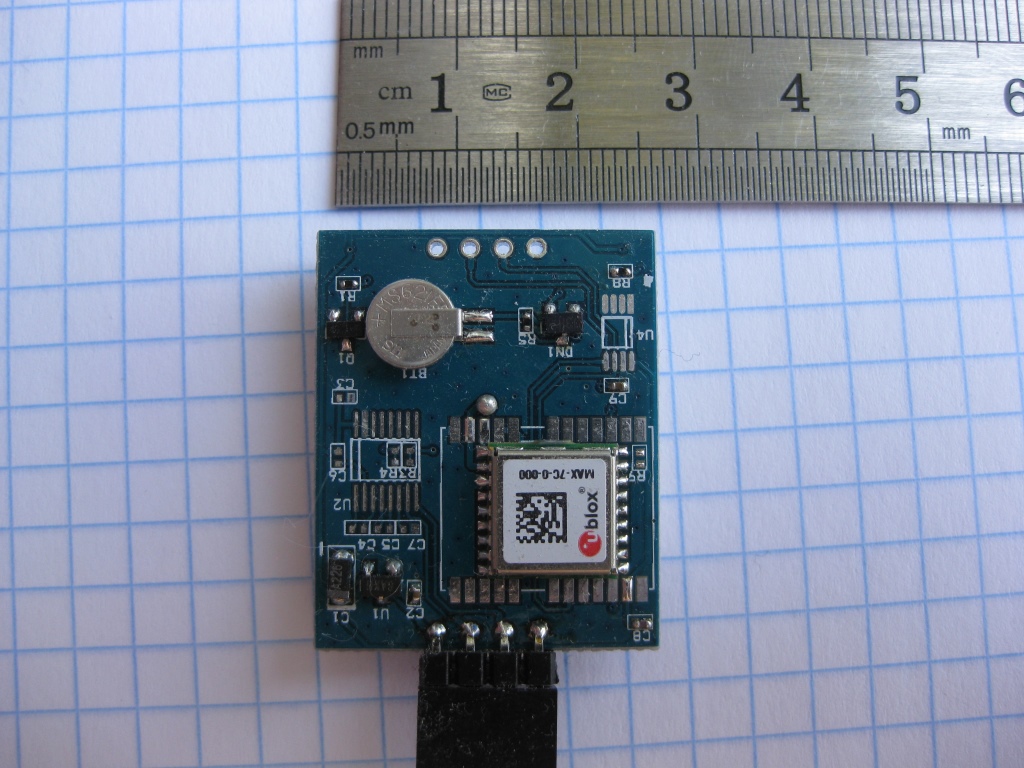
At first I found a receiver based on UBLOX7m on ebay GPS \ Glonass. This device looks like this:
It is simple to connect - just feed it (+ 3.3V) and connect the 3.3 v connector via the serial. I used an FT232 based converter:
The branded program allows you to play with the module - get the coordinates of the place, look at the satellites, etc.
Screenshot of the ublox program:
Unfortunately, the module, although it can work with the Glonass constellation, but in a truncated version. First, the module is single channel - i.e. he can only work with one constellation at a specific time. Switching the constellation requires reloading the module. Secondly, when the constellation Glonass is turned on, the module stops working with data from the satellite of the differential correction.
I wanted the module to work simultaneously with Glonass and GPS. There are such modules, in particular, ML8088 of the St. Petersburg firm Navia. Unfortunately, I did not find a ready-to-use module suitable for installation in a homemade device. There are ready-made devices on the ML8088, but they were not suitable for my device either in price or size. And I decided to make my own module :). I bought a B35-3556920-AMT03 [GPS / GLONASS] antenna and a ML8088s module in DESSY.RU . The antenna needs a dual-system - the Glonass and GPS have slightly different carrier frequencies.
According to the instructions of the manufacturer of the antenna, it should be installed on a conductive base measuring 7 to 7 cm in the center. It was very successful - a 7 by 7 cm square was precisely placed in my body. When designing the glonass module, I had to decide how to connect the antenna to the input of the ML8088 module. The manual should use a microstrip or coplanar line with an impedance of 50 ohms. Such a line requires reasonably accurate conductor strips on the PCB. Make it my favorite method of cutting tracks on the board with a stationery knife is difficult. Having carefully considered the situation, I decided to do without a microstrip line at all and connect the antenna directly to the receiver input. The manual says - the shorter the transmission line from the antenna to the input, the better. So, zero length is optimal. It was necessary to develop a fee, respectively, from the installation of the antenna. However, when the size of the board is 7 by 7 cm, the displacement of the micromodule does not cause any problems.
This design required a certain sequence of installation elements. First, it was necessary to glue the antenna, then adjust the ML8088 so that the antenna leg goes into the recess of pin 21 and grab the ML8088 in that position. Then mark the position of the conclusions ML8088, remove the micromodule, cut through the tracks. And solder the legs of the chip, taking breaks for cooling. Unfortunately, I was mistaken and did not tamper with the deepening of the antenna output before soldering the antenna. The soldering did not work out, the system caught a couple of satellites after an hour of work ... Having considered the situation, I decided to remove the antenna, chew the output and solder the antenna back. The difficulty is that it is necessary to simultaneously detach the antenna from the base and unsolder the output. But I was lucky - I put the diagnosis “not drunk” correctly and the antenna bounced off the leg as soon as I a little bit unstuck the antenna from the base. Then everything turned out well - the output was tangled, the antenna was soldered and the system worked as it should.
When diluting the antenna connection, it is imperative to consider the requirement from the documentation - the antenna ground must be connected to pins 20 and 22 and more to not have contact with the common ground. This is necessary to prevent the formation of earth loops and reduce noise immunity. Conclusions 20 and 22 of the ML8088 are connected to the ground inside the micromodule.
It turned out that in the factory supply in the ML8088sE there is a firmware firmware that does not support the slow blinking of the output “there is a solution”. I signed with the manufacturer and received a new firmware and detailed instructions for flashing. I did it all.
I want to thank Vladimir Osadchy (technical director of Navia ), who kindly and patiently answered my questions.
It was not possible to convert the signal "there is a solution to the navigation problem (GNSS)". This is a signal that flashes at a half-heart rate if the module has solved the navigation task and the data issued by it is correct. The signal amplitude is 1.8 volts and the load capacity of this output is about 2 ma. But the scheme from the manual (ML8088sE inclusion AppNote 1_1.pdf) did not work.
It seems that there was not enough load capacity to achieve a confident opening of the transistor. The effect was strange - if the system started incorrectly - a sufficient signal was generated at this output to control the conversion circuit and the control LED blinked happily with Morse code. And when the system started correctly, the signal amplitude was smaller and the transistor did not open. According to the developer, the signal should be enough. He brought an oscilloscope from the balcony and made sure that there is a signal, but the level is low, only 0.4 volts ... Vladimir Osadchy called a specific model of the transistor, which works exactly for him, but I went my own way and applied another LM393 junk comparator :). The second channel of this comparator I used to indicate the PPS signal. Along the way, I changed the parameters of the 1PPS signal, made a 200 μs long signal.Now I have a comfortable unobtrusive display of the functioning of the system with a short smile :).
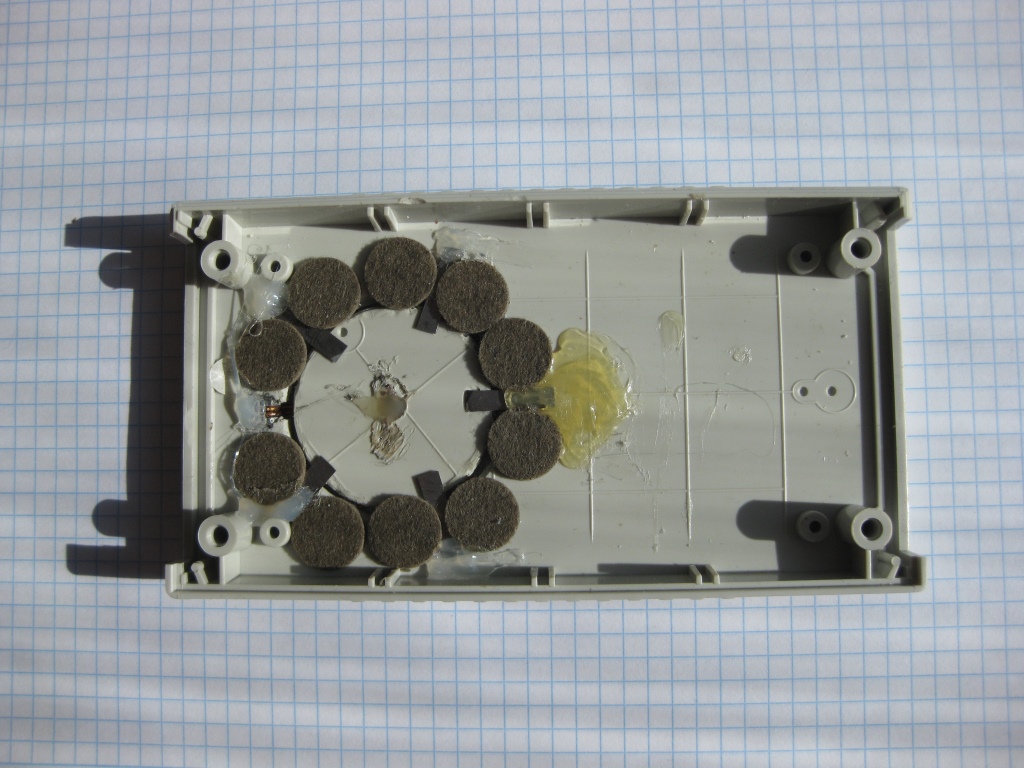
The final version of the Glonass / GPS module looks like this:
and placed in the case: The
upper non-attached connector is designed to fill the firmware into the module.
Yellow rectangle of soft plastic - spacer, abutted against Beta-2 when closing the case.
The ML8088sE module has two exchange channels for the serial port. Navigation data comes one at a time, debug information or firmware follow through the second. By default, the channels are tuned to the speed of 115200. I switched them to 57600. I had to do so because of the speed limitations of the second Wi-Fi channel of the HI-LINK HLK-RM04 module. Details about it below.
I used an external backup battery like CR2032. With it, the start of the module is much faster, since everything necessary for a quick calculation of the positions of the satellites and from capture to tracking mode is already in memory. In this mode, a module reset is usually not required. Reset is needed when you first turn on or if the module did not start correctly. If the module did not start correctly, the LED of the presence of the solution will repeat a certain code cyclically. A reset causes the module to return to normal. In my case, a reset was required after soldering parts. I implemented two independent mechanisms for resetting the module. The first is a regular button, recessed in the case, so as not to interfere and not to accidentally press it. The second is software. At startup, the sketch waits for five seconds, then begins to receive data from the ML8088sE.If there is no data for the timeout interval, the sketch resets the module with a negative pulse from the A0 pin. It is important - when starting the module, it is necessary that the reset pin be in the high-impedance third state. Therefore, after issuing the reset command, I put the output A0 in input mode. The button and the output of Arduino are connected in the "mounting or" mode.
My device communicates with the outside world through the “HI-LINK HLK-RM04 Serial Port-Ethernet-Wi-Fi Adapter Module” module , which is essentially a mini-router with great capabilities. I use it in converter mode, serial port to Wi-Fi. The device has two ports, one can work at speeds up to 115200, the second - up to 57600. Glonass navigator is connected to the second port and therefore the ML8088 exchange rate had to be reduced to 57600. Unfortunately, this module comes from China without an internal antenna and tuned to an external the antenna. The photo in the store has an internal chip antenna. I had to buy external ANT 2.4 ESG-2400-12 UFL-F antennas in DESSY.RU and demand from DX a commensurate price reduction. Similar antennasThere is also in DX, it is probably worth buying them immediately when ordering a Wi-Fi module. I tried to connect to the module two different whip antennas from some router and PCI card — it works, but the signal level is about 10 dB lower compared to a flat antenna. Plus it is much more convenient when placed inside the case.
The Wi-Fi module has a 3.3 volt output from the internal stabilizer. It is enough to power the Glonass module ML8088sE.
The first channel is used to work with Arduino. The data generated in the Arduino program (from the radiometer) is transmitted to the first channel of the Wi-Fi module and transmitted to the home network. They can be received by any program like PUTTY, which can be connected to the specified IP address and port. Navigator is connected to the second serial port. The data from the navigator also goes to the serial port of Arduino, the program processes the data from the navigator and displays it on the screen.
I researched the issue of using the software serial of the port, but I decided that it would not work reliably and would require programming with great effort. So I came up with a hardware hack :).
First, let me remind you how the transmission of information on the serial port. The serial signal is transmitted by negative drops from +5 to 0. In the initial, inactive state, the signal has a high level (+ 5V). Inside the Arduino Nano, the signal from the FT232 output is transmitted to the serial input of the ATMEGA328P via a protective resistor of 1 kilo. Here is a piece of the concept:
The top diagram shows the connection of the RX and TX pins inside the Arduino board. The RX Atmega328P pin is directly connected to the pin of the Arduino connector and at the same time via a 1k resistor to the TX pin of the USB serial FT232RL. This makes it possible to transmit the serial date to the connector's pin and the signal will go directly to the desired microprocessor output and be processed correctly if the output of the FT232 is high. This condition is met when the computer does not send anything to Arduino, or Arduino works autonomously without being connected to the computer. In this case, the Atmega328P serial input turns out to be actually pulled to 5 volts through a 1 com resistor, as shown in the bottom diagram. In order not to interfere with the normal transmission of data from a computer via FT232 - you must use the transmitter with an open collector and output it to the closed state,when it is necessary to ensure the regular work of the channel series I just had a number of dual-channel comparators of type LM393, having an open collector type output.
The signal from the serial port of the Glonass module is transmitted through a comparator with an open collector type output. When the processor is reset, output A1 rises to the third state. The comparator's inverting input is actually connected to ground through resistor R11. At the non-inverting input of the comparator there is a positive voltage in the range from 0.4 to 3.3 volts. The output of the comparator is in a fully closed state and does not affect the work of Arduino in any way. The exchange of the microprocessor with the computer, loading the sketch into the memory - everything happens as usual. After starting the sketch, output A1 is switched to exit mode and a high level of +5 volts is set on it. The voltage at the inverting input becomes 1.65 V (half of 3.3V). The comparator begins to work as a repeater series of the signal from the Glonass module.The sketch reads data from the standard serial of the port and processes incoming data. When you start downloading a sketch to Arduino, first FT232 generates a processor reset, output A1 goes to the third state, and the output of the comparator goes to the closed state and ceases to affect the Arduino input series. Data transfer from the Glonass module is terminated and the sketch is loaded in a regular manner.
The LM393 comparator is used simply because there were a lot of them in the box on the table, where they got after dismantling from the gas sensor modules. Naturally, for the implementation of such a hack, you can use another logical element with an open collector type output or a control input to transfer the output to the third state.
This method of connecting information flows is called “installation OR”.
The second channel of the Wi-Fi channel of the module is used for full communication with the ML8088 module for the Navia program supplied by Navia. The program can communicate with the module connected to the serial port. I used the Tibbo program to organize a virtual serial port. Tibbo, unlike similar programs, automatically starts and organizes the channel without the need for manual intervention. I also tried the Virtual serial port driver from HWGroup . It works, but it requires manual manipulations after starting the computer>, this is inconvenient.
Here are a couple of screenshots:
Another screenshot, interesting by the presence of a differential correction satellite, it is in the blue circle:
I run this complex in a virtual machine running VMware workstation.
From the screenshots you can see that TIBBO has established a connection with 192.168.1.155:8081 and presented it as virtual serial port COM3. In Navia GLONASS, the communication port COM3 is set and the entire farm automatically takes off steadily when the virtual computer starts.
Perhaps the authors of Navia GLONASS will be interested in finalizing the program so that it can communicate directly not only with the serial port, but also with the TCPIP channel. Display
applied to the deviceIt was bought on the dilkstrime for about 300 p. The display uses a controller ILI9341, of which almost everything is known, there are libraries and extensive experience of use. The only subtlety - the display is powered by +5 volts, and the inputs are designed for 3.3v. If you connect directly with Arduino nano - it will not work, but it will not burn either. I used the simplest converter 5 -> 3.3 -connected resistors 2.7 K. The MOSI signal does not require a resistor - it goes from the display to the processor. The LED signal also does not require conversion.
The standard TFT v2 library with minor modifications was used to work with the display. In the standard library, the output of the symbol illuminates the necessary points, but does not erase non-illuminated ones. The first time after erasing the screen, everything will be correct, and the second and subsequent ones will not. Matrix points will only be turned on, but not turned off, and in a dozen iterations on the screen you will get a rectangle completely lit up with the symbol color. I added a piece to the library code that outputs the background color to unused points in the symbol.
Changes in library code
old:
void TFT::drawChar( INT8U ascii, INT16U poX, INT16U poY,INT16U size, INT16U fgcolor)
{
if((ascii>=32)&&(ascii<=127))
{
;
}
else
{
ascii = '?'-32;
}
for (int i =0; i<FONT_X; i++ ) {
INT8U temp = pgm_read_byte(&simpleFont[ascii-0x20][i]);
for(INT8U f=0;f<8;f++)
{
if((temp>>f)&0x01)
{
fillRectangle(poX+i*size, poY+f*size, size, size, fgcolor);
}
}
}
}
new:
void TFT::drawChar( INT8U ascii, INT16U poX, INT16U poY,INT16U size, INT16U fgcolor)
{
if((ascii>=32)&&(ascii<=127))
{
;
}
else
{
ascii = '?'-32;
}
for (int i =0; i<FONT_X; i++ ) {
INT8U temp = pgm_read_byte(&simpleFont[ascii-0x20][i]);
for(INT8U f=0;f<8;f++)
{
if((temp>>f)&0x01)
{
fillRectangle(poX+i*size, poY+f*size, size, size, fgcolor);
}
else
{
fillRectangle(poX+i*size, poY+f*size, size, size, BLACK);
}
}
}
}
void TFT::drawChar( INT8U ascii, INT16U poX, INT16U poY,INT16U size, INT16U fgcolor)
{
if((ascii>=32)&&(ascii<=127))
{
;
}
else
{
ascii = '?'-32;
}
for (int i =0; i<FONT_X; i++ ) {
INT8U temp = pgm_read_byte(&simpleFont[ascii-0x20][i]);
for(INT8U f=0;f<8;f++)
{
if((temp>>f)&0x01)
{
fillRectangle(poX+i*size, poY+f*size, size, size, fgcolor);
}
}
}
}
new:
void TFT::drawChar( INT8U ascii, INT16U poX, INT16U poY,INT16U size, INT16U fgcolor)
{
if((ascii>=32)&&(ascii<=127))
{
;
}
else
{
ascii = '?'-32;
}
for (int i =0; i<FONT_X; i++ ) {
INT8U temp = pgm_read_byte(&simpleFont[ascii-0x20][i]);
for(INT8U f=0;f<8;f++)
{
if((temp>>f)&0x01)
{
fillRectangle(poX+i*size, poY+f*size, size, size, fgcolor);
}
else
{
fillRectangle(poX+i*size, poY+f*size, size, size, BLACK);
}
}
}
}
I also had to change the pieces of code responsible for jerking the legs of RESET and CS. The library is designed to use D4 and D5 pins, and I needed them to work with timers. Therefore, the display pins are connected to pins D8 (Reset) and D9 (CS) and the following changes are made to the code:
Changes in library code
old:
#define TFT_RST_LOW {DDRD |= 0x10;PORTD &=~ 0x10;} //Added by Vassilis Serasidis (18 Oct 2013)
#define TFT_RST_HIGH {DDRD |= 0x10;PORTD |= 0x10;} //Added by Vassilis Serasidis (18 Oct 2013)
#define TFT_CS_LOW {DDRD |= 0x20;PORTD &=~ 0x20;}
#define TFT_CS_HIGH {DDRD |= 0x20;PORTD |= 0x20;}
new:
#define TFT_RST_LOW {DDRB |= 0x01;PORTB &=~ 0x01;} //changed by Sergey Dronsky 26 dec 2013
#define TFT_RST_HIGH {DDRB |= 0x01;PORTB |= 0x01;} //changed by Sergey Dronsky 26 dec 2013
#define TFT_CS_LOW {DDRB |= 0x02;PORTB &=~ 0x02;} //changed by Sergey Dronsky 26 dec 2013
#define TFT_CS_HIGH {DDRB |= 0x02;PORTB |= 0x02;} //changed by Sergey Dronsky 26 dec 2013
The full text of the program and the modified libraries can be found here.
In the final version of the device, only the T1 counter is engaged, counting the pulses from the D5 pin. Conclusion D4 remained untapped.
Since the device is designed for use in the 24 by 7 mode, I took measures against the screen burn-out effect. All elements displayed on the screen change color randomly and move around the screen a bit too randomly. I can not say that it is very necessary for proper operation, but programming was fun :)
The device is powered through the mini usb connector on the Arduino. The internal battery was not provided for, and to ensure the ability to work autonomously - for example, to check the garden area, a 4000 mAh power bank was purchased. Measurements showed that the actual capacity is about 3000 mah, but this capacity is enough for the radiometer to work for more than 10 hours. Walk around the cottage is enough in abundance.
To receive and process data, use the Radiometer program, written in Visual Basic in the Visual StudioExpress 2012 environment.
The program receives data from the radiometer in the background stream, displays the received data in the form of text and graphics:
The program has a mechanism for reconnecting in case of a signal failure. If the channel has fallen and there is no data after the specified timeout has expired, the program will close the channel, clean the “tails” and open the channel again. And it will do so until the connection is restored. In the case of a radiometer, the timeout is set to 3 minutes. The normal data arrival interval is 2 minutes. The program correctly performs and disconnects - switching on the transmitting module, Wi-Fi access point or any connected equipment along the data flow path.
The channel opening and closing events are written to the log. Also marked the event start and stop the program.
Data and events are separately written to two separate text files.
When the timer is triggered, once every 10 minutes, the program for recording statistics in a log file is executed.
Upon the arrival of data from the channel, they are placed in a buffer and, when certain conditions are reached, this buffer is sent to the input data processing program. In this program, the condition is that the last bytes of the string are equal to vbCrLf (i.e., Hex (0D0A), they are also the characters "carriage return", "return string").
The processing routine checks the input string for formal validity using a regular expression mechanism. If the line has an invalid format - this is left a mark in the log file. If the string has a valid format, the program splits the string into elements using a regular expression mechanism, resulting in an array of elements.
Further processing consists in entering the necessary elements into arrays of the “FIFO queue” type (QUEUE).
The QUEUE array calculates the maximum, minimum, average, and the standard deviation. To calculate the maximum, minimum and average, the ready-made methods of the object are used. The calculation of the standard deviation is done by outputting the elements of the queue to the array and processing this array. As far as I was able to understand from the documentation, you can make your own method, but it did not happen with a swoop and I left it for the future :).
The length of the queue is chosen to be 2400 elements, which, given the data arrival interval of two minutes, gives a background image of radioactivity approximately 80 hours ago.
The peak on the graph is the result of a compass offering.
The program can be downloaded here.
Description of the sketch in Arduino.
Block –sketch scheme:
Run the program
Display initialization
Initialization of timer T1, transfer it to the pulse counting mode from an external input.
Initialization of the serial exchange at a speed of 57600
Sketch basic loop
Counter reset
Memorizing start time
Receive data from the serial port, search message 1 ("$ GPRMC")
Receive data from the serial of the port, search for message 2 ("$ GPGGA")
Receive data from the serial port, search message 3 ("$ GPVTG")
Parsing and displaying data from GLONASS \ GPS
Displays the current state of the T1 counter
Check the condition of the end of the cycle - the time has expired or the counter counted more than 100 pulses
Fixing meter and timer readings
Calculation of radioactivity
Display output
Output to the series channel
Description of the output to the built-in display.
The first line shows the number of registered pulses in the process of measuring radioactivity. The number changes about once a second.
The second line shows the calculated value of radioactivity in the previous cycle.
Next is a block of four lines. This is the output of information from the Glonass \ GPS module.
The first line - UTC time, date, number of satellites, the data from which were used in the solution calculation, a sign of the solution (letter A or V)
095623 140514 08 A - 9:56:23 UTC 05/14/2014 8 satellites and there is a solution.
The second line is the latitude and speed in km / h.
5545.13119 N means 55 degrees 45.13119 minutes north latitude
Third row longitude
03739.20397 E means 37 degrees 39.20397 minutes east
The fourth is the speed in miles per hour, the angle of movement in degrees and the height in meters.
The output of GLONASS \ GPS data is made simply - parts of the character strings are simply output without any conversion.
Next, the maximum value of the radioactivity at the time of observation is displayed.
A running graph shows the change in radioactivity over time. The graph automatically adjusts to the maximum value in the ring buffer. When you bring a compass, we get the following picture:
I will be glad to answer questions.
Source: https://habr.com/ru/post/222891/
All Articles