Sysdig - a tool for diagnosing Linux-systems

Linux collects and analyzes system information using a whole range of utilities. To diagnose each of the components of the system, a separate diagnostic tool is used.
')
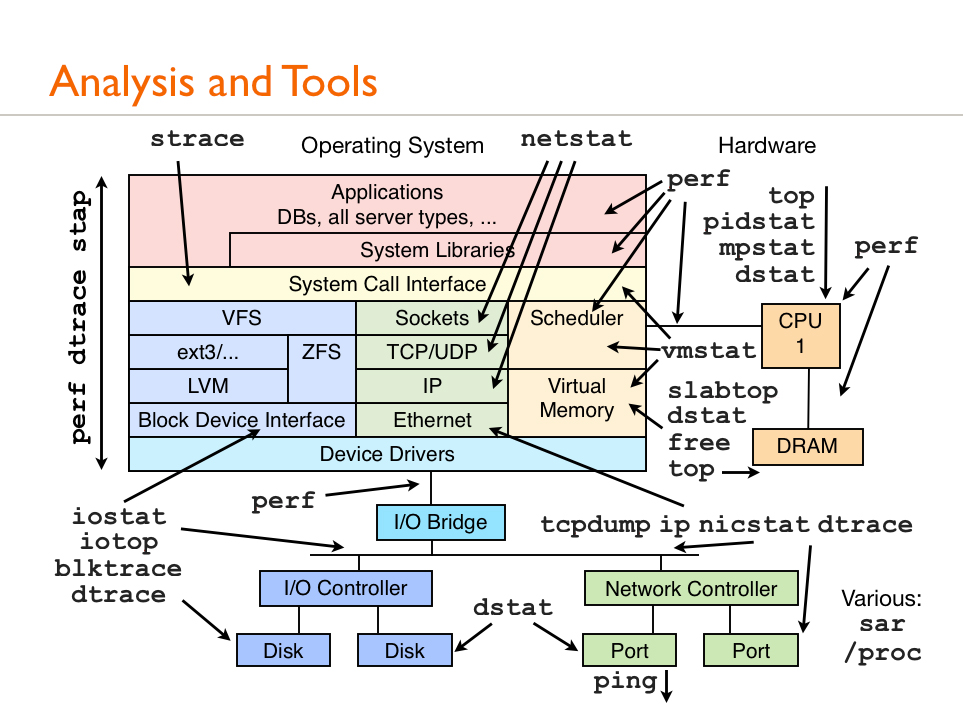
Information on the most common diagnostic tools is graphically presented in the following diagram:
We recently learned about the Sysdig utility developed by Draios . She collects information about absolutely everything:
- inbound network connections and related processes;
- about files, work with which is associated with the greatest load on the input / output system;
- about traffic in relation to the processes;
- about files and directories accessed by users;
- about system calls, files and network connections, the work with which ended with an error ...
Sysdig is positioned as a tool that greatly facilitates the work of the system administrator. After reading the article about it on the developer’s website, we decided to test it.
DTrace, Systemtap and Sysdig
Sysdig is far from the first attempt to create an advanced tool to gather information about a running Linux system.
Among the tools that are close in functionality, first of all, we should mention, first, DTrace, a dynamic trace framework developed by Sun Microsystems. It is used to monitor the amount of memory consumed, processor time, network resources that are used by active processes on a running system.
DTrace uses D scripts (a C-like language that also includes specialized functions and variables for tracing). Scripts include a list of sensors (probes), which correspond to certain actions. Sensors are triggered when a specified condition is met (for example, when opening a file or starting a process), after which the corresponding action is taken. It is possible to transfer information from one sensor to another.
DTrace is a powerful, yet challenging tool. It requires a fairly deep technical knowledge from the user. Writing and debugging D-scripts is also a time-consuming (especially for users who do not have the proper programming skills) a time-consuming process.
The Systemtap tool is very close to DTrace in terms of operation and functionality (a little over a small article about it was published on Habré a year ago). Systemtap is a command line interface and scripting language. It monitors system events and, in the event of an event, assigns a handler for it.
The events can be, for example, the start or end of a Systemtap session, a timer trigger, etc.). An event handler is a sequence of script statements that are executed when the event fires. Usually, the handlers extract information from the event context or output it to the console.
A significant disadvantage of SystemTap is the very complex syntax of the scripting language. Writing and debugging scripts also take a lot of time and effort from the user.
Unlike the aforementioned tools, Sysdig is different. By architecture, it is close to products such as libcap, tcpdump, wireshark. The special sysdig probe driver intercepts system events at the kernel level, after which the tracepoints kernel function is started, which in turn starts handlers for these events. Handlers store event information in a shared buffer. This information can then be displayed or stored in a text file.
Thanks to this architecture, sysdig does not affect system performance. Detailed information about system events can be obtained using simple commands. For some operations, ready-made scripts in the Lua language are used (we will discuss these in more detail below).
Installation
In the official repositories, sysdig is not yet included. To start the automatic installation of Sysdig, run the following command:
curl -s https://s3.amazonaws.com/download.draios.com/stable/install-sysdig | sudo bash
Manual installation procedures for various Linux distributions can be found in detail in the official documentation .
First meeting
After installation is complete, enter the following command:
# sysdig
All events occurring in the system will be recorded in the standard output:
 63889 15: 25: 12.908695644 3 notify-osd (7209)> poll fds = 3: u5 timeout = 4294967295
 63890 15: 25: 12.908698249 3 notify-osd (7209) writev fd = 3 (<u>) size = 4
 63893 15: 25: 12.908704065 2 gnome-terminal (18260)> lseek fd = 24 (/ tmp / vteIVHGFX (deleted)) offset = 0 whence = 2 (SEEK_END)
 63894 15: 25: 12.908704595 2 gnome-terminal (18260) lseek fd = 24 (/ tmp / vteIVHGFX (deleted)) offset = 0 whence = 2 (SEEK_END)
 63896 15: 25: 12.908709655 2 gnome-terminal (18260) write fd = 24 (/ tmp / vteIVHGFX (deleted)) size = 80
 63899 15: 25: 12.908710722 3 notify-osd (7209)> writev res = 4 data = + ...
 63900 15: 25: 12.908713828 3 notify-osd (7209) <poll fds = 3: u1 timeout = 4294967295
 63901 15: 25: 12.908714531 2 gnome-terminal (18260) <write res = 80 data = 1275 15: 25: 12.596942000 1 rs: main (941) <open fd = -2 (ENOENT) name = / dev / xconsole
Each output line contains information about a single event. It is displayed in the following format:
% evt.num% evt.time% evt.cpu% proc.name (% thread.tid)% evt.dir% evt.type% evt.args
The output consists of the following fields:
- evt.num - event number;
- evt.time - event time;
- evt.cpu - the number of the processor in which the event was intercepted;
- proc.name is the name of the process;
- thread.tid is the thread number (for single-threaded processes it is the same as the process number);
- evt.dir - event direction (<- for incoming processes,> - for outgoing processes);
- evt.type - event type;
- evt.args - event arguments.
Saving information in files
Event information that sysdig collects can be saved in separate files. To do this, use the command:
# sysdig -w myfile.scap
If you do not need to write information to the file about all system events, but only about a limited number of them (say, only 100 events), use the -n option:
# sysdig —n 100 —w myfile.scap
You can display information previously saved in the file using the -r option:
# sysdig -r myfile.scap
Sysdig saves a full snapshot of the operating system (running processes, active files, active users, etc.) in each file.
Filters
As we have seen from the examples above, sysdig writes all information about events to standard output. We can make it so that only the information we need is output to the console. Filters are used for this.
They are listed at the end of the line (as, for example, in tcpdump). They can be applied when recording events "on the fly", and when writing to a file. Let's try to follow the work of any command & - for example, cat:
# sysdig proc.name = cat 21368 13: 10: 15.384878134 1 cat (8298) <execve res = 0 exe = cat args = index.html. tid = 8298 (cat) pid = 8298 (cat) ptid = 1978 (bash) cwd = / root fdlimit = 1024 21371 13: 10: 15.384948635 1 cat (8298)> brk size = 0 21372 13: 10: 15.384949909 1 cat (8298) <brk res = 10665984 21373 13: 10: 15.384976208 1 cat (8298)> mmap 21374 13: 10: 15.384979452 1 cat (8298) <mmap 21375 13: 10: 15.384990980 1 cat (8298)> access 21376 13: 10: 15.384999211 1 cat (8298) <access 21377 13: 10: 15.385008602 1 cat (8298)> open 21378 13: 10: 15.385014374 1 cat (8298) <open fd = 3 (/etc/ld.so.cache) name = / etc / ld.so.cache flags = 0 (O_NONE) mode = 0 21379 13: 10: 15.385015508 1 cat (8298)> fstat fd = 3 (/etc/ld.so.cache) 21380 13: 10: 15.385016588 1 cat (8298) <fstat res = 0 21381 13: 10: 15.385017033 1 cat (8298)> mmap 21382 13: 10: 15.385019763 1 cat (8298) <mmap 21383 13: 10: 15.385020047 1 cat (8298)> close fd = 3 (/etc/ld.so.cache) 21384 13: 10: 15.385020556 1 cat (8298) <close res = 0
Let's try to apply filters. They can be specified using standard comparison operators (=,! =, <, <=,>,> =, Contains). You can also use boolean operators (or, and, not) and brackets.
Enter the following command:
# sysdig proc.name = cat and proc.name = vi
It will track all activities of the cat and vi programs:
 56239 12: 14: 01.449463618 0 BrowserBlocking (2587)> open
 56240 12: 14: 01.449467018 0 BrowserBlocking (2587) <open fd = 142 (/ proc / 16213 / statm) name = / proc / 16213 / statm flags = 1 (O_RDONLY) mode = 0
 63158 12: 14: 01.493237287 3 gnome-terminal (3910)> open
 63177 12: 14: 01.493281181 3 gnome-terminal (3910) <open fd = 18 (/ tmp / vteHGSYFX) name = / tmp / vteHGSYFX flags = 39 (O_EXCL | O_CREAT | O_RDWR) mode = 0
 63200 12: 14: 01.493309748 3 gnome-terminal (3910)> open
 63205 12: 14: 01.493319526 3 gnome-terminal (3910) <open fd = 18 (/ tmp / vteHESYFX) name = / tmp / vteHESYFX flags = 39 (O_EXCL | O_CREAT | O_RDWR) mode = 0
Team
# sysdig proc.name! = cat and evt.type = open
will display information on open events for all processes, except cat, to the console:
 2111 12: 15: 47.656367409 1 rs: main (914)> open
 2112 12: 15: 47.656368926 1 rs: main (914) open
 2114 12: 15: 47.656371170 1 rs: main (914) open
 2116 12: 15: 47.656374373 1 rs: main (914) open
 2118 12: 15: 47.656376563 1 rs: main (914) open
 2120 12: 15: 47.656378615 1 rs: main (914) open
The full list of filters can be viewed by entering the command
# sysdig -l
(for detailed explanations and comments, see here ).
Using filters, you can easily get useful and important information. For example, you can view information about incoming network connections received by all processes except apache using a simple command:
# sysdig evt.type = accept and proc.name! = apache
As mentioned above, the evt.arg and evt.rawarg fields are present in the sysdig output. You should tell about them separately. Each event recorded by sysdig is of a certain type (for example, open, read, etc.), and also has certain parameters (fd, name, etc.) that are encoded according to certain rules. We will not analyze all this in detail (interested readers refer to official documentation) and dwell on how these arguments can be used to create filters.
Consider the following command:
# sysdig evt.type = execve and evt.arg.ptid = bash
It will list the processes running by interactive users to the console. The set filter accepts execve system calls (which are used to execute programs) only if their parent process for them is bash.
The difference between evt.arg and evt.rawarg is that the latter does not decrypt process identification numbers, error codes, etc., leaving all the arguments in “raw” digital form.
For example, you can view a list of processes that caused errors using the command:
 # sysdig "evt.rawarg.res <0 or evt.rawarg.fd <0"

 257727 15: 57: 35.398754060 3 chrome (17326) <futex res = -110 (ETIMEDOUT)
 257737 15: 57: 35.399218996 0 chrome (2493) <recvfrom res = -11 (EAGAIN) data = tuple = NULL
 257749 15: 57: 35.399362914 1 Xorg (1153) <read res = -11 (EAGAIN) data =
 257834 15: 57: 35.401067094 0 chrome (2493) <recvfrom res = -11 (EAGAIN) data = tuple = NULL
 257836 15: 57: 35.401106092 0 chrome (2493) <recvfrom res = -11 (EAGAIN) data = tuple = NULL
 257849 15: 57: 35.402594284 2 chrome (4446) <futex res = -110 (ETIMEDOUT)
 257882 15: 57: 35.407348870 0 chrome (2493) <recvfrom res = -11 (EAGAIN) data = tuple = NULL
 257884 15: 57: 35.407358705 0 chrome (2493) <recvfrom res = -11 (EAGAIN) data = tuple = NULL
 257888 15: 57: 35.407373908 0 chrome (2493) <recvfrom res = -11 (EAGAIN) data = tuple = NULL
 257922 15: 57: 35.407757377 1 Xorg (1153) <read res = -11 (EAGAIN) data =
A complete list of events and parameters that can be used in filters can be viewed using the command
# sysdig -L
Formatting pins
All information that sysdig displays on the console, we can also present in the format we need. To format the output, use the option -p, after which the required output fields are specified:
 # sysdig -p "user:% user.name dir:% evt.arg.path" evt.type = chdir

 user: ubuntu dir: / root
 user: ubuntu dir: / root / tmp
 user: ubuntu dir: / root / Download
The above command collects information about the chdir system calls (they are executed each time the cd command is executed) and outputs to the console the names of the users running the cd command and the names of the directories into which they go.
The -p option uses the following syntax:
- field names are preceded by a percent sign (%);
- any text can be added to the lines (as in the C printf function);
- By default, the string is output to the console only if all the elements specified after the -p option are present in the event. If you specify an asterisk (*) at the beginning of the line, the output will be incomplete; missing fields will be labeled N / A.
Enter the command:
# sysdig -p "% evt.type% evt.dir% evt.arg.name" evt.type = open
It will only display information about open outgoing events, for example.
 open </ proc / 23533 / task / 23533 / stat
 open </ proc / 23533 / task / 23535 / stat
 open </ proc / 23533 / task / 23536 / stat
 open </ proc / 23533 / task / 23539 / stat
 open </ proc / 23533 / task / 23540 / stat
 open </ proc / 23533 / task / 23541 / stat
 open </ proc / 23533 / task / 23542 / stat
 open </ proc / 23533 / task / 23543 / stat
 open </ proc / 23533 / task / 23544 / stat
Incoming events do not have a name, so information about them is not displayed in the output.
If we enter the command
# sysdig -p "*% evt.type% evt.dir% evt.arg.name" evt.type = open
then the output will include information about outgoing events:
 open </ proc / 22832 / task / 22838 / stat
 open>
 open </ proc / 22832 / task / 22839 / stat
 open>
 open </ proc / 22832 / task / 22840 / stat
 open>
 open </ proc / 22832 / task / 22841 / stat
 open>
 open </ proc / 22832 / task / 22842 / stat
 open>
 open </ proc / 22832 / task / 22843 / stat
 open>
 open </ dev / urandom
Chiselle
To analyze the list of events in Sysdigs, small scripts written in the Lua language are used. The developers call them chisels (in the Russian translation the word chisel means “chisel”, “chisel”). For this term, one can hardly find an adequate Russian equivalent, so we decided to leave it without translation and call these scripts chisels.
You can display the list of available chizels on the console using the command:
# sysdig -cl
You can view a description of a particular chisel and a list of arguments used with it using the -i option:
 # sysdig -i fileslower

 Category: Performance
 ---------------------
 fileslower trace slow file i / o
 Flag to get detailed information about a specific chisel
 Trace file I / O slower than a threshold, or all file I / O

 Args:
 [int] min_ms - minimum millisecond threshold for showing file I / O
The launch of the chisel is done using the -c option. Let's try to run the topfiles_bytes chizel (it displays a list of files on the local machine that are accessed most):
 # sysdig -c topfiles_bytes

 Bytes filename
 ------------------------------
 3.21KB / dev / input / event4
 2.93KB / tmp / vte7IZWFX (deleted)
 864B / dev / urandom
 800B / tmp / vteL7ZWFX (deleted)
 498B / dev / ptmx
 224B / dev / dri / card0
 219B / proc / 16213 / task / 16221 / stat
 217B / proc / 16213 / task / 16229 / stat
 217B / proc / 16213 / task / 16219 / stat
 215B / proc / 16213 / task / 16225 / sta
When working with chisels, filters are also used. If, for example, we are not interested in information about the frequency of accessing files in the / dev directory, we can apply the appropriate filter:
 # sysdig -c topfiles_bytes "not fd.name contains / dev"
 Bytes filename
 ------------------------------
 1.90KB / tmp / vte7IZWFX (deleted)
 438B / proc / 16139 / task / 16145 / stat
 438B / proc / 16139 / task / 16141 / stat
 434B / proc / 16139 / task / 16150 / stat
 430B / proc / 16139 / task / 16146 / stat
 430B / proc / 16139 / task / 16147 / stat
 430B / proc / 16139 / task / 16149 / stat
 430B / proc / 16139 / task / 16148 / stat
 428B / proc / 16139 / task / 16139 / stat
 420B / proc / 16139 / task / 16142 / stat
Using filters, you can also view information about file accesses in a specific directory:
 # sysdig -c topfiles_bytes "fd.name contains / var / log /"

 Bytes filename
 ------------------------------
 596B /var/log/kern.log
 596B / var / log / syslog
 596B / var / log / messages
Another filter allows you to see which files the specified process refers to:
# sysdig -c topfiles_bytes "proc.name = vi"
You can also see which files are accessed by the user:
 $ sysdig -c topfiles_bytes "user.name = username"

 Bytes filename
 ------------------------------
 1.90KB / tmp / vte7IZWFX (deleted)
 576B / dev / urandom
 384B / tmp / vteL7ZWFX (deleted)
 355B / dev / ptmx
You can run several chizelov at the same time:
# sysdig -c stdin -c stdout proc.name = cat
As already noted, all the chizelas are written in the Lua language, so you can easily edit them or even write new ones.
A guide to writing scripts can be found here .
Examples of using
Consider examples of typical diagnostic procedures that can be performed using sysdig.
Network
View a list of all connections not serviced by Apache:
# sysdig -p "% proc.name% fd.name" "evt.type = accept and proc.name! = httpd"
View what data the server is exchanging 192.168.0.1:
in binary code:
# sysdig -s2000 -X -c echo_fds fd.cip = 192.168.0.1
ASCII:
# sysdig -s2000 -A -c echo_fds fd.cip = 192.168.0.1
View information about the processes that consume the most traffic:
 # sysdig -c topprocs_net
 Bytes process
 ------------------------------
 885B avahi daemon
 6.44KB Chrome
View server port usage statistics:
number of connections established:
# sysdig -c fdcount_by fd.sport "evt.type = accept";
amount of information sent, bytes:
# sysdig -c fdbytes_by fd.sport
View client IP information:
number of connections established:
# sysdig -c fdcount_by fd.cip "evt.type = accept"
amount of information sent, bytes:
 # sysdig -c fdbytes_by fd.cip

 Bytes fd.cip
 ------------------------------
 375B 192.168.40.99
 250B 192.168.40.255
 226B 192.168.40.101
 133B 192.168.30.88
 125B 255.255.255.255
View information about requests to an external MySQL server through Apache:
# sysdig -A -c echo_fds fd.sip = 192.168.30.5 and proc.name = apache2 and evt.buffer contains SELECT
Disk subsystem
View disk subsystem usage statistics:
 # sysdig -c topprocs_file
 Bytes process
 ------------------------------
 12.61KB BrowserBlocking
 3.89KB Xorg
 3.79KB Chrome_IOThread
 3.09KB gnome-terminal
View information about processes using a large number of files:
 # sysdig -c fdcount_by proc.name "fd.type = file"

 BrowserBlocking 365
 Chrome_IOThread 44
 irqbalance 12
 upowerd 7
 dropbox 5
 Xorg 3
 alsa-sink 2
 rs: main 2
 compiz 1
 rsyslogd 1
 gnome-terminal 1
Monitor read-write operations performed by processes:
 # sysdig -c topfiles_bytes

 Bytes filename
 ------------------------------
 5.41KB / dev / input / event4
 1.90KB / tmp / vteHGSYFX (deleted)
 576B / dev / urandom
 554B / dev / ptmx
 384B / tmp / vteHESYFX (deleted)
 219B / proc / 16139 / task / 16145 / stat
 219B / proc / 15857 / task / 15865 / stat
 219B / proc / 16139 / task / 16141 / sta
View a list of files with which apache performs the most read / write operations:
# sysdig -c topfiles_bytes proc.name = httpd
Track file opening in real time:
 # sysdig -p "% 12user.name% 6proc.pid% 12proc.name% 3fd.num% fd.typechar% fd.name" evt.type = open

 root 1143 irqbalance 3 f / proc / interrupts
 root 1143 irqbalance 3 f / proc / stat
 root 1143 irqbalance 3 f / proc / irq / 42 / smp_affinity
 root 1143 irqbalance 3 f / proc / irq / 41 / smp_affinity
 root 1143 irqbalance 3 f / proc / irq / 16 / smp_affinity
 root 1143 irqbalance 3 f / proc / irq / 43 / smp_affinity
 root 1143 irqbalance 3 f / proc / irq / 17 / smp_affinity
 root 1143 irqbalance 3 f / proc / irq / 23 / smp_affinity
 root 1143 irqbalance 3 f / proc / irq / 40 / smp_affinity
 root 1143 irqbalance 3 f / proc / irq / 10 / smp_affinity
 root 1143 irqbalance 3 f / proc / irq / 18 / smp_affinity
CPU usage
View CPU Usage Statistics:
 # sysdig -c topprocs_cpu

 CPU% Process
 ------------------------------
 0.31% sysdig
 0.09% sshd
 0.03% mysqld
 0.01% nginx
 0.01% php5-fpm
View CPU0 usage statistics:
# sysdig -c topprocs_cpu evt.cpu = 0
View standard output for the process:
# sysdig -s4096 -A -c stdout proc.name = cat
Performance and Errors
View information on opening httpd errors:
# sysdig "proc.name = httpd and evt.type = open and evt.failed = true"
View statistics on files that are spent the most time:
 # sysdig -c topfiles_time

 Time Filename
 ------------------------------
 403us / dev / urandom
 267us / dev / input / event4
 84us / dev / dri / card0
 63us / tmp / vte7IZWFX (deleted)
 34us / tmp / vteL7ZWFX (deleted)
 20us / proc / 3467 / task / 3467 / stat
 13us / dev / ptmx
 11us / proc / 16010 / task / 16010 / st
View information on processes that apache spends the most time:
# sysdig -c topfiles_time proc.name = httpd
View information about the processes that cause I / O errors:
 # sysdig -c topprocs_errors

 ------------------------------
 2363 notify-osd
 1327 Xorg
 688 compiz
 349 chrome
 82 pulseaudio
 76 gtk-window-deco
 62 gnome-terminal
 50 alsa-sink
 30 Chrome_ChildIOT
 20 gnome-screensav
 20 nautilus
 14 Chrome_IOThread
 10 syndaemon
 10 gnome-settings-
 7 soffice.bin
 6 nm-applet
 6 dbus-daemon
 4 AudioThread
 3 pidgin
 2 NetworkManager
 2 mission-control
 1 gdbus
View information about files with which I / O errors occur:
 # sysdig -c topfiles_errors

 #Errors Filename
 ------------------------------
 43 / dev / input / event4
 2 / dev / ptmx
View information about system calls that return errors:
 # sysdig -c topscalls "evt.failed = true"

 # Calls System Call
 ------------------------------
 384 recvfrom
 273 futex
 169 read
 133 sendto
 41 select
 3 recvmsg
Track errors when opening files as they appear:
 # sysdig -p & "user.name% 6proc.pid% 12proc.name% 3fd.num% fd.typechar% fd.name" evt.type = open and evt.failed = true

 root 1607 upowerd -1 f / sys / devices / LNXSYSTM: 00 / LNXSYBUS: 00 / PNP0A08: 00 / device: 0e / PNP0C09: 00 / PNP0C0A: 00 / power_supply / BAT0 / energy_now
 root 1607 upowerd -1 f / sys / devices / LNXSYSTM: 00 / LNXSYBUS: 00 / PNP0A08: 00 / device: 0e / PNP0C09: 00 / PNP0C0A: 00 / power_supply / BAT0 / energy_avg
 root 1607 upowerd -1 f / sys / devices / LNXSYSTM: 00 / LNXSYBUS: 00 / PNP0A08: 00 / device: 0e / PNP0C09: 00 / PNP0C0A: 00 / power_supply / BAT0 / voltage_max_design
 root 1607 upowerd -1 f / sys / devices / LNXSYSTM: 00 / LNXSYBUS: 00 / PNP0A08: 00 / device: 0e / PNP0C09: 00 / PNP0C0A: 00 / power_supply / BAT0 / power_now
Print a list of I / O operations, the execution of which occurs with a delay of more than 1 ms:
 # sysdig -c fileslower 1

 TIME PROCESS TYPE LAT (ms) FILE
 2014-05-13 12: 46: 57.190 rsyslogd read 3524 / proc / kmsg
 2014-05-13 12: 46: 57.197 rsyslogd read 7 / proc / kmsg
 2014-05-13 12: 46: 57.205 rsyslogd read 7 / proc / kmsg
 2014-05-13 12: 46: 57.209 rsyslogd read 4 / proc / kmsg
 2014-05-13 12: 46: 57.221 rsyslogd read 11 / proc / kmsg
 2014-05-13 12: 46: 57.225 rsyslogd read 3 / proc / kmsg
 2014-05-13 12: 46: 57.233 rsyslogd read 7 / proc / kmsg
 2014-05-13 12: 46: 57.241 rsyslogd read 7 / proc / kmsg
 2014-05-13 12: 46: 58.362 upowerd read 220 / sys / devices / LNXSYSTM: 00 / LN
Security
View information about directories visited by the root user:
# sysdig -p "% evt.arg.path" "evt.type = chdir and user.name = root"
Monitor ssh activity:
# sysdig -A -c echo_fds fd.name = / dev / ptmx and proc.name = sshd
Display all events when opening a file from the / etc directory:
 # sysdig evt.type = open and fd.name contains / etc
 97367 12: 50: 02.164137993 0 unity-panel-ser (2193) <open fd = 13 (/ etc / timezone) name = / etc / timezone flags = 1 (O_RDONLY) mode = 0
 97385 12: 50: 02.164419642 0 unity-panel-ser (2193) <open fd = 13 (/ etc / localtime) name = / etc / localtime flags = 1 (O_RDONLY) mode = 0
 97405 12: 50: 02.164642935 0 unity-panel-ser (2193) <open fd = 13 (/ etc / localtime) name = / etc / localtime flags = 1 (O_RDONLY) mode = 0
Conclusion
Sysdig - the project is still young. Among its undoubted advantages should be called a simple command syntax. In many cases, Sysdig provides more detailed information about system events than DTrace and Systemtap and presents it in a more human-readable form. Another important plus is that the analysis of the system can be performed after collecting all the data, and not simultaneously with the occurrence of an error or a problem situation.
Prospects at sysdig, undoubtedly, are, and very quite good. We hope that the product will be improved and will occupy a worthy place among the tools for diagnosing Linux-systems.
Readers who can not leave comments here are invited to our blog .
Source: https://habr.com/ru/post/222839/
All Articles